This document provides instructions for a series of tasks involving document production, data manipulation, and presentations using various software programs and file types. The tasks include editing documents and applying styles, creating and formatting a chart and table to insert into a document, building a database with related tables and generating reports, performing a mail merge, and creating a presentation with slides. Screenshots of steps are to be placed into an evidence document and various documents and a presentation are to be printed. The total mark for all tasks is 80.
![*
4
4
5
6
4
7
3
9
4
2
*
Cambridge IGCSE
™
INFORMATION AND COMMUNICATION TECHNOLOGY 0417/22
Paper 2 Document Production, Data Manipulation and Presentations May/June 2021
2 hours 30 minutes
You will need: Candidate source files (listed on page 2)
INSTRUCTIONS
● Carry out all instructions in each step.
● Enter your name, centre number and candidate number on every printout before it is sent to the printer.
● Printouts with handwritten candidate details will not be marked.
● At the end of the examination, put all your printouts into the Assessment Record Folder.
● If you have produced rough copies of printouts, put a cross through each one to indicate that it is not the
copy to be marked.
● You must not have access to either the internet or any email system during this examination.
INFORMATION
● The total mark for this paper is 80.
● The number of marks for each question or part question is shown in brackets [ ].
This document has 12 pages.
DC (CJ) 203063/2
[Turn over
© UCLES 2021](https://image.slidesharecdn.com/0417s21qp22-220209203106/85/0417-s21-qp_22-1-320.jpg)
![2
You have been supplied with the following source files:
J2122CATEGORIES.csv
J2122COMPARE.csv
J2122DUATHLON.csv
J2122EVIDENCE.rtf
J2122MULTI.rtf
J2122OUTCOMES.csv
J2122RULES.rtf
J2122SKI.jpg
J2122TABLE.csv
J2122VIOLATIONS.csv
J2122VOUCHER.rtf
Task 1 – Evidence Document
Open the file J2122EVIDENCE.rtf
Make sure that your name, centre number and candidate number will appear on every page of this
document.
Save this document in your work area as J2122EVIDENCE followed by your candidate number, for
example, J2122EVIDENCE9999
You will need your Evidence Document during the examination to place screenshots when required.
Task 2 – Document
You are going to edit a review document. A corporate house style must be used. Two paragraph
styles have already been created. An additional paragraph style must be created and applied to the
document as instructed.
1 Open the file J2122MULTI.rtf
Set the top, bottom, left and right margins to 2 centimetres.
The page setup is set to A4, portrait orientation. Do not make any changes to these settings.
The MS-body style has been created, stored and applied to the body text in the document. Do
not make any changes to this.
EVIDENCE 1
Take a screenshot to show the margin settings. Place this in your Evidence Document.
[1]
2 Save the document in your work area, in the format of the software you are using, with the file
name MSREVIEW
EVIDENCE 2
Place in your Evidence Document a screenshot to show this file has been saved. Make
sure there is evidence of the file type.
[1]
© UCLES 2021 0417/22/M/J/21](https://image.slidesharecdn.com/0417s21qp22-220209203106/85/0417-s21-qp_22-2-320.jpg)
![3
3 Place in the header the text Created by: followed by a space and your name, centre number and
candidate number left aligned.
Place in the footer automated page numbers right
aligned. Make sure that:
• all alignments match the page margins
• no other text or placeholders are included in the header or footer areas
• headers and footers are displayed on all pages.
[3]
4 Create and store the following style, basing it on the default paragraph style:
Style
name
Font
style
Font
size(poi
nts)
Alignmen
t
Enhance
ment
Line
spacing
Space
before(points)
Space
after(points)
MS-subhead sans-serif 18 centre bold, underline single 0 9
EVIDENCE 3
Place in your Evidence Document a screenshot to show that the style settings have been
defined for the MS-subhead style. Make sure this style is based on the default paragraph
style.
5 At the start of the document enter the title:
[2]
Multisport Review
6 The style name MS-title has already been created and stored.
Modify the MS-title style so only the following formatting is applied:
Style
name
Font
style
Font
size(points)
Alignmen
t
Enhance
ment
Line
spacing
Space
before(points)
Space
after(points)
MS-title serif 18 centre bold, italic single 0 0
EVIDENCE 4
Place in your Evidence Document a screenshot of these style settings for the MS-title
style.
[1]
[1]
© UCLES 2021 0417/22/M/J/21 [Turn over](https://image.slidesharecdn.com/0417s21qp22-220209203106/85/0417-s21-qp_22-3-320.jpg)
![4
7 Apply the amended MS-title style to the title text entered at step 5. [1]
8 Locate and move the paragraph:
Triathlon is an endurance contest … taking up the sport.
so that it appears as a new paragraph immediately after the subheading Triathlon
[1]
9 Change the page layout so that the subheading General Participation and all following text is
displayed in two columns of equal width with a 1 centimetre space between the columns. [2]
10 Apply square bullets to the text from
warmer winter …
to
… avalanche and landslides.
Make sure that:
• the bullets are aligned at the left margin
• the list is in single line spacing with no space before or after each line
• there is a 6 point space after the last item in the list.
[3]
11 Identify the five subheadings in the document and apply the MS-subhead style to each one. [1]
12 Using the data in the file J2122COMPARE.csv create a vertical bar chart to compare entries by
gender for only the categories that contain duathlon or triathlon. [1]
13 Label the chart with the title:
Comparison of Participation [1]
14 Display the following:
• percentage numbers only as data labels along the top of each bar
• a legend showing Men and Women
[2]
15 Format the value axis scale to display a:
• minimum value of 0%
• maximum value of 100%
[1]
© UCLES 2021 0417/22/M/J/21](https://image.slidesharecdn.com/0417s21qp22-220209203106/85/0417-s21-qp_22-4-320.jpg)
![5
16 Insert the chart after the paragraph ending … are more unpopular with women.
Make sure that:
• the chart and all data fits within the column width
• all data labels are displayed in full with no overlap.
[1]
17 Import the image J2122SKI.jpg and place it in the paragraph beginning The running is contested
…
Crop the image to remove only the bottom third (i.e. most of the snow below the
skiers). Format the cropped image so that:
• it is resized to a width of 4 centimetres with no distortion
• it is aligned to the left of the column and top of the paragraph starting The running is
contested …
• the text wraps around the image.
18 Spell check and proofread the document.
Make sure that:
• the list and chart are not split over columns or pages
• there are no widows or orphans
• there are no blank pages
• styles are applied consistently
• no changes have been made to the MS-body style
• spacing is consistent between all items.
Save the document using the same file name and format used in step 2.
Print the document.
PRINTOUT 1
Make sure your name, centre number and candidate number are on your document.
[4]
[2]
[Total: 29]
© UCLES 2021 0417/22/M/J/21 [Turn over](https://image.slidesharecdn.com/0417s21qp22-220209203106/85/0417-s21-qp_22-5-320.jpg)
![7
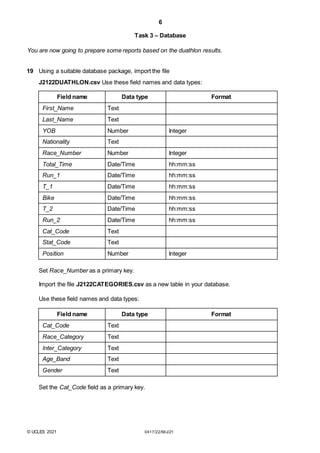
Import the file J2122OUTCOMES.csv as a new table in your database.
Use these field names and data types:
Field name Data type Format
Stat_Code Text
Status Text
Ranked Boolean/Logical To display as Yes/No
Set the Stat_Code field as a primary key.
Save the data.
EVIDENCE 5
Place in your Evidence Document screenshots showing the primary keys, field names
and data types used in all three tables.
20 Create one-to-many relationships as links between the:
• Cat_Code field in the categories table and the Cat_Code field in the duathlon table
• Stat_Code field in the outcomes table and the Stat_Code field in the duathlon table.
EVIDENCE 6
Place in your Evidence Document screenshots showing the type of relationships
between the three tables.
[4]
[1]
© UCLES 2021 0417/22/M/J/21 [Turn over](https://image.slidesharecdn.com/0417s21qp22-220209203106/85/0417-s21-qp_22-7-320.jpg)
![8
21 Enter the following details as a new record in the duathlon table:
First_Name Dean
Last_Name Cheshire
YOB 1984
Nationality GBR
Race_Number 1193
Total_Time 01:44:08
Run_1 00:29:40
T_1 00:01:20
Bike 00:52:50
T_2 00:01:58
Run_2 00:18:20
Cat_Code AGM-35
Stat_Code FIN
Position 53
Check your data entry for errors.
Save the data.
[2]
22 Using fields from all tables produce a tabular report that:
• selects the records where:
– Race_Category is Elite-Pro
– Stat_Code does not include FIN
• shows only the following fields:
Race_Number, First_Name, Last_Name, Nationality, Race_Category, Status and
Ranked
in this order, with data and labels displayed in full. Do not group the data
• sorts the data into descending order of Status
• has a page orientation of portrait
• fits on a single page
• includes only the text Non-Ranking Elite Athletes as a title displayed in a larger font
size at the top of the page
• has your name, centre number and candidate number on the report.
Save and print your report.
PRINTOUT 2
Make sure that you have entered your name, centre number and candidate number on
your report.
[6]
© UCLES 2021 0417/22/M/J/21](https://image.slidesharecdn.com/0417s21qp22-220209203106/85/0417-s21-qp_22-8-320.jpg)
![9
23 Using fields from the duathlon and categories tables, produce a tabular report that:
• selects the records where:
– Nationality is GBR or IRL
– Gender is Male
– YOB is between 1982 and 2001 inclusive
• contains a new field called Athlete_Age which is calculated at run-time to deduct YOB
from the current year (2021). Format this field to display integer format
• shows only the following fields:
First_Name, Last_Name, Nationality, Gender, YOB, Athlete_Age, Run_1, T_1, Bike,
T_2, Run_2, Total_Time and Position
in this order, with data and labels displayed in full. Do not group the data
• sorts the data into ascending order of Nationality and descending order of Position
• has a page orientation of landscape
• fits on a single page wide
• includes only the text Senior Male UK Results as a title displayed in a larger font size
at the top of the page
• calculates the number of athletes and places this at the end of the report, formatted as
an integer
• has a label Number of athletes to the left of this value
• displays only your name, centre number and candidate number in the footer so it appears in
the same position on every page. Make sure no other data is displayed in the footer.
Save and print your report.
PRINTOUT 3
Make sure that you have entered your name, centre number and candidate number
on your report.
EVIDENCE 7
Place in your Evidence Document a screenshot showing the database formula used to
calculate the number of athletes.
24 Export the report created in step 23 in portable document format (pdf).
Save the exported file in your work area with the file name SENIOR
EVIDENCE 8
Place in your Evidence Document a screenshot to show the exported file saved in your
work area. Make sure there is evidence of the file type.
[14]
[2]
[Total: 29]
© UCLES 2021 0417/22/M/J/21 [Turn over](https://image.slidesharecdn.com/0417s21qp22-220209203106/85/0417-s21-qp_22-9-320.jpg)
![10
Task 4 – Mail merge
You are required to carry out a mail merge.
25 Create a mail merge document using the file J2122VOUCHER.rtf as the master document and
J2122VIOLATIONS.csv as your data source file.
Enter your name, centre number and candidate number in the header of the document.
[1]
26 Replace the text and chevrons in the master document with the merge fields from the data
source file as follows:
Text and chevrons to replace Replace with merge field
<NAME> Full_Name
<CTRY> Country
<RN> Race_Number
<CB> Club
<GEND> Gender
<CAT> Race_Category
<SEG> Discipline
<WHEN> Time_Incurred
<VIOL> Violation
<PEN> Penalty
<DUR> Duration
<OFFICER> Tech_Officer
Replace <DATE> with a field to display today’s date in the format dddd, dd MMMM yyyy
Make sure the spacing, punctuation, alignment and enhancements in the original master
document are maintained.
Save and print your master document showing the merge field codes.
EVIDENCE 9
Take screenshot evidence of the date field code showing the dddd, dd MMMM yyyy format
used. Place this screenshot in your Evidence Document.
PRINTOUT 4
Make sure you have entered your name, centre number and candidate number on
your master document.
[6]
© UCLES 2021 0417/22/M/J/21](https://image.slidesharecdn.com/0417s21qp22-220209203106/85/0417-s21-qp_22-10-320.jpg)
![11
27 Set an automated filter to select competitors where:
• Discipline is Transition_2
• Duration is 2 or more
EVIDENCE 10
Place in your Evidence Document a screenshot to show the use of an automated
selection method.
28 Merge and print the vouchers for the selected competitors
only. Save and close the files.
PRINTOUT 5
Print the result of the merge. Make sure you have entered your name, centre number
and candidate number on your vouchers.
[1]
[1]
[Total: 9]
Task 5 – Printing the Evidence
Document Save and print your Evidence Document.
PRINTOUT 6
Make sure that your name, centre number and candidate number appear on every
page of your Evidence Document.
Task 6 – Presentation
You are going to create a short presentation.
All slides must have a consistent layout and formatting. Unless otherwise instructed, slides must be
formatted to display a title and bulleted list.
29 Create a presentation of 6 slides using the file J2122RULES.rtf
Place in the footer your name, centre number and candidate
number. The footer must be displayed on all slides.
[1]
30 On the slide with the title Transition demote the last 3 bulleted items so they look like this:
• competitorsmustnot:
– impede the progress of other competitors
– interfere with another competitor’s equipment
– cycle in the transition area
[2]
© UCLES 2021 0417/22/M/J/21 [Turn over](https://image.slidesharecdn.com/0417s21qp22-220209203106/85/0417-s21-qp_22-11-320.jpg)
![12
31 Change the layout of the slide with the title Common Penalties to a title and table.
Create a table that contains 4 columns and 13 rows.
Copy the data from the file J2122TABLE.csv and place this in the table.
[2]
32 Format the table so that:
• a plain table style is applied with no cell shading
• all internal and external gridlines are displayed when printed.
[1]
33 Insert 2 new rows as the first 2 rows of the table.
Enter the text and format rows 1 and 2 of the table so they look like this:
Type of Penalty
Conduct
Stop and Go Time Disqualification
[5]
34 Adjust the column widths so:
• data in column 1 is displayed on one line
• the table fits on the slide with all data fully visible.
[1]
35 Save the presentation.
Print all slides in the presentation as handouts with 2 slides to the page, each slide filling half the
page.
PRINTOUT 7
Print this handout. Make sure your name, centre number and candidate number are on
all slides.
[1]
[Total: 13]
Permission to reproduce items where third-party owned material protected by copy right is included has been sought and cleared where possible. Ev ery
reasonable ef f ort has been made by the publisher (UCLES) to trace copy right holders, but if any items requiring clearance hav e unwittingly been included, the
publisher will be pleased to make amends at the earliest possible opportunity .
To av oid the issue of disclosure of answer- related inf ormation to candidates, all copy right acknowledgements are reproduced online in the Cambridge
Assessment International Education Copy right Acknowledgements Booklet. This is produced f or each series of examinations and is f reely av ailable to download
at www.cambridgeinternational.org af ter the liv e examination series.
Cambridge Assessment International Education is part of the Cambridge Assessment Group. Cambridge Assessment is the brand name of the Univ ersity of
Cambridge Local Examinations Sy ndicate (UCLES), which itself is a department of the Univ ersity of Cambridge.
© UCLES 2021 0417/22/M/J/21](https://image.slidesharecdn.com/0417s21qp22-220209203106/85/0417-s21-qp_22-12-320.jpg)