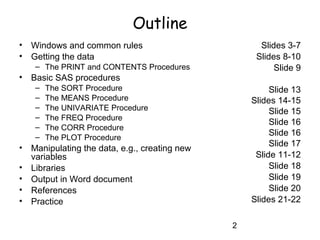
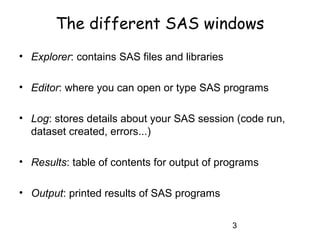
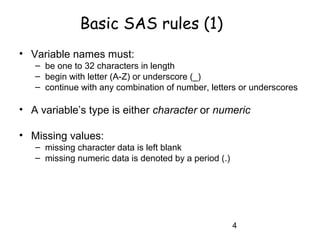
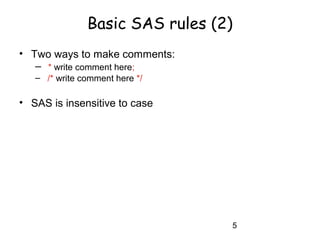
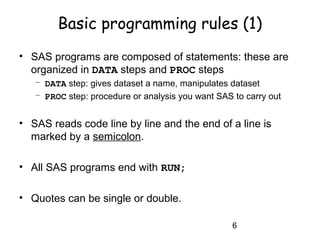
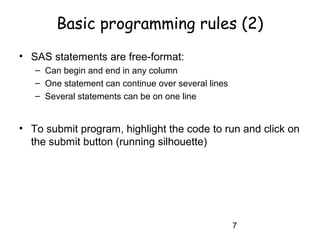
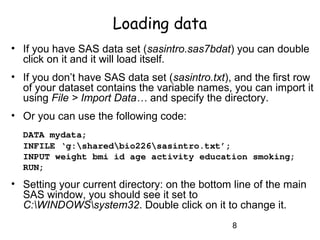
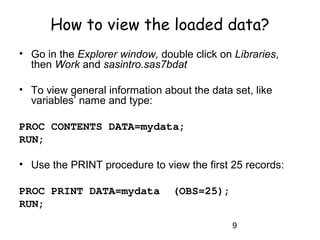
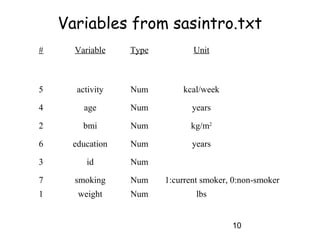
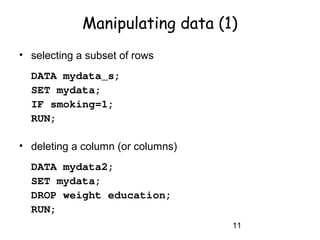
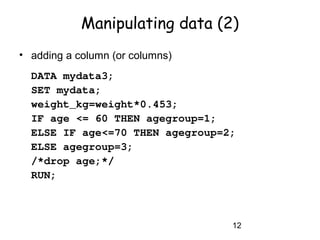
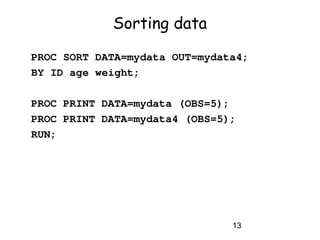
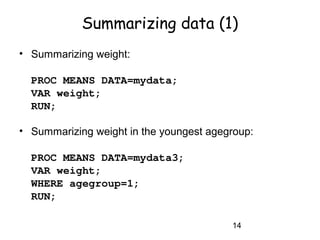
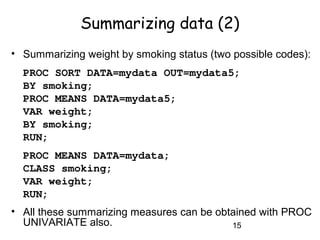
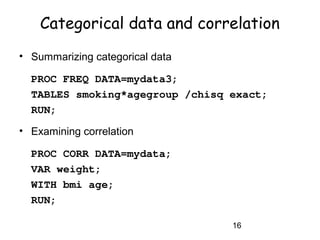
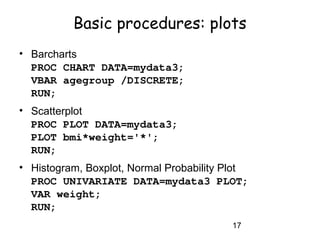
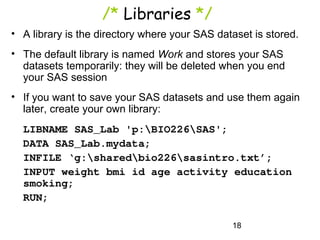
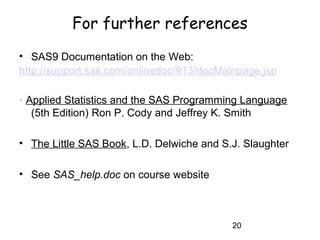
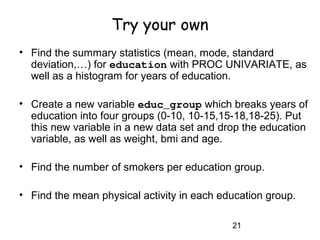
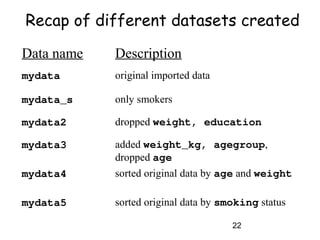
Introduction to SAS
BIO 226 – Spring 2011
2
Outline
• Windows and common rules
• Getting the data
– The PRINT and CONTENTS Procedures
• Basic SAS procedures
– The SORT Procedure
– The MEANS Procedure
– The UNIVARIATE Procedure
– The FREQ Procedure
– The CORR Procedure
– The PLOT Procedure
• Manipulating the data, e.g., creating new
variables
• Libraries
• Output in Word document
• References
• Practice
Slides 3-7
Slides 8-10
Slide 9
Slide 13
Slides 14-15
Slide 15
Slide 16
Slide 16
Slide 17
Slide 11-12
Slide 18
Slide 19
Slide 20
Slides 21-22
3
The different SAS windows
• Explorer: contains SAS files and libraries
• Editor: where you can open or type SAS programs
• Log: stores details about your SAS session (code run,
dataset created, errors...)
• Results: table of contents for output of programs
• Output: printed results of SAS programs
4
Basic SAS rules (1)
• Variable names must:
– be one to 32 characters in length
– begin with letter (A-Z) or underscore (_)
– continue with any combination of number, letters or underscores
• A variable’s type is either character or numeric
• Missing values:
– missing character data is left blank
– missing numeric data is denoted by a period (.)
5
Basic SAS rules (2)
• Two ways to make comments:
– * write comment here;
– /* write comment here */
• SAS is insensitive to case
6
Basic programming rules (1)
• SAS programs are composed of statements: these are
organized in DATA steps and PROC steps
– DATA step: gives dataset a name, manipulates dataset
– PROC step: procedure or analysis you want SAS to carry out
• SAS reads code line by line and the end of a line is
marked by a semicolon.
• All SAS programs end with RUN;
• Quotes can be single or double.
7
Basic programming rules (2)
• SAS statements are free-format:
– Can begin and end in any column
– One statement can continue over several lines
– Several statements can be on one line
• To submit program, highlight the code to run and click on
the submit button (running silhouette)
8
Loading data
• If you have SAS data set (sasintro.sas7bdat) you can double
click on it and it will load itself.
• If you don’t have SAS data set (sasintro.txt), and the first row
of your dataset contains the variable names, you can import it
using File > Import Data… and specify the directory.
• Or you can use the following code:
DATA mydata;
INFILE ‘g:sharedbio226sasintro.txt’;
INPUT weight bmi id age activity education smoking;
RUN;
• Setting your current directory: on the bottom line of the main
SAS window, you should see it set to
C:WINDOWSsystem32. Double click on it to change it.
9
How to view the loaded data?
• Go in the Explorer window, double click on Libraries,
then Work and sasintro.sas7bdat
• To view general information about the data set, like
variables’ name and type:
PROC CONTENTS DATA=mydata;
RUN;
• Use the PRINT procedure to view the first 25 records:
PROC PRINT DATA=mydata (OBS=25);
RUN;
10
Variables from sasintro.txt
# Variable Type Unit
5 activity Num kcal/week
4 age Num years
2 bmi Num kg/m2
6 education Num years
3 id Num
7 smoking Num 1:current smoker, 0:non-smoker
1 weight Num lbs
11
Manipulating data (1)
• selecting a subset of rows
DATA mydata_s;
SET mydata;
IF smoking=1;
RUN;
• deleting a column (or columns)
DATA mydata2;
SET mydata;
DROP weight education;
RUN;
12
Manipulating data (2)
• adding a column (or columns)
DATA mydata3;
SET mydata;
weight_kg=weight*0.453;
IF age <= 60 THEN agegroup=1;
ELSE IF age<=70 THEN agegroup=2;
ELSE agegroup=3;
/*drop age;*/
RUN;
13
Sorting data
PROC SORT DATA=mydata OUT=mydata4;
BY ID age weight;
PROC PRINT DATA=mydata (OBS=5);
PROC PRINT DATA=mydata4 (OBS=5);
RUN;
14
Summarizing data (1)
• Summarizing weight:
PROC MEANS DATA=mydata;
VAR weight;
RUN;
• Summarizing weight in the youngest agegroup:
PROC MEANS DATA=mydata3;
VAR weight;
WHERE agegroup=1;
RUN;
15
Summarizing data (2)
• Summarizing weight by smoking status (two possible codes):
PROC SORT DATA=mydata OUT=mydata5;
BY smoking;
PROC MEANS DATA=mydata5;
VAR weight;
BY smoking;
RUN;
PROC MEANS DATA=mydata;
CLASS smoking;
VAR weight;
RUN;
• All these summarizing measures can be obtained with PROC
UNIVARIATE also.
16
Categorical data and correlation
• Summarizing categorical data
PROC FREQ DATA=mydata3;
TABLES smoking*agegroup /chisq exact;
RUN;
• Examining correlation
PROC CORR DATA=mydata;
VAR weight;
WITH bmi age;
RUN;
17
Basic procedures: plots
• Barcharts
PROC CHART DATA=mydata3;
VBAR agegroup /DISCRETE;
RUN;
• Scatterplot
PROC PLOT DATA=mydata3;
PLOT bmi*weight='*';
RUN;
• Histogram, Boxplot, Normal Probability Plot
PROC UNIVARIATE DATA=mydata3 PLOT;
VAR weight;
RUN;
18
/* Libraries */
• A library is the directory where your SAS dataset is stored.
• The default library is named Work and stores your SAS
datasets temporarily: they will be deleted when you end
your SAS session
• If you want to save your SAS datasets and use them again
later, create your own library:
LIBNAME SAS_Lab 'p:BIO226SAS';
DATA SAS_Lab.mydata;
INFILE ‘g:sharedbio226sasintro.txt’;
INPUT weight bmi id age activity education
smoking;
RUN;
19
SAS output and Word
• To send you SAS output to a Word document:
ODS RTF FILE=‘p:output.RTF’ style=minimal;
PROC CORR DATA =mydata;
VAR weight;
WITH bmi age;
RUN;
ODS RTF CLOSE;
• Other styles: Journal, Analysis, Statistical
20
For further references
• SAS9 Documentation on the Web:
http://support.sas.com/onlinedoc/913/docMainpage.jsp
• Applied Statistics and the SAS Programming Language
(5th Edition) Ron P. Cody and Jeffrey K. Smith
• The Little SAS Book, L.D. Delwiche and S.J. Slaughter
• See SAS_help.doc on course website
21
Try your own
• Find the summary statistics (mean, mode, standard
deviation,…) for education with PROC UNIVARIATE, as
well as a histogram for years of education.
• Create a new variable educ_group which breaks years of
education into four groups (0-10, 10-15,15-18,18-25). Put
this new variable in a new data set and drop the education
variable, as well as weight, bmi and age.
• Find the number of smokers per education group.
• Find the mean physical activity in each education group.
22
Data name Description
mydata original imported data
mydata_s only smokers
mydata2 dropped weight, education
mydata3 added weight_kg, agegroup,
dropped age
mydata4 sorted original data by age and weight
mydata5 sorted original data by smoking status
Recap of different datasets created

INTRODUCTION TO SAS

  • 1.
    Introduction to SAS BIO226 – Spring 2011
  • 2.
    2 Outline • Windows andcommon rules • Getting the data – The PRINT and CONTENTS Procedures • Basic SAS procedures – The SORT Procedure – The MEANS Procedure – The UNIVARIATE Procedure – The FREQ Procedure – The CORR Procedure – The PLOT Procedure • Manipulating the data, e.g., creating new variables • Libraries • Output in Word document • References • Practice Slides 3-7 Slides 8-10 Slide 9 Slide 13 Slides 14-15 Slide 15 Slide 16 Slide 16 Slide 17 Slide 11-12 Slide 18 Slide 19 Slide 20 Slides 21-22
  • 3.
    3 The different SASwindows • Explorer: contains SAS files and libraries • Editor: where you can open or type SAS programs • Log: stores details about your SAS session (code run, dataset created, errors...) • Results: table of contents for output of programs • Output: printed results of SAS programs
  • 4.
    4 Basic SAS rules(1) • Variable names must: – be one to 32 characters in length – begin with letter (A-Z) or underscore (_) – continue with any combination of number, letters or underscores • A variable’s type is either character or numeric • Missing values: – missing character data is left blank – missing numeric data is denoted by a period (.)
  • 5.
    5 Basic SAS rules(2) • Two ways to make comments: – * write comment here; – /* write comment here */ • SAS is insensitive to case
  • 6.
    6 Basic programming rules(1) • SAS programs are composed of statements: these are organized in DATA steps and PROC steps – DATA step: gives dataset a name, manipulates dataset – PROC step: procedure or analysis you want SAS to carry out • SAS reads code line by line and the end of a line is marked by a semicolon. • All SAS programs end with RUN; • Quotes can be single or double.
  • 7.
    7 Basic programming rules(2) • SAS statements are free-format: – Can begin and end in any column – One statement can continue over several lines – Several statements can be on one line • To submit program, highlight the code to run and click on the submit button (running silhouette)
  • 8.
    8 Loading data • Ifyou have SAS data set (sasintro.sas7bdat) you can double click on it and it will load itself. • If you don’t have SAS data set (sasintro.txt), and the first row of your dataset contains the variable names, you can import it using File > Import Data… and specify the directory. • Or you can use the following code: DATA mydata; INFILE ‘g:sharedbio226sasintro.txt’; INPUT weight bmi id age activity education smoking; RUN; • Setting your current directory: on the bottom line of the main SAS window, you should see it set to C:WINDOWSsystem32. Double click on it to change it.
  • 9.
    9 How to viewthe loaded data? • Go in the Explorer window, double click on Libraries, then Work and sasintro.sas7bdat • To view general information about the data set, like variables’ name and type: PROC CONTENTS DATA=mydata; RUN; • Use the PRINT procedure to view the first 25 records: PROC PRINT DATA=mydata (OBS=25); RUN;
  • 10.
    10 Variables from sasintro.txt #Variable Type Unit 5 activity Num kcal/week 4 age Num years 2 bmi Num kg/m2 6 education Num years 3 id Num 7 smoking Num 1:current smoker, 0:non-smoker 1 weight Num lbs
  • 11.
    11 Manipulating data (1) •selecting a subset of rows DATA mydata_s; SET mydata; IF smoking=1; RUN; • deleting a column (or columns) DATA mydata2; SET mydata; DROP weight education; RUN;
  • 12.
    12 Manipulating data (2) •adding a column (or columns) DATA mydata3; SET mydata; weight_kg=weight*0.453; IF age <= 60 THEN agegroup=1; ELSE IF age<=70 THEN agegroup=2; ELSE agegroup=3; /*drop age;*/ RUN;
  • 13.
    13 Sorting data PROC SORTDATA=mydata OUT=mydata4; BY ID age weight; PROC PRINT DATA=mydata (OBS=5); PROC PRINT DATA=mydata4 (OBS=5); RUN;
  • 14.
    14 Summarizing data (1) •Summarizing weight: PROC MEANS DATA=mydata; VAR weight; RUN; • Summarizing weight in the youngest agegroup: PROC MEANS DATA=mydata3; VAR weight; WHERE agegroup=1; RUN;
  • 15.
    15 Summarizing data (2) •Summarizing weight by smoking status (two possible codes): PROC SORT DATA=mydata OUT=mydata5; BY smoking; PROC MEANS DATA=mydata5; VAR weight; BY smoking; RUN; PROC MEANS DATA=mydata; CLASS smoking; VAR weight; RUN; • All these summarizing measures can be obtained with PROC UNIVARIATE also.
  • 16.
    16 Categorical data andcorrelation • Summarizing categorical data PROC FREQ DATA=mydata3; TABLES smoking*agegroup /chisq exact; RUN; • Examining correlation PROC CORR DATA=mydata; VAR weight; WITH bmi age; RUN;
  • 17.
    17 Basic procedures: plots •Barcharts PROC CHART DATA=mydata3; VBAR agegroup /DISCRETE; RUN; • Scatterplot PROC PLOT DATA=mydata3; PLOT bmi*weight='*'; RUN; • Histogram, Boxplot, Normal Probability Plot PROC UNIVARIATE DATA=mydata3 PLOT; VAR weight; RUN;
  • 18.
    18 /* Libraries */ •A library is the directory where your SAS dataset is stored. • The default library is named Work and stores your SAS datasets temporarily: they will be deleted when you end your SAS session • If you want to save your SAS datasets and use them again later, create your own library: LIBNAME SAS_Lab 'p:BIO226SAS'; DATA SAS_Lab.mydata; INFILE ‘g:sharedbio226sasintro.txt’; INPUT weight bmi id age activity education smoking; RUN;
  • 19.
    19 SAS output andWord • To send you SAS output to a Word document: ODS RTF FILE=‘p:output.RTF’ style=minimal; PROC CORR DATA =mydata; VAR weight; WITH bmi age; RUN; ODS RTF CLOSE; • Other styles: Journal, Analysis, Statistical
  • 20.
    20 For further references •SAS9 Documentation on the Web: http://support.sas.com/onlinedoc/913/docMainpage.jsp • Applied Statistics and the SAS Programming Language (5th Edition) Ron P. Cody and Jeffrey K. Smith • The Little SAS Book, L.D. Delwiche and S.J. Slaughter • See SAS_help.doc on course website
  • 21.
    21 Try your own •Find the summary statistics (mean, mode, standard deviation,…) for education with PROC UNIVARIATE, as well as a histogram for years of education. • Create a new variable educ_group which breaks years of education into four groups (0-10, 10-15,15-18,18-25). Put this new variable in a new data set and drop the education variable, as well as weight, bmi and age. • Find the number of smokers per education group. • Find the mean physical activity in each education group.
  • 22.
    22 Data name Description mydataoriginal imported data mydata_s only smokers mydata2 dropped weight, education mydata3 added weight_kg, agegroup, dropped age mydata4 sorted original data by age and weight mydata5 sorted original data by smoking status Recap of different datasets created