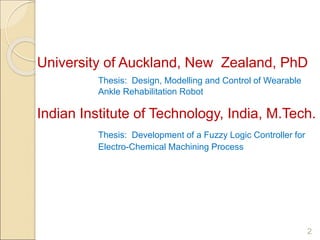
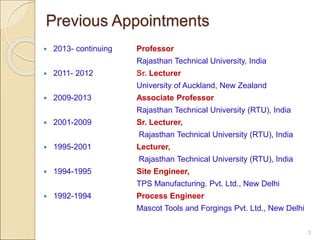
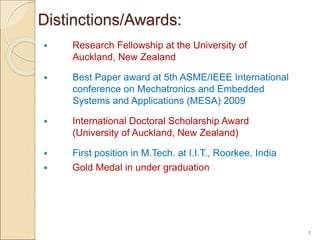
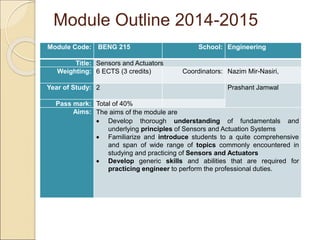
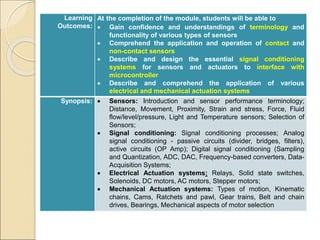
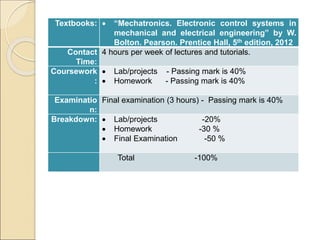
1
Established in 1883
Prashant Kumar Jamwal
Established in 2009 Established in 1847
University of Auckland, New Zealand, PhD
Thesis: Design, Modelling and Control of Wearable
Ankle Rehabilitation Robot
Indian Institute of Technology, India, M.Tech.
Thesis: Development of a Fuzzy Logic Controller for
Electro-Chemical Machining Process
2
 2013- continuing Professor
Rajasthan Technical University, India
 2011- 2012 Sr. Lecturer
University of Auckland, New Zealand
 2009-2013 Associate Professor
Rajasthan Technical University (RTU), India
 2001-2009 Sr. Lecturer,
Rajasthan Technical University (RTU), India
 1995-2001 Lecturer,
Rajasthan Technical University (RTU), India
 1994-1995 Site Engineer,
TPS Manufacturing. Pvt. Ltd., New Delhi
 1992-1994 Process Engineer
Mascot Tools and Forgings Pvt. Ltd., New Delhi
3
Previous Appointments
 Research Fellowship at the University of
Auckland, New Zealand
 Best Paper award at 5th ASME/IEEE International
conference on Mechatronics and Embedded
Systems and Applications (MESA) 2009
 International Doctoral Scholarship Award
(University of Auckland, New Zealand)
 First position in M.Tech. at I.I.T., Roorkee, India
 Gold Medal in under graduation
4
Distinctions/Awards:
SCHOOL OF
ENGINEERING
Sensors and
Actuators
Pr. Nazim Mir-Nasiri &
Pr. Prashant Jamwal
Module Outline 2014-2015
Module Code: BENG 215 School: Engineering
Title: Sensors and Actuators
Weighting: 6 ECTS (3 credits) Coordinators: Nazim Mir-Nasiri,
Year of Study: 2 Prashant Jamwal
Pass mark: Total of 40%
Aims: The aims of the module are
 Develop thorough understanding of fundamentals and
underlying principles of Sensors and Actuation Systems
 Familiarize and introduce students to a quite comprehensive
and span of wide range of topics commonly encountered in
studying and practicing of Sensors and Actuators
 Develop generic skills and abilities that are required for
practicing engineer to perform the professional duties.
Learning
Outcomes:
At the completion of the module, students will be able to
 Gain confidence and understandings of terminology and
functionality of various types of sensors
 Comprehend the application and operation of contact and
non-contact sensors
 Describe and design the essential signal conditioning
systems for sensors and actuators to interface with
microcontroller
 Describe and comprehend the application of various
electrical and mechanical actuation systems
Synopsis:  Sensors: Introduction and sensor performance terminology;
Distance, Movement, Proximity, Strain and stress, Force, Fluid
flow/level/pressure, Light and Temperature sensors; Selection of
Sensors;
 Signal conditioning: Signal conditioning processes; Analog
signal conditioning - passive circuits (divider, bridges, filters),
active circuits (OP Amp); Digital signal conditioning (Sampling
and Quantization, ADC, DAC, Frequency-based converters, Data-
Acquisition Systems;
 Electrical Actuation systems: Relays, Solid state switches,
Solenoids, DC motors, AC motors, Stepper motors;
 Mechanical Actuation systems: Types of motion, Kinematic
chains, Cams, Ratchets and pawl, Gear trains, Belt and chain
drives, Bearings, Mechanical aspects of motor selection
Textbooks:  “Mechatronics. Electronic control systems in
mechanical and electrical engineering” by W.
Bolton. Pearson. Prentice Hall, 5th edition, 2012
Contact
Time:
4 hours per week of lectures and tutorials.
Coursework
:
 Lab/projects - Passing mark is 40%
 Homework - Passing mark is 40%
Examinatio
n:
Final examination (3 hours) - Passing mark is 40%
Breakdown:  Lab/projects -20%
 Homework -30 %
 Final Examination -50 %
Total -100%
Sensors and Transducers
(definition)
Pr. Nazim Mir-Nasiri & Pr. Prashant
•Sensors are used for an element which produces
a signal relating the quantity being measured
(example, temperature sensor transforms an input
temperature into a change in resistance)
•Transducers are defined as elements that when
subject to some physical change experience a
related change
•Sensors are also transducers sometimes.
Sensors Specifications
Sensors performance terminology
and specifications
Pr. Nazim Mir-Nasiri & Pr. Prashant
1. Range and span
Range defines the limits between which the input can vary
Span is the maximum value of the input minus the minimum
value. Example, a load cell for the measurement of forces
might have a range of 0 to 50 kN and span of 50 kN
2. Error is the difference between the results of the
measurement and the true value of the quantity being
measured
Error= measured value – true value
Example, if the measured temperature is 25C when the actual
is 24, then the error is +1C. Instead if the measured value
was 26, then the error should be -1
Sensors performance terminology
and specifications
Pr. Nazim Mir-Nasiri & Pr. Prashant
3. Accuracy is the extent to which the value indicated by a
measurement system might be wrong. In other words, it is the
summation of all the possible errors that are likely to occur
Example, the temperature – measuring instrument may be
specified as having an accuracy of  2C of the true value . It
means that the reading given by the instrument can be
expected to lie within + or – 2C of the true value
Accuracy is often expressed as a percentage of the full range
output or full-scale deflection
Example, the reading may be specified as having an accuracy
of  5% of full range output. Then if the range of the sensor is 0
to 200 the reading given can be expected to be within + or –
10C of the true reading
Sensors performance terminology
and specifications
Pr. Nazim Mir-Nasiri & Pr. Prashant Jamwal
4.Sensitivity is relationship indicating how much output you
get per unit of input, i.e. input/output relationships.
Example, a resistance thermometer may have a sensitivity
of 0.5 /C. The higher sensitivity is the better quality of it.
.
This term is also frequently used to indicate the sensitivity
to inputs other than being measured, i.e. environmental
changes such environmental temperature or fluctuation the in
the mains voltage supply. Example, the pressure transducer
may have a temperature sensitivity of 0.1 % of the reading per
C change in temperature.
Sensors performance terminology
and specifications
5. Hysteresis error is due to the fact that transducers can give
different outputs from the same value of quantity being
measured according to whether that value has been reached
by a continuously increasing or decreasing change . It is the
maximum difference in output for increasing and decreasing
values
Sensors performance terminology
and specifications
6. Non-linearity error is due to the fact that most of the
transducers have nonlinear relationships between the output
and input. However, a linear relationship is assumed in many
cases. The error is defined as the maximum difference from the
linear behavior.
Various methods are used for the numerical expression of the
non-linearity error . The error is generally quoted as a
percentage of the full range output.
Example, 0.5 % of the full range.
Sensors performance terminology
and specifications
6. Non-linearity error
a. The error is defined as the
difference between the curve
and the straight line joining the
output values at the end points
of the range
Sensors performance terminology
and specifications
6. Non-linearity error
b. The error is defined as the
difference between the curve
and the straight line drawn by
using the method of least
squares that defines the best fit
line when all data values are
considered equally likely to be
in error.
Sensors performance terminology
and specifications
6. Non-linearity error
c. The error is defined as the
difference between the curve
and the straight line drawn by
using the method of least
squares that defines the best fit
line which passes through the
zero point.
Sensors performance terminology
and specifications
7. Repeatability/reproducibility of a transducer are used to
describe its ability to give the same output for repeated
application of the same input value. It is usually expressed as a
percentage of the full output.
Repeatability =
Sensors performance terminology
and specifications
8. Stability of a transducer is its ability to give the same output
when used to measure a constant input over a period of time.
The term drift is often used to describe the change in output
that occurs over time. Can be expressed as a percentage of
the full range output.
The term zero drift is used for the change that occur in the
output when there is zero input.
Sensors performance terminology
and specifications
8. Dead band/time of a transducer is the range of input values
for which there is no output.
Example, bearing friction in a flow meter using a rotor might
mean that there is no output until the input has reached a
particular velocity threshold .
The dead time is the length of time from the application of an
input until the output begins to respond and change.
Sensors performance terminology
and specifications
8. Resolution.
When the input varies continuously over the range, the output
signals for some sensors may change in small steps.
The resolution is the smallest change in the input value that will
produce an observable change in the output
Example, in wire-wound potentiometer the output going up in
steps as the potentiometer slides mover from one wire turn to
the next. The resolution of it can be specified, say, 0.5 or
percentage of the full-scale deflection.
For a sensor giving a digital output the smallest change in
output is 1 bit. The higher number of bits the better is the
resolution, i.e. it is smaller. The sensor with data word of N bits
digital or a total of 2N decimal, the resolution is 1/ 2N
Sensors performance terminology
and specifications
8. Output impedance (loading effects)
When a sensor giving an electrical output is interfaced with an
electronic circuits it is necessary to know the output impedance
since this impedance is being connected in either series or
parallel with that circuit.
The inclusion of the sensor can significantly modify the
behavior of the system to which it is connected.
Sensors performance terminology
and specifications
Example of the specification of a strain gauge pressure sensor
Static and Dynamic Characteristics of
Sensors
•The static characteristics are the values given when steady-
state conditions occur, i.e. the values given when the
transducer has settled after having received some input
• The dynamic characteristics refer to the behavior (or system
response) between the time that the input value changes and
the time when the output settles down to the steady-state value
Example, the input might be a step input when the input is
suddenly changed from 0 to a constant value, or a ramp input
when the input is changed at a steady rate, or a sinusoidal
input of a specified frequency
Static and Dynamic Characteristics of
Sensors
•Response time is the time which
elapses after a constant step
input is applied to the transducer
up to the point at which the
transducer gives an output
corresponding to some
percentage, e.g. 95% of the input
.
Example, mercury-in-glass
thermometer is put into a hot
liquid there can be as much as
100 s elapsed before the
thermometer indicates 95% of the
actual temperature of the liquid.
•
Static and Dynamic Characteristics of
Sensors
•Time constant is the 63.2%
response time. It is a measure of
the inertia of sensor and so how
fast it will react to changes in its
input. The bigger the time
constant the slower will be its
reaction to a changing input
• Rise time is the time taken for
the output to rise to some
specified percentage of the
steady-state output, for example
from 10% to 90% of the steady-
state
Static and Dynamic Characteristics of
Sensors
•Settling time is the time taken for the output to settle to within
some percentage, e.g. 2% of the steady-state value
Example. Consider the following data which indicates how an
instrument reading changed with time, being obtained from a
thermometer plunged into a liquid at time t=0 s. The 95%
response time is required
Static and Dynamic Characteristics of
Sensors
Example. Fig. shows the graph of
how the temperature indicated by the
thermometer varies with time. The
steady-state value is 55C and so,
since 95% of 55 is 52.25, the 95%
repose time is about 228 s.
 THANK YOU

01. Sensors and Actuators.ppt

  • 1.
    1 Established in 1883 PrashantKumar Jamwal Established in 2009 Established in 1847
  • 2.
    University of Auckland,New Zealand, PhD Thesis: Design, Modelling and Control of Wearable Ankle Rehabilitation Robot Indian Institute of Technology, India, M.Tech. Thesis: Development of a Fuzzy Logic Controller for Electro-Chemical Machining Process 2
  • 3.
     2013- continuingProfessor Rajasthan Technical University, India  2011- 2012 Sr. Lecturer University of Auckland, New Zealand  2009-2013 Associate Professor Rajasthan Technical University (RTU), India  2001-2009 Sr. Lecturer, Rajasthan Technical University (RTU), India  1995-2001 Lecturer, Rajasthan Technical University (RTU), India  1994-1995 Site Engineer, TPS Manufacturing. Pvt. Ltd., New Delhi  1992-1994 Process Engineer Mascot Tools and Forgings Pvt. Ltd., New Delhi 3 Previous Appointments
  • 4.
     Research Fellowshipat the University of Auckland, New Zealand  Best Paper award at 5th ASME/IEEE International conference on Mechatronics and Embedded Systems and Applications (MESA) 2009  International Doctoral Scholarship Award (University of Auckland, New Zealand)  First position in M.Tech. at I.I.T., Roorkee, India  Gold Medal in under graduation 4 Distinctions/Awards:
  • 5.
    SCHOOL OF ENGINEERING Sensors and Actuators Pr.Nazim Mir-Nasiri & Pr. Prashant Jamwal
  • 6.
    Module Outline 2014-2015 ModuleCode: BENG 215 School: Engineering Title: Sensors and Actuators Weighting: 6 ECTS (3 credits) Coordinators: Nazim Mir-Nasiri, Year of Study: 2 Prashant Jamwal Pass mark: Total of 40% Aims: The aims of the module are  Develop thorough understanding of fundamentals and underlying principles of Sensors and Actuation Systems  Familiarize and introduce students to a quite comprehensive and span of wide range of topics commonly encountered in studying and practicing of Sensors and Actuators  Develop generic skills and abilities that are required for practicing engineer to perform the professional duties.
  • 7.
    Learning Outcomes: At the completionof the module, students will be able to  Gain confidence and understandings of terminology and functionality of various types of sensors  Comprehend the application and operation of contact and non-contact sensors  Describe and design the essential signal conditioning systems for sensors and actuators to interface with microcontroller  Describe and comprehend the application of various electrical and mechanical actuation systems Synopsis:  Sensors: Introduction and sensor performance terminology; Distance, Movement, Proximity, Strain and stress, Force, Fluid flow/level/pressure, Light and Temperature sensors; Selection of Sensors;  Signal conditioning: Signal conditioning processes; Analog signal conditioning - passive circuits (divider, bridges, filters), active circuits (OP Amp); Digital signal conditioning (Sampling and Quantization, ADC, DAC, Frequency-based converters, Data- Acquisition Systems;  Electrical Actuation systems: Relays, Solid state switches, Solenoids, DC motors, AC motors, Stepper motors;  Mechanical Actuation systems: Types of motion, Kinematic chains, Cams, Ratchets and pawl, Gear trains, Belt and chain drives, Bearings, Mechanical aspects of motor selection
  • 8.
    Textbooks:  “Mechatronics.Electronic control systems in mechanical and electrical engineering” by W. Bolton. Pearson. Prentice Hall, 5th edition, 2012 Contact Time: 4 hours per week of lectures and tutorials. Coursework :  Lab/projects - Passing mark is 40%  Homework - Passing mark is 40% Examinatio n: Final examination (3 hours) - Passing mark is 40% Breakdown:  Lab/projects -20%  Homework -30 %  Final Examination -50 % Total -100%
  • 9.
    Sensors and Transducers (definition) Pr.Nazim Mir-Nasiri & Pr. Prashant •Sensors are used for an element which produces a signal relating the quantity being measured (example, temperature sensor transforms an input temperature into a change in resistance) •Transducers are defined as elements that when subject to some physical change experience a related change •Sensors are also transducers sometimes.
  • 10.
  • 11.
    Sensors performance terminology andspecifications Pr. Nazim Mir-Nasiri & Pr. Prashant 1. Range and span Range defines the limits between which the input can vary Span is the maximum value of the input minus the minimum value. Example, a load cell for the measurement of forces might have a range of 0 to 50 kN and span of 50 kN 2. Error is the difference between the results of the measurement and the true value of the quantity being measured Error= measured value – true value Example, if the measured temperature is 25C when the actual is 24, then the error is +1C. Instead if the measured value was 26, then the error should be -1
  • 12.
    Sensors performance terminology andspecifications Pr. Nazim Mir-Nasiri & Pr. Prashant 3. Accuracy is the extent to which the value indicated by a measurement system might be wrong. In other words, it is the summation of all the possible errors that are likely to occur Example, the temperature – measuring instrument may be specified as having an accuracy of  2C of the true value . It means that the reading given by the instrument can be expected to lie within + or – 2C of the true value Accuracy is often expressed as a percentage of the full range output or full-scale deflection Example, the reading may be specified as having an accuracy of  5% of full range output. Then if the range of the sensor is 0 to 200 the reading given can be expected to be within + or – 10C of the true reading
  • 13.
    Sensors performance terminology andspecifications Pr. Nazim Mir-Nasiri & Pr. Prashant Jamwal 4.Sensitivity is relationship indicating how much output you get per unit of input, i.e. input/output relationships. Example, a resistance thermometer may have a sensitivity of 0.5 /C. The higher sensitivity is the better quality of it. . This term is also frequently used to indicate the sensitivity to inputs other than being measured, i.e. environmental changes such environmental temperature or fluctuation the in the mains voltage supply. Example, the pressure transducer may have a temperature sensitivity of 0.1 % of the reading per C change in temperature.
  • 14.
    Sensors performance terminology andspecifications 5. Hysteresis error is due to the fact that transducers can give different outputs from the same value of quantity being measured according to whether that value has been reached by a continuously increasing or decreasing change . It is the maximum difference in output for increasing and decreasing values
  • 15.
    Sensors performance terminology andspecifications 6. Non-linearity error is due to the fact that most of the transducers have nonlinear relationships between the output and input. However, a linear relationship is assumed in many cases. The error is defined as the maximum difference from the linear behavior. Various methods are used for the numerical expression of the non-linearity error . The error is generally quoted as a percentage of the full range output. Example, 0.5 % of the full range.
  • 16.
    Sensors performance terminology andspecifications 6. Non-linearity error a. The error is defined as the difference between the curve and the straight line joining the output values at the end points of the range
  • 17.
    Sensors performance terminology andspecifications 6. Non-linearity error b. The error is defined as the difference between the curve and the straight line drawn by using the method of least squares that defines the best fit line when all data values are considered equally likely to be in error.
  • 18.
    Sensors performance terminology andspecifications 6. Non-linearity error c. The error is defined as the difference between the curve and the straight line drawn by using the method of least squares that defines the best fit line which passes through the zero point.
  • 19.
    Sensors performance terminology andspecifications 7. Repeatability/reproducibility of a transducer are used to describe its ability to give the same output for repeated application of the same input value. It is usually expressed as a percentage of the full output. Repeatability =
  • 20.
    Sensors performance terminology andspecifications 8. Stability of a transducer is its ability to give the same output when used to measure a constant input over a period of time. The term drift is often used to describe the change in output that occurs over time. Can be expressed as a percentage of the full range output. The term zero drift is used for the change that occur in the output when there is zero input.
  • 21.
    Sensors performance terminology andspecifications 8. Dead band/time of a transducer is the range of input values for which there is no output. Example, bearing friction in a flow meter using a rotor might mean that there is no output until the input has reached a particular velocity threshold . The dead time is the length of time from the application of an input until the output begins to respond and change.
  • 22.
    Sensors performance terminology andspecifications 8. Resolution. When the input varies continuously over the range, the output signals for some sensors may change in small steps. The resolution is the smallest change in the input value that will produce an observable change in the output Example, in wire-wound potentiometer the output going up in steps as the potentiometer slides mover from one wire turn to the next. The resolution of it can be specified, say, 0.5 or percentage of the full-scale deflection. For a sensor giving a digital output the smallest change in output is 1 bit. The higher number of bits the better is the resolution, i.e. it is smaller. The sensor with data word of N bits digital or a total of 2N decimal, the resolution is 1/ 2N
  • 23.
    Sensors performance terminology andspecifications 8. Output impedance (loading effects) When a sensor giving an electrical output is interfaced with an electronic circuits it is necessary to know the output impedance since this impedance is being connected in either series or parallel with that circuit. The inclusion of the sensor can significantly modify the behavior of the system to which it is connected.
  • 24.
    Sensors performance terminology andspecifications Example of the specification of a strain gauge pressure sensor
  • 25.
    Static and DynamicCharacteristics of Sensors •The static characteristics are the values given when steady- state conditions occur, i.e. the values given when the transducer has settled after having received some input • The dynamic characteristics refer to the behavior (or system response) between the time that the input value changes and the time when the output settles down to the steady-state value Example, the input might be a step input when the input is suddenly changed from 0 to a constant value, or a ramp input when the input is changed at a steady rate, or a sinusoidal input of a specified frequency
  • 26.
    Static and DynamicCharacteristics of Sensors •Response time is the time which elapses after a constant step input is applied to the transducer up to the point at which the transducer gives an output corresponding to some percentage, e.g. 95% of the input . Example, mercury-in-glass thermometer is put into a hot liquid there can be as much as 100 s elapsed before the thermometer indicates 95% of the actual temperature of the liquid. •
  • 27.
    Static and DynamicCharacteristics of Sensors •Time constant is the 63.2% response time. It is a measure of the inertia of sensor and so how fast it will react to changes in its input. The bigger the time constant the slower will be its reaction to a changing input • Rise time is the time taken for the output to rise to some specified percentage of the steady-state output, for example from 10% to 90% of the steady- state
  • 28.
    Static and DynamicCharacteristics of Sensors •Settling time is the time taken for the output to settle to within some percentage, e.g. 2% of the steady-state value Example. Consider the following data which indicates how an instrument reading changed with time, being obtained from a thermometer plunged into a liquid at time t=0 s. The 95% response time is required
  • 29.
    Static and DynamicCharacteristics of Sensors Example. Fig. shows the graph of how the temperature indicated by the thermometer varies with time. The steady-state value is 55C and so, since 95% of 55 is 52.25, the 95% repose time is about 228 s.
  • 30.