
Recommended
Recommended
More Related Content
Similar to Debate topic Should prisoners be allowed to access the internet .docx
Similar to Debate topic Should prisoners be allowed to access the internet .docx (20)
More from simonithomas47935
More from simonithomas47935 (20)
Recently uploaded
Recently uploaded (20)
Debate topic Should prisoners be allowed to access the internet .docx
- 1. Debate topic: Should prisoners be allowed to access the internet? Position of debate: Yes, they should. Write 5 points that could support the position. List those 5 points and expand them in detail. Around one and half page in total. Private label brands in an emerging economy: an exploratory study in India Siddhartha Sarkar, Dinesh Sharma and Arti D. Kalro Shailesh J. Mehta School of Management, Indian Institute of Technology Bombay, Mumbai, India Abstract Purpose – The purpose of this paper is to present different naming, packaging, and pricing strategies adopted by private label (PL) retailers in India. This study also aims to identify preferred private label brand (PLB) categories, factors influencing their selection, and the importance of cues in evaluation of PLBs. The overall purpose is to identify important areas for future research of PLBs in the wake of organized retail growth in an emerging economy (India is the context here). Design/methodology/approach – This study is based on in-store observations of major Indian retail chains, longitudinal analyses of customers’ shopping bills, qualitative analyses of consumer
- 2. interviews, and focus group discussions. Findings – The results indicate that retailers primarily adopt “Sub-branding” (using the store name along with a separate brand name) and “House of Brands” (using a separate brand name only) strategies to sell PLBs in the Indian market. Groceries, food and beverages, and apparel are the preferred categories in PLB. Price, quality, and convenience are the major factors influencing PLB. Taste, ingredients, packaging, price, brand name, and store name are the main factors that are used to evaluate PLBs. Research limitations/implications – Due to the qualitative analyses and interpretation, there are limitations to this study which need to be empirically validated. Practical implications – This research has implications for organized retailers in understanding the various strategies used for PLBs in India. Originality/value – This study is a novel study for documenting the PLB strategies adopted by organized retailers in India. It also uses a longitudinal exploratory approach to further understanding the consumption of PLBs in India. Keywords Private label brands, Longitudinal study, Extrinsic cues, Brand naming strategies, Intrinsic cues, Packaging strategies Paper type Research paper Introduction Private label brands (PLBs), also referred to as “store brands”, are brands owned by a retailer or wholesaler (Hyman et al., 2010). With margins as high as 20 per cent in the fast moving consumer goods category and 40 per cent in apparel, PLBs play a dominant role in several European markets as well as Canada
- 3. (Nielson’s Report, 2014). Over the last decade, the growth of PLBs in India has coincided with the growth of modern retail stores. Organized retail in India is undergoing a remarkable transformation from traditional methods to modern stores. Currently, organized retail in India represents 10 per cent of the total retail market, which is projected to reach US$ 180 billion by 2020 (BCG Retail Report, 2015). Private label’s (PL) share of modern retail in India accounts for about 7 per cent of the total retail market and is International Journal of Retail &Distribution Management Vol. 44 No. 2, 2016 pp. 203-222 © Emerald Group Publishing Limited 0959-0552 DOI 10.1108/IJRDM-07-2015-0102 Received 22 July 2015 Revised 6 September 2015 29 October 2015 30 October 2015 Accepted 8 December 2015 The current issue and full text archive of this journal is available on Emerald Insight at: www.emeraldinsight.com/0959-0552.htm The authors would like to thank Professor Gajendra K. Adil,
- 4. Professor Puja Padhi, Professor Shishir K. Jha, and Professor Ashish Singh for their inputs on the initial drafts of this manuscript. 203 PLBs in an emerging economy growing annually. It is expected that India’s e-commerce market will also grow rapidly, and PLB retailers see potential in the online space (Anand, 2015). PLBs have been widely discussed and documented in both practitioner and academic-oriented studies (Richardson et al., 1996; Batra and Sinha, 2000; Sprott and Shimp, 2004; Sethuraman and Gielens, 2014). Existing PLB literature can be broadly classified as consumer, retailer, market, and manufacturer focused (Hyman et al., 2010). An extensive review of the literature highlights a gap in the research between PLB naming/architecture, packaging, pricing, and brand imitation strategies being pursued by retailers (Hyman et al., 2010). While PLB as a concept has been studied in developed economies (particularly in the UK, major parts of Europe, and the USA), this is not the case in emerging economies such as India (Saraswat et al., 2010; Diallo, 2012). Previous studies in the Indian PLB context have primarily examined
- 5. consumer-related factors, such as demographics and psychographics, that influence consumers’ intent to purchase PLBs (Abhishek, 2014; Mishra, 2014). Only one study (Saraswat et al., 2010) has considered retailer-related factors, such as store image. None of the previous studies consider brand architecture strategies that have been adopted by the Indian retailers that sell PLBs. Therefore, we aim to adopt a more comprehensive approach in understanding Indian consumer perceptions related to the consumption of PLBs. Hence, the specific objectives of this study are as follows: (1) to explore various naming, packaging, and pricing strategies adopted by major PL retailers in the emerging economy of India; (2) to identify preferred PLB categories through the use of longitudinal observational data; and (3) to understand factors that influence the purchase of PLBs and determine the importance of cues in evaluating PLBs. The overall purpose is to identify important areas for future research of PLBs in light of the growth in organized retail in the emerging economy of India. This paper is organized in line with these objectives. First, this paper discusses the background of this research, and derives research questions regarding the identification of PLB categories and the factors that influence the purchase of PLBs.
- 6. The following observational studies, interviews, and focus group discussions answer the aforementioned questions. This study concludes with a summary of findings, discussion of theoretical and managerial implications, and a direction for future studies. Background Using the concept of strategic orientation, Zielke and Dobbelstein (2007) have identified different types of PLBs. First, the classic PLBs are 10-30 per cent cheaper than leading national brands (NBs) and as such, are positioned in line with or slightly below these NBs (Nenycz-Thiel, 2011). Second, the generic PLBs, which come with necessary packaging, are positioned in the lowest price segment. Finally, the premium PLBs are positioned in the same way as successful NBs (Steenkamp et al., 2010). The literature has examined market share (Steenkamp and Geyskens, 2014), individual purchase behaviour (Batra and Sinha, 2000), perceptions, attitudes, and willingness to pay (Steenkamp et al., 2010) in determining the success of PLBs (Calvo-Porral and Lévy-Mangin, 2014). The success of PLBs depends on addressing the expectations of consumers and manufacturers, who are also targeted by the NBs (Hyman et al., 2010). For instance, 204
- 7. IJRDM 44,2 given the negligible advertising costs, the margins for manufacturers of PLBs may be higher than those for manufacturers of NBs (Richardson et al., 1996). As the propensity of customer preferences to buy less expensive products increases, the market share of PLBs is also expected to increase over time. High-quality PLBs help retailers build a strong store image (Saraswat et al., 2010; Kremer and Viot, 2012), strengthen relationships with consumers, and enhance store loyalty (Koschate-Fischer et al., 2014). The Indian retail industry, currently valued at US$600 billion (BCG Retail Report, 2015), is expected to reach US$ 1 trillion by 2020. The industry can be broadly classified into organized/modern trade (10-11 per cent) and unorganized/traditional retail (89-90 per cent). Overall, the Indian retail sector is anticipated to grow at 10 per cent per year; modern retail is expected to grow twice as fast at 20 per cent (BCG Retail Report, 2015). Due to the growing youth segment, rising incomes, and urbanization, the purchasing patterns, preferences, and brand consciousness of the Indian consumer has changed (KPMG Report, 2014). This has created a great opportunity for modern retailers in India to invest in PLBs.
- 8. As mentioned in Kotler et al. (2005), an effective marketing strategy combines the four Ps of the marketing mix, which is a set of controllable, tactical marketing tools that a company uses to produce a desired response from its target market. Furthermore, the literature shows that packaging, naming, and pricing are critical aspects of branding (Beneke et al., 2013). To take advantage of the positive association that consumers have with NBs, PLB retailers generally imitate the design characteristics, brand names, logos, label designs, product attributes, and packaging of leading NBs in their particular category (Aribarg et al., 2014). Over time, in the process of reducing the gap between PLBs and NBs in terms of price and quality, PLB retailers have repositioned their products and attempted to create positive effects on consumer perceptions towards PLBs (Zielke and Dobbelstein, 2007; Delgado-Ballester et al., 2014). Brand naming is an important part of the brand architecture strategy (Aaker and Joachimsthaler, 2000). The literature broadly classifies naming strategies as naming a PLB with the umbrella store brand (Branded House), using both the store name and a separate brand name for the product (Sub-brands), or selling different PLBs as separate stand-alone brands (House of Brands) (Muzellec and Lambkin, 2009). While there is considerable literature regarding the branding strategies of NBs, there are few studies dedicated to the branding strategies of PLBs, particularly in emerging
- 9. economies. Based on this gap, we formulate our first research question: RQ1. What are the various strategies (naming, packaging, and pricing) adopted by PL retailers for PLBs in India? The propensity of consumers to purchase PLBs depends on demographic factors such as gender, age, and income (Mishra, 2014), psychographic factors such as perceived risk, perceived value for money, perceived quality variations, purchasing experience (Abhishek, 2014), cues, perceptions, and knowledge of the category (Richardson et al., 1996). Sayman and Raju (2004) argue that there is a significant impact on the sales of PLBs and NBs in a particular product category (González- Benito and Martos-Partal, 2012), when a greater number of PLBs are available in retail stores. Previous authors frequently refer to the share-of-category spending as a measure of customer loyalty for low-involvement shopping (e.g. groceries and food and beverages), where customers may select multiple brands within a category (Koschate-Fischer et al., 2014). When consumers are more familiar with a particular product category, there is greater purchase frequency, which may be observed in PLB grocery category (Richardson et al., 1994). 205 PLBs in an emerging
- 10. economy Products contain an array of cues that serve as quality indicators (Collins-Dodd and Lindley, 2003), which may be classified into intrinsic and extrinsic cues. Extrinsic cues are related to the product, such as brand name, store name, packaging, and price. Richardson et al. (1994) found that extrinsic cues play a more significant role in making judgments and perceptions of product quality vis-à-vis intrinsic cues. Brand imitation is a successful marketing strategy based on the utilization of similar cues (package, design, and brand name) to enhance the acceptance of a brand by consumers. Imitation strategy, commonly used by PLBs, may make the consumers perceive a PLB as a NB, or as a PLB of similar quality as that of a NB. To target potential customers’ needs, an imitation strategy may incorporate innovative packaging techniques and product attributes to make it look like a NB (Fitzell, 1992). In grocery shopping, the lower the involvement, the more likely consumers will identify PLBs as NBs (Loken et al., 1986). PLB retailers follow the leading NB’s packaging (Aribarg et al., 2014) to imitate a NB’s quality, which has a significant impact on brand attitude and purchase intention (Zaichkowsky, 1995). While we aim to understand the various branding strategies of PLB retailers, we also want to understand how Indian PLB consumers perceive
- 11. these strategies. More specifically, we want to discover how these perceptions influence PLB category preferences, PLB purchase intentions, and cues that consumers evaluate before purchasing PLBs. The following three research questions (RQ2, RQ3, and RQ4) focus on these aspects of Indian PLB consumer behaviour: RQ2. Which are the preferred PLB categories among Indian consumers? Literature on PLB indicates that attributes of low price, packaging similarity, and perceived quality similarity affect consumer preferences (Beneke et al., 2013). Packaging similarity is considered an important cue for PLB quality judgments (Aribarg et al., 2014), as consumers rely on symbols, shapes, colour, and Gestalt (Tversky, 2004). Packaging imitation can evoke feelings of familiarity, which can improve PLB quality assessments. Brand imitation enhances the resemblance in physical appearance of the imitated and imitating brands (Sinapuelas and Robinson, 2012). This increased similarity factors into how consumers observe and categorize brands in a product category, and can change consideration and preference for different brands. Consumers may apply schema based on similarities and in low-involvement purchase situations, a PLB that looks like a NB may be perceived as a NB. The results of empirical testing show that packaging is associated with
- 12. perceived quality (Sprott and Shimp, 2004). While some PLBs, commonly imitate the packaging of leading brands, others adopt different packaging designs from NBs. A range of acceptable similarity stimulates recognition and evaluation of perceived quality. Beyond this range, a consumer views PLBs as copycat brands. Price, as an inference of quality, has been widely studied (Rao and Monroe, 1989; Steenkamp et al., 2010), and price-perceived quality schema constructs has been directly tested. Price similarity of PLBs with NBs indicates high quality, and high-price dissimilarity indicates poor quality (Collins-Dodd and Lindley, 2003). A wider price gap between a PLB and a NB (Gielens, 2012) can adversely affect the perception of the PLB. Additionally, the low-price approach is not a way to achieve consumer loyalty. Rao and Monroe (1989) observe that brand name information dominates price information in the perception of quality. Brand name is a critical cue of a consumer’s perception of product quality (Perloff et al., 2012), while store name has a very small impact (Richardson et al., 1994) in signalling product quality. Brand name carries a very specific signal as it is shared among few products within a competitive product line. 206 IJRDM 44,2
- 13. Perceived quality is an essential aspect in the selection and consumption of PLBs (Beneke et al., 2013). Consumption of PLBs is often higher when all brands in a specific category are seen as being of similar quality (Sprott and Shimp, 2004; Olson, 2012). Higher risk perception is associated with PLBs compared to NBs, and has a significant negative effect on purchase intention; this observation varies by product category (Zielke and Dobbelstein, 2007; Beneke et al., 2013). For PLB groceries, consumers are less motivated to purchase when the level of perceived risk in that category is high (González-Benito and Martos-Partal, 2012). PLB’s performance in the marketplace depends on different variables, and there is no dearth of PLB literature on understanding consumer preferences. Batra and Sinha (2000) examine various factors that explain differences in the selection of NBs vs PLBs across different categories (Glynn and Chen, 2009). Along with consumer factors (personality, perception, and socioeconomic) (Hyman et al., 2010), store image perceptions (Diallo et al., 2013) and PLB price-image significantly influence PLB purchase intention in emerging economies (Diallo, 2012). Because Indian PLBs are less familiar in the marketplace, it is rational to expect that there will be factors that influence the PLB purchase decision other than retail store image (Saraswat et al., 2010).
- 14. The above discussion on packaging, price, brand name, and perceived quality helps us formulate the third research question: RQ3. What are the main factors that influence the selection of PLBs by Indian consumers? Consumers use a lot of information and respond to many types of cues when forming impressions and judgments about brands. For academicians and marketers, it is very important to identify the procedures involved in the formation of quality impressions, and the relative importance of factors or cues that influence consumers’ judgments of quality (Olsen et al., 2011). Richardson et al. (1994) examines the relative importance of extrinsic and intrinsic cues in determining perceptions of PLB quality (Gielens, 2012) and finds that those shoppers who judge products by brand, price, or packaging are less likely to purchase PLBs. Initial research on PLBs attempts to identify and categorize the demographic variables of PLB consumers. Larger families are inclined to purchase more PLBs; however, the research is not significant in predicting the consumption of PLBs (Richardson et al., 1996). Given the large number of choices on the shelf, consumers are becoming more selective when making purchasing decisions. All of the above-mentioned studies have been conducted in developed economies (Sprott and Shimp, 2004; Sethuraman and Gielens, 2014); however, the context is not the same
- 15. as that in emerging economies. This discussion of cue utilization results in the final research question: RQ4. What are the important cues that consumers consider when evaluating PLBs? These questions are answered by conducting an observational study through in-store visits in major retail chains, a longitudinal study of customers’ shopping bills, in-depth interviews, and three focus group discussions with consumers. Research methodology Exploratory studies This research is an exploratory study, and the initial part of the study is based on in-store observations and store managers’ interviews regarding the PLB strategies of nine major modern retail chains in India. In the second part, using purposive sampling, longitudinal 207 PLBs in an emerging economy data concerning consumers’ shopping details is collected from households. While a longitudinal study is a powerful methodology (Pepe, 2012), not many studies have used this technique to examine PLBs. Within this study, the authors conduct semi-
- 16. structured in-depth interviews in an attempt to understand the factors that influence Indian consumers’ decisions to purchase PLBs. Three focus group discussions are conducted to identify the critical intrinsic and extrinsic cues that influence the choice to purchase PLBs. Data collection: observations, interviews, and focus group discussions To understand the overall scenario of PLB strategies adopted by major retail chains in India, in-store observations (following the procedure of Nenycz-Thiel, 2011; Hultman et al., 2008) are conducted at nine major retail chains in a metropolitan city during the last quarter of 2013 and the first quarter of 2014. These nine retail chains (refer Table I) represent the organized retail industry in India and offer a number of PLBs across categories. In Study 1, we collect the information about the range of PLB offerings in different categories from each retail store. Study 2 is conducted in three phases. In the initial phase, a longitudinal study is used (following the procedure of Pepe, 2012 and Herstein et al., 2012) to examine the preferred PLB categories and approximate percentage spend on PLBs by households in an Indian metropolitan city. Initially 110 households (across different parts of the city) are asked to participate in this study. Of these, 87 households agree to participate. Instructions to retain shopping bills for future reference are given to the households.
- 17. This study monitors every household for a period of six months and the shopping bills from these households are collected on a regular basis. A similar procedure is followed for each of the 87 households. Following this phase, semi-structured interviews (Sloot and Verhoef, 2008) are conducted to understand the different factors that influence the selection of PLBs. A purposive sampling technique is used to select 22 families for in-depth interviews. Following the procedure of Shannon and Mandhachitara (2005), the family member involved in the actual shopping of household goods participates in a detailed interview. These individuals participate actively in general household shopping on a regular basis. With prior permission from the respondents, a series of interviews are conducted, recorded in an audio format, and transcribed for additional analysis. On average, each Retailer Revenue Store format No. of outlets Geographical coverage Retailer A INR 110 billion Hypermarket, supermarket W250 Metro, urban, semi-urban Retailer B INR 160 billion Hypermarket, supermarket, convenience, wholesale cash and carry W1,600 Metro, urban, semi-urban Retailer C INR 7.16 billion Hypermarket 18 Metro, urban
- 18. Retailer D INR 10.3 billion Hypermarket, supermarket 483 Metro, urban, semi-urban Retailer E INR 35 billion Hypermarket, supermarket 90 Metro, urban Retailer F INR 1 (–) billion Hypermarket 17 Metro, urban Retailer G INR 3.2 (–) billion Hypermarket, supermarket 215 Metro, urban, semi-urban Retailer H INR 39.4 billion Department store 67 Metro, urban Retailer I INR 1.7 billion Premium gourmet store 32 Metro, urban Note: All of the information in Table I has been compiled from respective retail websites by the authors. Retailers’ names have been changed to pseudonyms Table I. Characteristics of the nine major retail chains in India 208 IJRDM 44,2 interview is 20-25 minutes long. Further questions are asked to understand individual and household shopping behaviour in addition to the important factors that the subjects consider when selecting PLBs and NBs. Subsequently, the third phase of the observation study (Hultman et al., 2008) is conducted to understand and validate the preferred PLB categories emerging from the
- 19. first phase of Study 2. Following a procedure similar to the one in the first phase, shopping bills are collected from the interviewees. In total, 18 out of 22 households are selected for an additional interview. The authors requested that the selected households to retain their shopping bills. The observation method is used to monitor every household for a period of one month. Figure 1 summarizes the methodology used in Study 2. In Study 3, focus group discussions with different groups (both men and women) are conducted. Based on the themes from the existing literature, focus group discussions (following the procedures in Pavia and Costa, 1993) are held to identify the product and non-product related attributes of PLBs. The focus group discussions are initiated by showing three product categories to the participants. PLBs from a popular retail chain in three product categories – wafer biscuits, corn flakes, and savoury snacks – are presented to the participants of the focus group. Two criteria are used to guide product selection: first, the product represents the dominant and popular brand in the sample market and second, the product is such that it requires no cooking and is ready for direct consumption. The choice of selection of this category that emerges from Study 2 has been discussed in detail in the subsequent section titled “Findings”. At the beginning of each focus group discussion, participants are asked to observe and
- 20. evaluate the PLBs carefully (following the procedures of Dick et al., 1996). Later, they taste the different brands, which leads to further discussion. Consumers taste the leading NB and the same type of variant of all of the available PLBs (e.g. “Choco Chips” cookies) in the taste test. The intention is to provide the participants a common point of discussion, wherein they can share their opinions about the different PLBs in that category. Sample characteristics For the longitudinal study, the sample (age bracket of 24-62 years) consists of middle- income modern retail active shoppers in an Indian city with a population of over eight million. All of the respondents are graduates, 76 per cent are post graduates, and 31 per cent of the respondents are female. Age and income distribution of the respondents is reasonably consistent throughout the sample, though slightly skewed in favour of those respondents who are older (average 37 years) and have higher incomes (average income of INR 51,000 per month). For the focus group discussions, the participants are divided into three groups consisting of 9-10 members. Each group is comprised of both men and women, which Phase I: Observation To study the purchase pattern 87 families were selected Purposive sample
- 21. Six months data of actual bills Every shopping detail was monitored, captured and then analyzed Phase II: Interview To study factors influencing purchase of PLBs 22 families were selected Purposive sample 20-25 minutes average interviews Recorded in audio format and transcribed for further analysis Phase III: Observation To validate Phase I findings 18 families were shortlisted Purposive sample One month bills data Every detail was monitored and captured for further analysis Figure 1. Methodology for study 2 209 PLBs in an emerging economy provides gender-based heterogeneity, stimulates discussion, and
- 22. represents divergent perspectives within this critical dimension. These participants are active shoppers ranging in age from 27-43 years (mean ¼ 29.6 years). Findings The details of naming, packaging, pricing, and promotion strategies of nine major Indian retail chains are outlined in Table II. Naming strategies Based on in-store observations of the nine major retail chains, we observe that PLB retailers use three types of naming/brand architecture strategies for their brands: “Branded House” (only retailer name used), “House of Brands” (only separate brand name used), and “Sub-branding” (combined name). Of the nine major retail chains, five follow predominantly “Sub-branding” strategies (Retailer B, Retailer C, Retailer D, Retailer F, and Retailer G), and four retailers follow the “House of Brands” strategy (Retailer A, Retailer E, Retailer H, and Retailer I). Few retailers use a separate identity (e.g. Tasty Treat) by creating a brand name using packaging akin to those of NBs in various categories, and by pricing some products similar to NBs and some lower than NBs. Interestingly, not a single retailer follows the Branded House strategy of using only the retailer’s name. Retailers such as Retailer C and Retailer B prefer to leverage store equity and use a “combined naming strategy”, wherein they combine generic words such as “Choice”, “Select”, “Premium”, “Value”, and others with their store
- 23. names (e.g. Retailer B Select, Retailer C Saver) across different categories. Pricing strategies Some retailers have adopted “price similarity with NBs” strategies (e.g. Retailer D and Retailer H) to market their PLBs vis-à-vis “price dissimilarity with NBs” (e.g. Retailer A and Retailer E) across categories. Retailers often use promotions involving price discounts to enhance store footfall and increase sales. Between the first and second tier of PLBs and NBs, there is a price difference of 10-35 per cent. Some PLBs in the premium tier are not essentially cheaper substitutes when compared to average NB prices. Retailer H’s premium range is priced equal to or higher than the NBs in both the apparel and accessories segments. In the grocery category, Retailer A, Retailer C, and Retailer G’s premiums are, on average, 10 per cent below NB prices. Packaging strategies This study indicates that few PLBs are packaged similarly to NBs to maintain the same positioning as NBs (e.g. Tasty Treat and Feasters) and most of the other PLBs maintain dissimilar packaging compared to NBs (e.g. GoodLife and Premia). Commonly used by PLBs, this packaging imitation strategy may serve to minimize R&D and advertising expenses. However, Indian PLBs predominantly utilize a non- imitation strategy (in packaging) to develop and sell their own brands across categories.
- 24. Promotion strategies Advertising by Indian PLBs is a reasonably new phenomenon. Retailer A invests in print media and TV commercials to endorse its brands in the apparel segment, while other retailers use print media to promote their PLB products across categories. In other words, Retailer A focuses on brand-centric promotional tactics (using mass media ads), while other retailers use store-centric promotions. 210 IJRDM 44,2 P ri va te la be ls ’ br an d na m in g
- 59. strategies adopted for private label brands 211 PLBs in an emerging economy P ri va te la be ls ’ br an d na m in g st ra te gi es
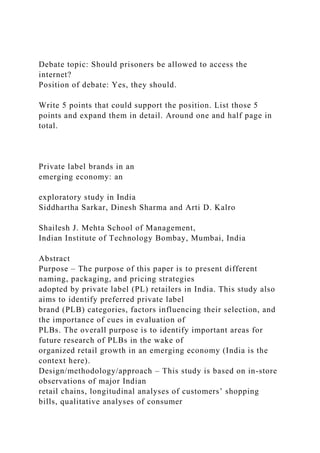
- 94. G Table II. 212 IJRDM 44,2 To answer the second research question, shopping bills are classified into seven different categories. Percentages and total expenses are computed for both the PLBs and other brands in each category. The basic purpose is to discover the preferred PLB categories vis-à-vis other brands (NBs, regional brands, and staple items). Hence, an individual analysis of different types of brands is not part of this study. From the summary of the category-wise analysis (refer to Figure 2[1]), we observe that PLBs are most widely purchased in the grocery, food and beverage, and apparel categories. The longitudinal shopping data are analysed using standard ANOVA procedures. Table III presents the results of the overall ANOVA for spend on PLBs and other brands. Significant main and interaction effects are found for brands in each product category. The main effect of brands indicates that households spend different amounts on PLBs when compared to other brands (F1,3612 ¼
- 95. 288.803, po0.05, mean PLBs ¼ 17.18, mean other brands ¼ 109.67). As expected, the main effect of category is significant (F6,3612 ¼ 34.434, po0.05), suggesting that respondents spend differently across the seven categories. The interaction effect of brand and category is found to be highly significant and suggests that consumers spend differently for PLBs and other brands across the seven categories (F6,3612 ¼ 13.145, po0.05). Only longitudinal data across categories of PLB shopping is analysed, and the results indicate that the household expenditure differs among the seven categories (F6,1820 ¼ 27.223, po0.05). In other words, the spending tendency on PLBs in the grocery segment is different from that in either the food and beverage or other segments. The PLB grocery category is significantly different from all of the other PLB categories (F1,1826 ¼ 98.578, po0.05, mean grocery ¼ 59.73). 460.87 30% 283.53 18% 356.07 23% 97.63 6% 166.10 11%
- 97. 600 G F&B A&A L&C V&D C&PC CD A m o u n t in t h o u sa n d s (I N R ) Categories Less than 1%
- 98. Others PLB (1%) (3%) Figure 2. Amount and percentage of spending across categories by sample households Source Sum of Sq. df Mean Sq. F Sig. Brands 7,814,025.517 1 7,814,025.517 288.803 0.000 Category 5,590,015.246 6 931,669.208 34.434 0.000 Brands category* 2,133,930.694 6 355,655.116 13.145 0.000 Error 97,728,391.623 3,612 27,056.587 Total 128,619,349.490 3,654 Note: *po0.05 Table III. ANOVA results 213 PLBs in an emerging economy
- 99. A series of semi-structured interviews is conducted with the objective of exploring different factors that influence the selection of PLBs. “Contrasted with survey interviewing, the qualitative interview is based on a set of topics to be discussed in-depth rather than based on the use of standardized questions” (Babbie, 2014, p. 318). Hence, the authors do not measure any one dimension, instead, they discuss various dimensions emerging from the FGDs. The data from the interviews is arranged and categorized into different themes (refer Table IV). Price is the most important parameter for a majority of the interviewees, which corroborates with previous studies. Respondents consider quality judgment as the second essential factor for PLB product evaluation. Convenience (perceived degree of avoidance of time and effort) is considered to be the third essential criterion. Interestingly, store location emerges as yet another important factor in the selection of retail stores and their brands. As stated in the previous literature, different promotional schemes, offers, and loyalty programmes are also important to Indian consumers ( Joseph and Sivakumaran, 2011). Previous studies have not focused on the convenience factor and interestingly, Indian consumers consider this an important factor in the purchase of PLBs. Product availability and product packaging also seem to play a meaningful role for some households. In the case of PL groceries, the level of involvement is generally low and for apparel, it is relatively
- 100. high. Selection of PLBs in the apparel category is driven primarily by design, store name, store image, and consumer income. Some other relevant factors are consistency, freshness, store ambience, and store reputation. Consumers tend to use a variety of intrinsic and extrinsic cues concurrently to evaluate product quality. Intrinsic cues are derived directly from the physical composition of a product and extrinsic cues are peripherally related to product. Family No. of stores visited in a month Key factors 1 3 Quality, available, price, convenience, location 2 4 Quality, price 3 1 Price, offer, discount 4 3 Price, quality 5 2 Quality, price 6 2 Price, convenience, low involvement, quality 7 3 Price, substitutes, quality 8 3 Quality, consistency, price 9 3 Value for money, quality, availability, discounts, loyalty points 10 3 Quality, price 11 2 Offer, discounts 12 4 Quality, convenience 13 3 Quality, availability, price, location, bulk purchase 14 1 Price, offers 15 3 Packaging, quality, low involvement 16 4 Schemes, get one free, special offers
- 101. 17 3 Price, attractive product, gift 18 4 Price, quality, convenience 19 3 Quality, price, try a new product 20 4 Price, quality, location, convenience 21 4 Convenience, location, price 22 2 Location, price, freshness Table IV. Summary of key influencing factors 214 IJRDM 44,2 To understand the use of these multiple variables, we use the food and beverage PLB category, a preferred category, for further study. With regard to the final objective of this research, participants are asked to examine and evaluate the extrinsic and intrinsic cues of three PLBs across three categories: Tasty Treat wafers (choco flavour), Tasty Treat snacks, and Tasty Treat corn flakes (choco flavour). Some of the words frequently used by the focus group participants to evaluate and describe PLBs are: flavour, taste, ingredients, variants, colour, texture, shape, crunchiness, freshness, weight, size, thickness, company name, store name, store image, packaging, character, information, logo, brand name, brand experience, price,
- 102. promotion, discounts, offers, advertisement, and reputation. While there are contradictions in this list, we notice several common themes. All of the above-mentioned cues can be further classified into intrinsic cues, or product-related attributes, and extrinsic cues, or non-product related attributes. Many participants assert that the primary intrinsic cue is taste. Though many participants did not like the taste of the three PLBs, they mention the importance of product taste for repeat purchases. Thus, the consumer has the ability to identify products and specific brands on the basis of taste and aroma (Breneiser and Allen, 2011). Indian PLBs are judged inferior to NBs on a variety of product characteristics including the taste of the product. Independently, in each focus group, participants agree that taste may be compromised for trial purchase or by a first time buyer. However, for repeat purchases, favourable/standard taste was critical in the selection of PLBs: (FG No. 1) F[2]: Being a loyal customer of another brand, the taste is not good. It tastes very bad. When you have it and you feel that it’s not chocolaty. It does not taste like chocolate at all and more of cocoa that way. In addition to taste, another important characteristic of PLBs is product ingredients. In the focus group taste test, the actual product ingredients are deemed to be of lower quality than those of the NBs. Unfavourable evaluations of PLB ingredients are made
- 103. not only on the basis of extrinsic cues, but to some extent on participants’ direct responses to PLB ingredients (Richardson et al., 1994). Though there are fewer differences in the ingredients between different brands, NB ingredients are perceived to be superior to PLB ingredients. The level of creaminess, crunchiness, texture, freshness, and shape of the product are also considered by the participants: (FG No. 1) M: So as I said, normally I do not look at the entire list of ingredients. However, if I have the chance to look at it, there are a big number of artificial things that have been added. There is an endless list of artificial ingredients and this is a kind of a concern. There is often information available on packaging and consumers use these cues to infer quality attributes of PLBs. Participants discuss visible cues as well as the information from the PLB packaging, which manages to evoke preferred quality perceptions among consumers. In fact, unfavourable perceptions may be fostered by the use of inexpensive-looking packaging. Participants are less inclined to believe that PLBs with better packaging or labelling are of higher quality. The product information, characters used on the packaging, logo, colour, plastic quality, and paper used are also carefully observed. Because participants are familiar with known brands, they consider PLBs to be less attractive and poorly packaged.
- 104. Participants insist that they rely heavily upon price as an indicator of PLB quality. Promotions for NBs focus on shopping enjoyment and innovativeness, while promotions for PLBs emphasize the economic benefits for price conscious consumers. 215 PLBs in an emerging economy Price similarity with NBs indicates a high level of quality, while too large a price gap may adversely affect the perceived quality of PLBs. The discussion highlights the participants’ beliefs that if retailers concentrate on product quality as opposed to price, they can create more favourable perceptions and increase loyalty. Interestingly, a small price gap between PLBs and NBs stimulates participants to consider the known/ familiar brands for final purchase. The focus group discussions indicate that an extrinsic cue, such as brand name, is more easily recognized, integrated, and interpreted than any other cue. Participants are generally influenced by brand names and products with which they were familiar. The brand name helps control the quality perception of PLBs when products are available at a discounted price. A large number of participants believe
- 105. that brand name has a greater effect than store name on quality evaluation. When PLBs include the store name or logo of the brand on the package, this is viewed as an extension of the brand name of the store itself. Retail reputation and store name cues are used by the participants interchangeably to describe product quality and store image. Participants suggest that individual retailers need to invest more to promote their store name and develop a strong store image. Finally, brand experience and prior knowledge of the product category are important factors for both quality evaluation and purchase intent. A negative store experience invariably leads to a bad reputation, which affects overall store image and eventually, individual product evaluation. The focus group discussions validate the findings that extrinsic cues (like packaging, price, and name) influence purchase intention and trial. However, for repeat purchases, taste and ingredients play an important role. The preceding discussion of the assertions emerging in all three independent focus groups provides several broad generalizations of intrinsic and extrinsic cues, which form the basis for further research. These findings and relative ranks of PLB cues are summarized in Table V. Discussion and conclusion Retailers across countries use varied naming strategies for their PLBs. Several retailers prefer their own “store name” for their products (for instance,
- 106. TESCO beer), while others believe in using a separate “brand name” (Wal-Mart’s Equate) to market their PLBs. A few adopt sub-branding or a combination strategy across different product categories (e.g. Carrefour Cola Classic). However, research shows that Wal-Mart, the world’s largest retailer, primarily follows the “House of Brands” strategy (Store Brands Decisions, 2010). Indian retailers are also headed in this direction. This study indicates Focus group discussion 1 Focus group discussion 2 Focus group discussion 3 Product category Wafer biscuits Savoury snacks Corn flakes Rank Intrinsic cues Extrinsic cues Intrinsic cues Extrinsic cues Intrinsic cues Extrinsic cues 1 Taste Packaging Taste Packaging Taste Packaging 2 Ingredients Price Ingredients Store image Ingredients Brand name 3 Flavour Store image Freshness Price Texture Price 4 Texture Brand name Flavour Brand name Flavour Store image 5 Shape Store name Freshness Product
- 107. knowledge Crunchiness Brand experience Table V. Rank of intrinsic and extrinsic cues 216 IJRDM 44,2 that retailers mainly adopt sub-branding (using the store name along with a separate brand name) and “House of Brands” (using a separate brand name only) strategies to sell their PLBs in the Indian market. This study shows that popular PLBs have adopted a packaging strategy similar to that of NBs in specific categories (such as cookies, chips, and toilet cleaners) with majority of the PLBs being priced lower than the NBs. Previous literature indicates that PLBs with higher packaging similarity to the leading NBs are found to elicit significantly higher quality judgments than PLBs with lower packaging similarity (Olson, 2012). Some PLBs imitate the packaging of leading brands in low-involvement categories such as Tasty Treat and Feasters, while a few PLBs
- 108. adopt different packaging designs vis-à-vis NBs. Extant literature indicates that higher similarity enhances consumer consideration and relative preference for these PLBs (Aribarg et al., 2014). The perception of PLBs depends not only on the imitation strategies but also on the levels of brand familiarity and brand knowledge. In emerging economies where PLB is a growing concept, store reputation (store image) plays a significant role in the purchase of PLBs; discussions with various store managers confirm this observation. Grocery, apparel, and food are the most preferred PLB categories, which are relatively the same as those mentioned in Nielson’s Report (2014). The KPMG Report (2014) states that food continues to dominate the PLB market with 76 per cent of total sales; within this category, packaged groceries dominate with 53 per cent of total sales. This can be attributed to factors such as low-sourcing costs, technology and packaging, high margins, fast moving nature of the products, and low involvement (Koschate-Fischer et al., 2014). Some key factors that drive shopping behaviour towards PLBs are product quality, competitive price, offers or discounts, convenience, and store location. Competitive price primarily affects the brand choice, as many substitutes are available in the same category. Because of the limited availability of NBs and their higher prices relative to
- 109. PLBs, there are a greater number of offerings in the grocery and apparel segments. Convenience is an important aspect of retail services, and customers frequently cite this as an important variable in the purchase of PLBs. One explanation is that customers sometimes prefer to complete the monthly grocery shopping in one store. Even if their favourite brand is not available in one category, they may not mind buying a PLB in the same category (if it is a low-involvement purchase). Consumers refer to convenience as access to stores, in-store facilities, search, transaction costs, billing processes, and exchange services. The result from focus group discussions supports the observation that while shopping convenience is an important parameter, it has not been empirically tested in any market. Notably, the extrinsic cues of packaging, brand name, price discount, and store name exert a positive influence on the purchase intention of PLBs (Diallo et al., 2013). Price discounts are the most important variable for predicting purchase intent, followed by brand name, packaging, and store name (also found in Richardson et al., 1994). Participants have confirmed that extrinsic cues, in particular, PLB price and brand name, often have more variance in the evaluation of product quality than intrinsic cues such as taste and ingredients. Intrinsic cues are the characteristics of the core product itself; taste is one of the essential properties that serves as a PLB quality indicator.
- 110. Previously, authors have worked mostly on single-cues (particularly extrinsic cues) which are somewhat artifactual (Rao and Monroe, 1989); very few studies have considered taste in determining the perceived quality of PLBs. This may be an interesting area of research, particularly because extrinsic cues (such as packaging) 217 PLBs in an emerging economy may make the consumer buy the product once but intrinsic cues (such as taste) will result in repeat purchases of that PLB product. The results of this study provide useful insights to PLB retailers in an emerging economy such as India. In line with the previous research findings, our results also show that Indian consumers perceive the quality of NBs as better than PLBs. Retailers need to realize that there is a large variation in the perceived quality of PLBs vis-à-vis NBs across all categories. Hence, Indian PLB retailers should focus on improving the intrinsic quality of their PLBs, which should be at least comparable to the intrinsic quality of the leading NB in that category. Moreover, PLB retailers need to emphasize promotional activities that focus on intrinsic product quality
- 111. and benefits (such as in-store sampling, tasting, and demonstrations). In addition to being price sensitive, Indian consumers are also quality sensitive (Mukharjee et al., 2012). Therefore, PLB retailers need to work towards reducing the perceived quality gaps with NBs and at the same time, offer these PLBs at reasonable prices. Along with price, PLB retailers also need to concentrate on non-price factors, such as shopping convenience and store image. Hence, these retailers need to focus on pricing and brand naming strategies, while improving packaging and store image. As mentioned above, Indian retailers commonly follow the “Sub-branding” or “House of brand” strategies. Hence, they need to carefully craft their brand architecture strategies with the thought that brand extensions need to be based on category-fit and brand associations, which develop over time. For example, a brand like Tasty Treat (a brand of Retailer A) that fits well for ready-to-eat products (e.g. biscuits and chips) may not be a good fit for ready-to-cook products (e.g. noodles and pasta). For premium PLBs, retailers need to work on distinctive packaging that differentiates them from NBs rather than adopting an imitation strategy. Many findings of our exploratory study confirm findings of existing PLB literature (e.g. perceived quality, price, promotion, and packaging). Beyond these, our study has
- 112. also explored new issues such as brand architecture strategies in PLB, retail convenience guiding the sales of PLBs in a store, and evaluation of intrinsic attributes of PLBs vs NBs by customers before making product choice/buying decision. More conclusive studies are required to establish/confirm these findings. Studies in emerging economies of other BRIC countries (Diallo, 2012; Diallo et al., 2013) show that common issues, such as modern retail formats and PLBs, are a relatively new phenomenon. Similarly, Mukharjee et al. (2012) highlights that consumers in emerging economies are price sensitive and look for value for money products. However, one needs to be cautious before attaching these generalized insights to other emerging economies. Limitations and direction for future research The limitations of this study arise from its exploratory nature and the fact that it examines one emerging economy (India); generalizations may be drawn with another large-scale future quantitative study. This study has not considered the role of seasonality on shopping behaviour or cultural factors of the preferred PLB categories. Given the limits of this study’s purposive sample of respondents, this was an initial attempt at identifying the preferred PLB categories among Indian consumers. The results of this study open several avenues for future research. It will be interesting to see if these factors and cues are relevant to price
- 113. conscious consumers in other emerging economies. Future studies may look into the branding strategies of PLBs and explore customers’ reactions on convenience, price, product quality, promotional offers, and store image in addition to different packaging and brand 218 IJRDM 44,2 naming strategies adopted by various retailers. This study anticipates that the findings will be useful to retail managers and other researchers, particularly those in emerging economies where PLBs are still in the initial growth stage. We believe that it is time to expand upon the discussion of branding strategies related to Indian PLBs. Notes 1. G stands for grocery, F&B stands for food and beverages, A&A stands for apparel and accessory, L&C stands for laundry and cleaning, V&D stands for vegetables and dairy, C&PC stands for cosmetic and personal care and CD stands for consumer durables. 2. The exact source of a quote is given using the following notation: FG No. 1 means that the discussion took place during the first of the three focus groups.
- 114. “M” means that the participant is a male and “F” indicates that the participant is a female. References Aaker, D.A. and Joachimsthaler, E. (2000), “The brand relationship spectrum”, California Management Review, Vol. 42 No. 4, pp. 8-23. Abhishek, S. (2014), “Private label brand choice dynamics: logit model involving demographic and psychographic variables”, South Asian Journal of Management, Vol. 21 No. 1, pp. 49-64. Anand, S. (2015), “Private labels do the trick for e-grocers”, The Economic Times, 17 June, p. 5. Aribarg, A., Arora, N., Henderson, T. and Kim, Y. (2014), “Private label imitation of a national brand: implications for consumer choice and law”, Journal of Marketing Research, Vol. 51 No. 6, pp. 657-675. Babbie, E. (2014), The Practice of Social Research, Cengage Learning, Boston, MA. Batra, R. and Sinha, I. (2000), “Consumer-level factors moderating the success of private label brands”, Journal of Retailing, Vol. 76 No. 2, pp. 175-191. BCG Retail Report (2015), “Retail 2020: retrospect, reinvent, rewrite – BCG in India”, available at: www.bcgindia.com/documents/file181823.pdf (accessed 9 June 2015).
- 115. Beneke, J., Flynn, R., Greig, T. and Mukaiwa, M. (2013), “The influence of perceived product quality, relative price and risk on customer value and willingness to buy: a study of private label merchandise”, Journal of Product & Brand Management, Vol. 22 No. 3, pp. 218-228. Breneiser, J.E. and Allen, S.N. (2011), “Taste preference for brand name versus store brand sodas”, North American Journal of Psychology, Vol. 13 No. 2, pp. 281-290. Calvo-Porral, C. and Lévy-Mangin, J.-P. (2014), “Determinants of store brands’ success: a cross- store format comparative analysis”, International Journal of Retail & Distribution Management, Vol. 42 No. 7, pp. 595-612. Collins-Dodd, C. and Lindley, T. (2003), “Store brands and retail differentiation: the influence of store image and store brand attitude on store own brand perceptions”, Journal of Retailing and Consumer Services, Vol. 10 No. 6, pp. 345-352. Delgado-Ballester, E., Hernandez-Espallardo, M. and Rodriguez-Orejuela, A. (2014), “Store image influences in consumers’ perceptions of store brands: the moderating role of value consciousness”, European Journal of Marketing, Vol. 48 Nos 9/10, pp. 1850-1869. Diallo, M.F. (2012), “Effects of store image and store brand price-image on store brand purchase intention: application to an emerging market”, Journal of Retailing and Consumer Services, Vol. 19 No. 3, pp. 360-367.
- 116. Diallo, M.F., Chandon, J.L., Cliquet, G. and Philippe, J. (2013), “Factors influencing consumer behaviour towards store brands: evidence from the French market”, International Journal of Retail & Distribution Management, Vol. 41 No. 6, pp. 422- 441. 219 PLBs in an emerging economy www.bcgindia.com/documents/file181823.pdf Dick, A., Jain, A. and Richardson, P. (1996), “How consumers evaluate store brands”, The Journal of Product and Brand Management, Vol. 5 No. 2, pp. 19-28. Fitzell, P.B. (1992), Private Label Marketing in the 1990s: The Evolution of Price Labels into Global Brands, Global Book Productions, New York, NY. Gielens, K. (2012), “New products: the antidote to private label growth?”, Journal of Marketing Research, Vol. 49 No. 3, pp. 408-423. Glynn, M.S. and Chen, S. (2009), “Consumer-factors moderating private label brand success: further empirical results”, International Journal of Retail & Distribution Management, Vol. 37 No. 11, pp. 896-914. González-Benito, Ó. and Martos-Partal, M. (2012), “Role of
- 117. retailer positioning and product category on the relationship between store brand consumption and store loyalty”, Journal of Retailing, Vol. 88 No. 2, pp. 236-249. Herstein, R., Tifferet, S., Luís Abrantes, J., Lymperopoulos, C., Albayrak, T. and Caber, M. (2012), “The effect of personality traits on private brand consumer tendencies: a cross-cultural study of Mediterranean countries”, Cross Cultural Management: An International Journal, Vol. 19 No. 2, pp. 196-214. Hultman, M., Opoku, R.A., Salehi-Sangari, E., Oghazi, P. and Bui, Q.T. (2008), “Private label competition: the perspective of Swedish branded goods manufacturers”, Management Research News, Vol. 31 No. 2, pp. 125-141. Hyman, M.R., Kopf, D.A. and Lee, D. (2010), “Review of literature – future research suggestions: private label brands: benefits, success factors and future research”, Journal of Brand Management, Vol. 17 No. 5, pp. 368-389. Joseph, J. and Sivakumaran, B. (2011), “Consumer promotions in the Indian market”, Journal of International Consumer Marketing, Vol. 23 No. 2, pp. 151-165. Koschate-Fischer, N., Cramer, J. and Hoyer, W.D. (2014), “Moderating effects of the relationship between private label share and store loyalty”, Journal of Marketing, Vol. 78 No. 2, pp. 69-82. Kotler, P., Armstrong, G. and Cunningham, P.H. (2005), Principles of Marketing, Pearson Education,
- 118. Toronto, ON. KPMG Report (2014), “Indian retail: the next growth story”, available at: www.kpmg.com/IN/en/ IssuesAndInsights/ArticlesPublications/Pages/IndianRetail.aspx (accessed 22 June 2015). Kremer, F. and Viot, C. (2012), “How store brands build retailer brand image”, International Journal of Retail & Distribution Management, Vol. 40 No. 7, pp. 528-543. Loken, B., Ross, I. and Hinkle, R.L. (1986), “Consumer ‘confusion’ of origin and brand similarity perceptions”, Journal of Public Policy & Marketing, Vol. 5 No. 1, pp. 195-211. Mishra, A.A. (2014), “Shopping value, satisfaction, and behavioral intentions: a sociodemographic and interproduct category study on private label brands”, Journal of Global Marketing, Vol. 27 No. 4, pp. 226-246. Mukharjee, A., Satija, D., Goyal, T.M., Mantrala, M.K. and Zou, S. (2012), “Are Indian consumers brand conscious? insights for global retailers”, Asia Pacific Journal of Marketing and Logistics, Vol. 20 No. 3, pp. 482-499. Muzellec, L. and Lambkin, M.C. (2009), “Corporate branding and brand architecture: a conceptual framework”, Marketing Theory, Vol. 9 No. 1, pp. 39-54. Nenycz-Thiel, M. (2011), “Private labels in Australia: a case where retailer concentration does not predicate private labels share”, Journal of Brand Management,
- 119. Vol. 18 No. 8, pp. 624-633. Nielson’s Report (2014), “The state of private label around the world”, available at: www.nielsen. com/us/en/insights/reports/2014/the-state-of-private-label- around-the-world.html (accessed 7 June 2015). 220 IJRDM 44,2 www.kpmg.com/IN/en/IssuesAndInsights/ArticlesPublications/P ages/IndianRetail.aspx www.kpmg.com/IN/en/IssuesAndInsights/ArticlesPublications/P ages/IndianRetail.aspx www.nielsen.com/us/en/insights/reports/2014/the-state-of- private-label-around-the-world.html www.nielsen.com/us/en/insights/reports/2014/the-state-of- private-label-around-the-world.html Olsen, N.V., Menichelli, E., Meyer, C. and Naes, T. (2011), “Consumers liking of private labels. An evaluation of intrinsic and extrinsic orange juice cues”, Appetite, Vol. 56 No. 3, pp. 770-777. Olson, E.L. (2012), “Supplier inferences to enhance private label perceptions”, Journal of Business Research, Vol. 65 No. 1, pp. 100-105. Pavia, T.M. and Costa, J.A. (1993), “The winning number: consumer perceptions of alpha-numeric brand names”, Journal of Marketing, Vol. 57 No. 3, pp. 85-98.
- 120. Pepe, M. (2012), “The impact of private label sales penetration on category profitability”, Journal of Business & Economics Research, Vol. 10 No. 9, pp. 513-519. Perloff, J.M., LaFrance, J.T. and Chouinard, H.H. (2012), “Brand name and private label price setting by a monopoly store”, Economics Letters, Vol. 116 No. 3, pp. 508-511. Rao, A.R. and Monroe, K.B. (1989), “The effect of price, brand name, and store name on buyers’ perceptions of product quality: an integrative review”, Journal of Marketing Research, Vol. 26 No. 3, pp. 351-357. Richardson, P.S., Dick, A.S. and Jain, A.K. (1994), “Extrinsic and intrinsic cue effects on perceptions of store brand quality”, The Journal of Marketing, Vol. 58 No. 4, pp. 28-36. Richardson, P.S., Jain, A.K. and Dick, A. (1996), “Household store brand proneness: a framework”, Journal of Retailing, Vol. 72 No. 2, pp. 159-185. Saraswat, A., Mammen, T., Aagja, J.P. and Tewari, R. (2010), “Building store brands using store image differentiation”, Journal of Indian Business Research, Vol. 2 No. 3, pp. 166-180. Sayman, S. and Raju, J.S. (2004), “Investigating the cross- category effects of store brands”, Review of Industrial Organization, Vol. 24 No. 2, pp. 129-141. Sethuraman, R. and Gielens, K. (2014), “Determinants of store
- 121. brand share”, Journal of Retailing, Vol. 90 No. 2, pp. 141-153. Shannon, R. and Mandhachitara, R. (2005), “Private-label grocery shopping attitudes and behaviour: a cross-cultural study”, Journal of Brand Management, Vol. 12 No. 6, pp. 461-474. Sinapuelas, I.C.S. and Robinson, W.T. (2012), “Do me-too brands price lower than the feature pioneer?”, Journal of Product & Brand Management, Vol. 21 No. 5, pp. 350-358. Sloot, L.M. and Verhoef, P.C. (2008), “The impact of brand delisting on store switching and brand switching intentions”, Journal of Retailing, Vol. 84 No. 3, pp. 281-296. Sprott, D.E. and Shimp, T.A. (2004), “Using product sampling to augment the perceived quality of store brands”, Journal of Retailing, Vol. 80 No. 4, pp. 305-315. Steenkamp, J.-B.E.M. and Geyskens, I. (2014), “Manufacturer and retailer strategies to impact store brand share: global integration, local adaptation, and worldwide learning”, Marketing Science, Vol. 33 No. 1, pp. 6-26. Steenkamp, J.-B.E.M., Van Heerde, H.J. and Geyskens, I. (2010), “What makes consumers willing to pay a price premium for national brands over private labels?”, Journal of Marketing Research, Vol. 47 No. 6, pp. 1011-1024. Store Brands Decisions (2010), “Walmart shifts private label
- 122. strategy”, available at: www.store brandsdecisions.com/news/2010/09/21/walmart-shifts-private- label-strategy (accessed 17 June 2015). Tversky, A. (2004), Preference, Belief, and Similarity: Selected Writings, The MIT Press, Cambridge, MA. Zaichkowsky, J.L. (1995), Defending Your Brand Against Imitation, Quorum Books, Westport, CT. Zielke, S. and Dobbelstein, T. (2007), “Customers’ willingness to purchase new store brands”, Journal of Product & Brand Management, Vol. 16 No. 2, pp. 112-121. 221 PLBs in an emerging economy www.storebrandsdecisions.com/news/2010/09/21/walmart- shifts-private-label-strategy www.storebrandsdecisions.com/news/2010/09/21/walmart- shifts-private-label-strategy Further reading Dawes, J. and Nenycz-Thiel, M. (2013), “Analyzing the intensity of private label competition across retailers”, Journal of Business Research, Vol. 66 No. 1, pp. 60-66. Herstein, R., Gilboa, S. and Gamliel, E. (2014), “Private and
- 123. national brand consumers’ images of fashion stores”, Journal of Product & Brand Management, Vol. 22 Nos 5/6, pp. 331-341. About the authors Siddhartha Sarkar is a Doctoral Candidate of Marketing at the Shailesh J. Mehta School of Management, IIT Bombay, India. His research interests include brand management, private labels, and retail strategy. Siddhartha Sarkar is the corresponding author and can be contacted at: [email protected] Dinesh Sharma is an Assistant Professor of Marketing at the Shailesh J. Mehta School of Management, IIT Bombay, India. His areas of interest in teaching are marketing strategy, marketing research, brand management, sales and distribution management. He has published papers in many peer-reviewed international journals and also has written case studies. Arti D. Kalro is an Assistant Professor of Marketing at the Shailesh J. Mehta School of Management, IIT Bombay, India. Her research interests include marketing communications, specifically, advertising; social media and online marketing; green marketing. She has published papers in international journals like Journal of Consumer Behavior, Journal of Brand Management and presented numerous papers in various international conferences. For instructions on how to order reprints of this article, please visit our website: www.emeraldgrouppublishing.com/licensing/reprints.htm
- 124. Or contact us for further details: [email protected] 222 IJRDM 44,2 mailto:[email protected] Reproduced with permission of the copyright owner. Further reproduction prohibited without permission.