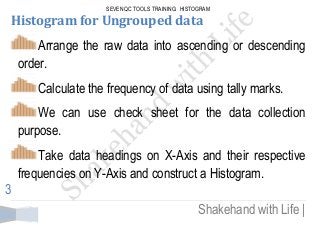
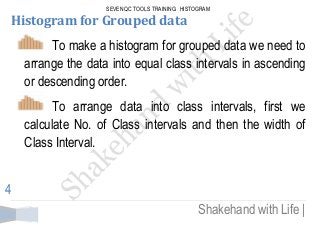
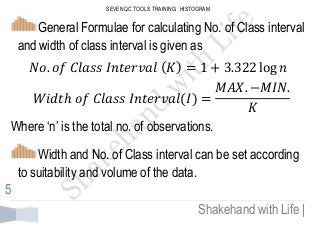
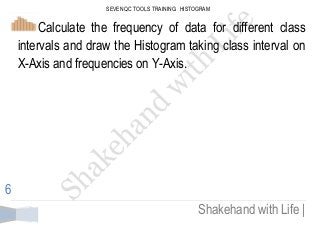
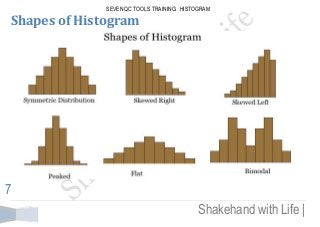
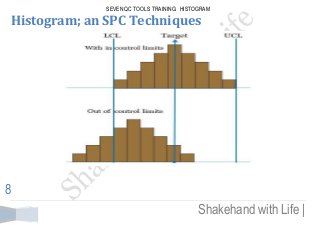
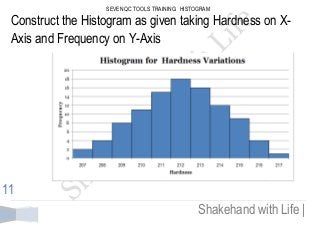
SEVEN QC TOOLS TRAINING 
Histogram
SEVEN QC TOOLS TRAINING: HISTOGRAM 
Shakehand with Life | 
1 
Introduction Histogram is an important tool which presents a large amount of data graphically and describes the properties of data. Histogram is the graphical presentation of the data by rectangular adjacent bars. Class of data is taken on X-Axis, while the height of the bars shows the frequency of the class. Histogram showcases the spread of data.
SEVEN QC TOOLS TRAINING: HISTOGRAM 
Shakehand with Life | 
2 
Histogram showcases the Skewness in the data. Skewness in the data is the result of absence of symmetry in the data. Histogram pictured this symmetric absence in the data by means of a line curve drawn by meeting the mid-points of heads of rectangular bars. If there is no Skewness in the data the curve will be a normal curve and this confirms symmetric distribution of data.
SEVEN QC TOOLS TRAINING: HISTOGRAM 
Shakehand with Life | 
3 
Histogram for Ungrouped data Arrange the raw data into ascending or descending order. Calculate the frequency of data using tally marks. We can use check sheet for the data collection purpose. Take data headings on X-Axis and their respective frequencies on Y-Axis and construct a Histogram.
SEVEN QC TOOLS TRAINING: HISTOGRAM 
Shakehand with Life | 
4 
Histogram for Grouped data To make a histogram for grouped data we need to arrange the data into equal class intervals in ascending or descending order. To arrange data into class intervals, first we calculate No. of Class intervals and then the width of Class Interval.
SEVEN QC TOOLS TRAINING: HISTOGRAM 
Shakehand with Life | 
5 
General Formulae for calculating No. of Class interval and width of class interval is given as 
( ) ( ) 
Where ‘n’ is the total no. of observations. Width and No. of Class interval can be set according to suitability and volume of the data.
SEVEN QC TOOLS TRAINING: HISTOGRAM 
Shakehand with Life | 
6 
Calculate the frequency of data for different class intervals and draw the Histogram taking class interval on X-Axis and frequencies on Y-Axis.
SEVEN QC TOOLS TRAINING: HISTOGRAM 
Shakehand with Life | 
7 
Shapes of Histogram
SEVEN QC TOOLS TRAINING: HISTOGRAM 
Shakehand with Life | 
8 
Histogram; an SPC Techniques
SEVEN QC TOOLS TRAINING: HISTOGRAM 
Shakehand with Life | 
9 
Construction of Histogram 
One hundred components were inspected for their hardness. Observations were recorded as given. Draw a histogram showing variations in hardness 
211, 212, 209, 210, 212, 211, 209, 211, 210, 212, 212, 207, 211, 212, 210, 209, 211, 214, 209, 211, 213, 210, 208, 217, 214, 213, 207, 216, 213, 210, 212, 208, 212, 208, 211, 214, 212, 210, 212, 213, 208, 211, 213, 211, 213, 212, 216, 212, 211, 214, 213, 210, 211, 213, 212, 211, 210, 213, 209, 212, 214, 213, 214, 216, 215, 215, 213, 215, 215, 210, 209, 212, 215, 212, 210, 209, 215, 211, 213, 215, 212, 214, 213, 214, 214, 213, 209, 215, 212, 214, 210, 215, 216, 213, 211, 214, 211, 212, 214, 213
SEVEN QC TOOLS TRAINING: HISTOGRAM 
Shakehand with Life | 
10 
Collect the data as given below 
Hardness 
Tally Marks 
Frequency 
207 
// 
2 
208 
//// 
4 
209 
//// /// 
8 
210 
//// //// / 
11 
211 
//// //// //// 
15 
212 
//// //// //// /// 
18 
213 
//// //// //// / 
16 
214 
//// //// // 
12 
215 
//// //// 
9 
216 
//// 
4 
217 
/ 
1 
Total 
100
SEVEN QC TOOLS TRAINING: HISTOGRAM 
Shakehand with Life | 
11 
Construct the Histogram as given taking Hardness on X- Axis and Frequency on Y-Axis
SEVEN QC TOOLS TRAINING: HISTOGRAM 
Shakehand with Life | 
12 
Contact 
Narender Sharma 
Mob: 08684861131, 09315132462 
Website: www.shakehandwithlife.in | www.shakehandwithlife.puzl.com | www.shakehandwithlife.blogspot.in 
Email: shakehandwithlife@gmail.com | narender@shakehandwithlife.in

Seven QC Tools Training; Histogram

  • 1.
    SEVEN QC TOOLSTRAINING Histogram
  • 2.
    SEVEN QC TOOLSTRAINING: HISTOGRAM Shakehand with Life | 1 Introduction Histogram is an important tool which presents a large amount of data graphically and describes the properties of data. Histogram is the graphical presentation of the data by rectangular adjacent bars. Class of data is taken on X-Axis, while the height of the bars shows the frequency of the class. Histogram showcases the spread of data.
  • 3.
    SEVEN QC TOOLSTRAINING: HISTOGRAM Shakehand with Life | 2 Histogram showcases the Skewness in the data. Skewness in the data is the result of absence of symmetry in the data. Histogram pictured this symmetric absence in the data by means of a line curve drawn by meeting the mid-points of heads of rectangular bars. If there is no Skewness in the data the curve will be a normal curve and this confirms symmetric distribution of data.
  • 4.
    SEVEN QC TOOLSTRAINING: HISTOGRAM Shakehand with Life | 3 Histogram for Ungrouped data Arrange the raw data into ascending or descending order. Calculate the frequency of data using tally marks. We can use check sheet for the data collection purpose. Take data headings on X-Axis and their respective frequencies on Y-Axis and construct a Histogram.
  • 5.
    SEVEN QC TOOLSTRAINING: HISTOGRAM Shakehand with Life | 4 Histogram for Grouped data To make a histogram for grouped data we need to arrange the data into equal class intervals in ascending or descending order. To arrange data into class intervals, first we calculate No. of Class intervals and then the width of Class Interval.
  • 6.
    SEVEN QC TOOLSTRAINING: HISTOGRAM Shakehand with Life | 5 General Formulae for calculating No. of Class interval and width of class interval is given as ( ) ( ) Where ‘n’ is the total no. of observations. Width and No. of Class interval can be set according to suitability and volume of the data.
  • 7.
    SEVEN QC TOOLSTRAINING: HISTOGRAM Shakehand with Life | 6 Calculate the frequency of data for different class intervals and draw the Histogram taking class interval on X-Axis and frequencies on Y-Axis.
  • 8.
    SEVEN QC TOOLSTRAINING: HISTOGRAM Shakehand with Life | 7 Shapes of Histogram
  • 9.
    SEVEN QC TOOLSTRAINING: HISTOGRAM Shakehand with Life | 8 Histogram; an SPC Techniques
  • 10.
    SEVEN QC TOOLSTRAINING: HISTOGRAM Shakehand with Life | 9 Construction of Histogram One hundred components were inspected for their hardness. Observations were recorded as given. Draw a histogram showing variations in hardness 211, 212, 209, 210, 212, 211, 209, 211, 210, 212, 212, 207, 211, 212, 210, 209, 211, 214, 209, 211, 213, 210, 208, 217, 214, 213, 207, 216, 213, 210, 212, 208, 212, 208, 211, 214, 212, 210, 212, 213, 208, 211, 213, 211, 213, 212, 216, 212, 211, 214, 213, 210, 211, 213, 212, 211, 210, 213, 209, 212, 214, 213, 214, 216, 215, 215, 213, 215, 215, 210, 209, 212, 215, 212, 210, 209, 215, 211, 213, 215, 212, 214, 213, 214, 214, 213, 209, 215, 212, 214, 210, 215, 216, 213, 211, 214, 211, 212, 214, 213
  • 11.
    SEVEN QC TOOLSTRAINING: HISTOGRAM Shakehand with Life | 10 Collect the data as given below Hardness Tally Marks Frequency 207 // 2 208 //// 4 209 //// /// 8 210 //// //// / 11 211 //// //// //// 15 212 //// //// //// /// 18 213 //// //// //// / 16 214 //// //// // 12 215 //// //// 9 216 //// 4 217 / 1 Total 100
  • 12.
    SEVEN QC TOOLSTRAINING: HISTOGRAM Shakehand with Life | 11 Construct the Histogram as given taking Hardness on X- Axis and Frequency on Y-Axis
  • 13.
    SEVEN QC TOOLSTRAINING: HISTOGRAM Shakehand with Life | 12 Contact Narender Sharma Mob: 08684861131, 09315132462 Website: www.shakehandwithlife.in | www.shakehandwithlife.puzl.com | www.shakehandwithlife.blogspot.in Email: shakehandwithlife@gmail.com | narender@shakehandwithlife.in