SlideShare a Scribd company logo
1 of 4
Download to read offline
Jamri AB Chapter 4 : Measure of Dispersion and Skewness (EPjj) 
1 
CHAPTER 4 : MEASURE OF DISPERSION AND SKEWNESS 
4.1 VARIANCE (S2) AND STANDARD DEVIATION (S) 
a) Ungrouped data 
Variance, S2 = 
b) Grouped data 
Variance, S2 = 
4.2 COEFFICIENT OF VARIATION (CV) 
 Sometimes we may need to compare the variability of two different data sets that have different units of measurement, the CV is one such measure. 
 CV expresses standard deviation as a percentage of the mean and is computed as follows: 
CV = 
Example 1: 
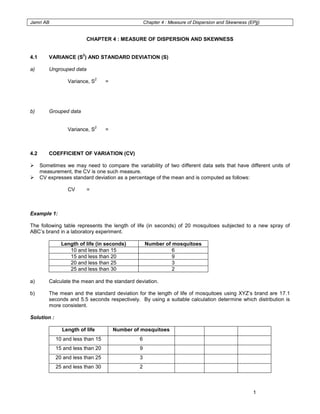
The following table represents the length of life (in seconds) of 20 mosquitoes subjected to a new spray of ABC’s brand in a laboratory experiment. 
Length of life (in seconds) 
Number of mosquitoes 
10 and less than 15 
6 
15 and less than 20 
9 
20 and less than 25 
3 
25 and less than 30 
2 
a) Calculate the mean and the standard deviation. 
b) The mean and the standard deviation for the length of life of mosquitoes using XYZ’s brand are 17.1 seconds and 5.5 seconds respectively. By using a suitable calculation determine which distribution is more consistent. 
Solution : 
Length of life 
Number of mosquitoes 
10 and less than 15 
6 
15 and less than 20 
9 
20 and less than 25 
3 
25 and less than 30 
2
Jamri AB Chapter 4 : Measure of Dispersion and Skewness (EPjj) 
2 
Mean 
Standard deviation 
CV (ABC) 
CV (XYZ) 
4.3 SKEWNESS 
Skewed to the right (Positively Skewed Distributions) 
In this distribution, the long tail indicates the presence of extreme values at the positive end of the distribution. This pulls the mean to the right. In a positively skewed distribution, the mean is pulled in a positive direction. The frequency curve would be: 
Symmetrical Bell-Shaped Distribution, 
This type of distribution is known as ‘normal’ and an approximately normal distribution occurs when measuring quantities such as heights, examination marks and ext.
Jamri AB Chapter 4 : Measure of Dispersion and Skewness (EPjj) 
3 
Skewed to the left (Negatively Skewed Distributions) 
In a negatively skewed distribution, the mean is pulled in a negative direction. The frequency curve would be: 
Mode < median & mean = skewed to the right 
Mode > median & mean = skewed to the left 
PEARSON’S COEFFICIENT OF SKEWNESS 
 We need to know two things to describe the ‘skewness’ of a distribution. 
 One is the direction of the skew, positive or negative, and the other is a measure of the degree of skewness, i.e. how far the distribution is pulled in one direction. 
 One measure of skewness is given by PEARSON’S COEFFICIENT OF SKEWNESS. 
 The formula for skewness is 
mean – mode or 3(mean – median) 
standard deviation standard deviation 
 Generally skewness can take any value between 3 and –3.
Jamri AB Chapter 4 : Measure of Dispersion and Skewness (EPjj) 
4 
4.4 BOX PLOT 
The following data show the times (in seconds) between an order being placed and the food being received at a MacDonald’s drive-thru window. 
166 83 158 101 200 
70 255 129 121 135 
i. Find the value of first quarter (Q 1 ), Median (Q 2 ) and third quarter (Q 3 ) 
ii. Construct a box plot for the data. 
iii. Comment on the skewness. 
Solution : 
1 
2 
3 
4 
5 
6 
7 
8 
9 
10 
70 
83 
101 
121 
129 
135 
158 
166 
200 
255 
Lower quartile or first quartile , Q 1 => position = n + 1 = 
4 
Q 1 = 
Q 2 (median) => position = n + 1 = 
2 
Q 2 (median) = 
Upper quartile or third quartile Q 3 => position = 3(n + 1) = 
4 
Q 3 = 
Construct a box plot 
______________________________________________________________________

More Related Content

What's hot (20)

Skewness
Skewness Skewness
Skewness
 
Measures of dispersion
Measures of dispersionMeasures of dispersion
Measures of dispersion
 
Chapter 11 ,Measures of Dispersion(statistics)
Chapter  11 ,Measures of Dispersion(statistics)Chapter  11 ,Measures of Dispersion(statistics)
Chapter 11 ,Measures of Dispersion(statistics)
 
Skewness
SkewnessSkewness
Skewness
 
Measures of variability
Measures of variabilityMeasures of variability
Measures of variability
 
Statistics
StatisticsStatistics
Statistics
 
State presentation2
State presentation2State presentation2
State presentation2
 
Dispersion
DispersionDispersion
Dispersion
 
Skewness
SkewnessSkewness
Skewness
 
Definition of dispersion
Definition of dispersionDefinition of dispersion
Definition of dispersion
 
Standard deviation by nikita
Standard deviation by nikitaStandard deviation by nikita
Standard deviation by nikita
 
Standard deviation
Standard deviationStandard deviation
Standard deviation
 
MOMENTS, MOMENT RATIO AND SKEWNESS
MOMENTS, MOMENT RATIO AND SKEWNESSMOMENTS, MOMENT RATIO AND SKEWNESS
MOMENTS, MOMENT RATIO AND SKEWNESS
 
Concept of Skewness: Bowley's method
Concept of Skewness: Bowley's methodConcept of Skewness: Bowley's method
Concept of Skewness: Bowley's method
 
Mean deviation (2018)
Mean deviation (2018)Mean deviation (2018)
Mean deviation (2018)
 
Measure of variability
Measure of variabilityMeasure of variability
Measure of variability
 
Unit iii measures of dispersion (2)
Unit iii  measures of dispersion (2)Unit iii  measures of dispersion (2)
Unit iii measures of dispersion (2)
 
Measures of dispersion
Measures of dispersionMeasures of dispersion
Measures of dispersion
 
Measures of Spread
Measures of SpreadMeasures of Spread
Measures of Spread
 
Variability
VariabilityVariability
Variability
 

Viewers also liked

Viewers also liked (19)

Regression analysis
Regression analysisRegression analysis
Regression analysis
 
Regression Analysis
Regression AnalysisRegression Analysis
Regression Analysis
 
Basics of Regression analysis
 Basics of Regression analysis Basics of Regression analysis
Basics of Regression analysis
 
Measure of Dispersion
Measure of DispersionMeasure of Dispersion
Measure of Dispersion
 
Introduction to correlation and regression analysis
Introduction to correlation and regression analysisIntroduction to correlation and regression analysis
Introduction to correlation and regression analysis
 
Data handling Presentation with solved examples
Data handling Presentation with solved examplesData handling Presentation with solved examples
Data handling Presentation with solved examples
 
Mean, Median, Mode, And Range
Mean, Median, Mode, And RangeMean, Median, Mode, And Range
Mean, Median, Mode, And Range
 
Measures Of Central Tendency
Measures Of Central TendencyMeasures Of Central Tendency
Measures Of Central Tendency
 
Regression analysis
Regression analysisRegression analysis
Regression analysis
 
Statistics in research
Statistics in researchStatistics in research
Statistics in research
 
Skewness
SkewnessSkewness
Skewness
 
Textile finishing bultan
Textile finishing  bultanTextile finishing  bultan
Textile finishing bultan
 
Probability Distributions
Probability DistributionsProbability Distributions
Probability Distributions
 
Regression analysis
Regression analysisRegression analysis
Regression analysis
 
Textile finishes
Textile finishes Textile finishes
Textile finishes
 
Mean, median, mode, & range ppt
Mean, median, mode, & range pptMean, median, mode, & range ppt
Mean, median, mode, & range ppt
 
Regression analysis ppt
Regression analysis pptRegression analysis ppt
Regression analysis ppt
 
Mean, Median, Mode: Measures of Central Tendency
Mean, Median, Mode: Measures of Central Tendency Mean, Median, Mode: Measures of Central Tendency
Mean, Median, Mode: Measures of Central Tendency
 
Probability concept and Probability distribution
Probability concept and Probability distributionProbability concept and Probability distribution
Probability concept and Probability distribution
 

Similar to Chap4 measure of dispersion and skewness

Applied 40S March 25, 2009
Applied 40S March 25, 2009Applied 40S March 25, 2009
Applied 40S March 25, 2009Darren Kuropatwa
 
Statistical quality__control_2
Statistical  quality__control_2Statistical  quality__control_2
Statistical quality__control_2Tech_MX
 
Statistics-Measures of dispersions
Statistics-Measures of dispersionsStatistics-Measures of dispersions
Statistics-Measures of dispersionsCapricorn
 
Measure of dispersion by Neeraj Bhandari ( Surkhet.Nepal )
Measure of dispersion by Neeraj Bhandari ( Surkhet.Nepal )Measure of dispersion by Neeraj Bhandari ( Surkhet.Nepal )
Measure of dispersion by Neeraj Bhandari ( Surkhet.Nepal )Neeraj Bhandari
 
measure of variability (windri). In research include example
measure of variability (windri). In research include examplemeasure of variability (windri). In research include example
measure of variability (windri). In research include examplewindri3
 
Ge 105 lecture 1 (LEAST SQUARES ADJUSTMENT) by: Broddett B. Abatayo
Ge 105 lecture 1 (LEAST SQUARES ADJUSTMENT) by: Broddett B. AbatayoGe 105 lecture 1 (LEAST SQUARES ADJUSTMENT) by: Broddett B. Abatayo
Ge 105 lecture 1 (LEAST SQUARES ADJUSTMENT) by: Broddett B. AbatayoBPA ABATAYO Land Surveying Services
 
GRAPHICAL PRESENTATION OF QUALITATIVE DATA.pptx
GRAPHICAL PRESENTATION OF QUALITATIVE DATA.pptxGRAPHICAL PRESENTATION OF QUALITATIVE DATA.pptx
GRAPHICAL PRESENTATION OF QUALITATIVE DATA.pptxKISHOR_SOCHALIYA
 
ch-4-measures-of-variability-11 2.ppt for nursing
ch-4-measures-of-variability-11 2.ppt for nursingch-4-measures-of-variability-11 2.ppt for nursing
ch-4-measures-of-variability-11 2.ppt for nursingwindri3
 
measures-of-variability-11.ppt
measures-of-variability-11.pptmeasures-of-variability-11.ppt
measures-of-variability-11.pptNievesGuardian1
 
Introduction to Probability and Statistics 13th Edition Mendenhall Solutions ...
Introduction to Probability and Statistics 13th Edition Mendenhall Solutions ...Introduction to Probability and Statistics 13th Edition Mendenhall Solutions ...
Introduction to Probability and Statistics 13th Edition Mendenhall Solutions ...MaxineBoyd
 
Statistics (Measures of Dispersion)
Statistics (Measures of Dispersion)Statistics (Measures of Dispersion)
Statistics (Measures of Dispersion)Ron_Eick
 
Testing a Claim About a Standard Deviation or Variance
Testing a Claim About a Standard Deviation or VarianceTesting a Claim About a Standard Deviation or Variance
Testing a Claim About a Standard Deviation or VarianceLong Beach City College
 
St201 d normal distributions
St201 d normal distributionsSt201 d normal distributions
St201 d normal distributionsSharayah Becker
 
Chapter 7 Powerpoint
Chapter 7 PowerpointChapter 7 Powerpoint
Chapter 7 PowerpointZIADALRIFAI
 
Estimating a Population Standard Deviation or Variance
Estimating a Population Standard Deviation or VarianceEstimating a Population Standard Deviation or Variance
Estimating a Population Standard Deviation or VarianceLong Beach City College
 

Similar to Chap4 measure of dispersion and skewness (20)

wk-2.pptx
wk-2.pptxwk-2.pptx
wk-2.pptx
 
Applied 40S March 25, 2009
Applied 40S March 25, 2009Applied 40S March 25, 2009
Applied 40S March 25, 2009
 
Statistical quality__control_2
Statistical  quality__control_2Statistical  quality__control_2
Statistical quality__control_2
 
Statistics-Measures of dispersions
Statistics-Measures of dispersionsStatistics-Measures of dispersions
Statistics-Measures of dispersions
 
Measure of dispersion by Neeraj Bhandari ( Surkhet.Nepal )
Measure of dispersion by Neeraj Bhandari ( Surkhet.Nepal )Measure of dispersion by Neeraj Bhandari ( Surkhet.Nepal )
Measure of dispersion by Neeraj Bhandari ( Surkhet.Nepal )
 
S5 pn
S5 pnS5 pn
S5 pn
 
measure of variability (windri). In research include example
measure of variability (windri). In research include examplemeasure of variability (windri). In research include example
measure of variability (windri). In research include example
 
Ge 105 lecture 1 (LEAST SQUARES ADJUSTMENT) by: Broddett B. Abatayo
Ge 105 lecture 1 (LEAST SQUARES ADJUSTMENT) by: Broddett B. AbatayoGe 105 lecture 1 (LEAST SQUARES ADJUSTMENT) by: Broddett B. Abatayo
Ge 105 lecture 1 (LEAST SQUARES ADJUSTMENT) by: Broddett B. Abatayo
 
GRAPHICAL PRESENTATION OF QUALITATIVE DATA.pptx
GRAPHICAL PRESENTATION OF QUALITATIVE DATA.pptxGRAPHICAL PRESENTATION OF QUALITATIVE DATA.pptx
GRAPHICAL PRESENTATION OF QUALITATIVE DATA.pptx
 
ch-4-measures-of-variability-11 2.ppt for nursing
ch-4-measures-of-variability-11 2.ppt for nursingch-4-measures-of-variability-11 2.ppt for nursing
ch-4-measures-of-variability-11 2.ppt for nursing
 
measures-of-variability-11.ppt
measures-of-variability-11.pptmeasures-of-variability-11.ppt
measures-of-variability-11.ppt
 
exercises.pdf
exercises.pdfexercises.pdf
exercises.pdf
 
Introduction to Probability and Statistics 13th Edition Mendenhall Solutions ...
Introduction to Probability and Statistics 13th Edition Mendenhall Solutions ...Introduction to Probability and Statistics 13th Edition Mendenhall Solutions ...
Introduction to Probability and Statistics 13th Edition Mendenhall Solutions ...
 
Statistics (Measures of Dispersion)
Statistics (Measures of Dispersion)Statistics (Measures of Dispersion)
Statistics (Measures of Dispersion)
 
Testing a Claim About a Standard Deviation or Variance
Testing a Claim About a Standard Deviation or VarianceTesting a Claim About a Standard Deviation or Variance
Testing a Claim About a Standard Deviation or Variance
 
GEODETIC Least Square with fx 991-es plus
GEODETIC Least Square with fx 991-es plusGEODETIC Least Square with fx 991-es plus
GEODETIC Least Square with fx 991-es plus
 
Skewness.pdf
Skewness.pdfSkewness.pdf
Skewness.pdf
 
St201 d normal distributions
St201 d normal distributionsSt201 d normal distributions
St201 d normal distributions
 
Chapter 7 Powerpoint
Chapter 7 PowerpointChapter 7 Powerpoint
Chapter 7 Powerpoint
 
Estimating a Population Standard Deviation or Variance
Estimating a Population Standard Deviation or VarianceEstimating a Population Standard Deviation or Variance
Estimating a Population Standard Deviation or Variance
 

Recently uploaded

APM Welcome, APM North West Network Conference, Synergies Across Sectors
APM Welcome, APM North West Network Conference, Synergies Across SectorsAPM Welcome, APM North West Network Conference, Synergies Across Sectors
APM Welcome, APM North West Network Conference, Synergies Across SectorsAssociation for Project Management
 
The Most Excellent Way | 1 Corinthians 13
The Most Excellent Way | 1 Corinthians 13The Most Excellent Way | 1 Corinthians 13
The Most Excellent Way | 1 Corinthians 13Steve Thomason
 
Micromeritics - Fundamental and Derived Properties of Powders
Micromeritics - Fundamental and Derived Properties of PowdersMicromeritics - Fundamental and Derived Properties of Powders
Micromeritics - Fundamental and Derived Properties of PowdersChitralekhaTherkar
 
Sanyam Choudhary Chemistry practical.pdf
Sanyam Choudhary Chemistry practical.pdfSanyam Choudhary Chemistry practical.pdf
Sanyam Choudhary Chemistry practical.pdfsanyamsingh5019
 
MENTAL STATUS EXAMINATION format.docx
MENTAL     STATUS EXAMINATION format.docxMENTAL     STATUS EXAMINATION format.docx
MENTAL STATUS EXAMINATION format.docxPoojaSen20
 
Separation of Lanthanides/ Lanthanides and Actinides
Separation of Lanthanides/ Lanthanides and ActinidesSeparation of Lanthanides/ Lanthanides and Actinides
Separation of Lanthanides/ Lanthanides and ActinidesFatimaKhan178732
 
Accessible design: Minimum effort, maximum impact
Accessible design: Minimum effort, maximum impactAccessible design: Minimum effort, maximum impact
Accessible design: Minimum effort, maximum impactdawncurless
 
How to Make a Pirate ship Primary Education.pptx
How to Make a Pirate ship Primary Education.pptxHow to Make a Pirate ship Primary Education.pptx
How to Make a Pirate ship Primary Education.pptxmanuelaromero2013
 
Kisan Call Centre - To harness potential of ICT in Agriculture by answer farm...
Kisan Call Centre - To harness potential of ICT in Agriculture by answer farm...Kisan Call Centre - To harness potential of ICT in Agriculture by answer farm...
Kisan Call Centre - To harness potential of ICT in Agriculture by answer farm...Krashi Coaching
 
POINT- BIOCHEMISTRY SEM 2 ENZYMES UNIT 5.pptx
POINT- BIOCHEMISTRY SEM 2 ENZYMES UNIT 5.pptxPOINT- BIOCHEMISTRY SEM 2 ENZYMES UNIT 5.pptx
POINT- BIOCHEMISTRY SEM 2 ENZYMES UNIT 5.pptxSayali Powar
 
Science 7 - LAND and SEA BREEZE and its Characteristics
Science 7 - LAND and SEA BREEZE and its CharacteristicsScience 7 - LAND and SEA BREEZE and its Characteristics
Science 7 - LAND and SEA BREEZE and its CharacteristicsKarinaGenton
 
Alper Gobel In Media Res Media Component
Alper Gobel In Media Res Media ComponentAlper Gobel In Media Res Media Component
Alper Gobel In Media Res Media ComponentInMediaRes1
 
Incoming and Outgoing Shipments in 1 STEP Using Odoo 17
Incoming and Outgoing Shipments in 1 STEP Using Odoo 17Incoming and Outgoing Shipments in 1 STEP Using Odoo 17
Incoming and Outgoing Shipments in 1 STEP Using Odoo 17Celine George
 
Solving Puzzles Benefits Everyone (English).pptx
Solving Puzzles Benefits Everyone (English).pptxSolving Puzzles Benefits Everyone (English).pptx
Solving Puzzles Benefits Everyone (English).pptxOH TEIK BIN
 
“Oh GOSH! Reflecting on Hackteria's Collaborative Practices in a Global Do-It...
“Oh GOSH! Reflecting on Hackteria's Collaborative Practices in a Global Do-It...“Oh GOSH! Reflecting on Hackteria's Collaborative Practices in a Global Do-It...
“Oh GOSH! Reflecting on Hackteria's Collaborative Practices in a Global Do-It...Marc Dusseiller Dusjagr
 
Paris 2024 Olympic Geographies - an activity
Paris 2024 Olympic Geographies - an activityParis 2024 Olympic Geographies - an activity
Paris 2024 Olympic Geographies - an activityGeoBlogs
 
mini mental status format.docx
mini    mental       status     format.docxmini    mental       status     format.docx
mini mental status format.docxPoojaSen20
 
The basics of sentences session 2pptx copy.pptx
The basics of sentences session 2pptx copy.pptxThe basics of sentences session 2pptx copy.pptx
The basics of sentences session 2pptx copy.pptxheathfieldcps1
 
A Critique of the Proposed National Education Policy Reform
A Critique of the Proposed National Education Policy ReformA Critique of the Proposed National Education Policy Reform
A Critique of the Proposed National Education Policy ReformChameera Dedduwage
 
Mastering the Unannounced Regulatory Inspection
Mastering the Unannounced Regulatory InspectionMastering the Unannounced Regulatory Inspection
Mastering the Unannounced Regulatory InspectionSafetyChain Software
 

Recently uploaded (20)

APM Welcome, APM North West Network Conference, Synergies Across Sectors
APM Welcome, APM North West Network Conference, Synergies Across SectorsAPM Welcome, APM North West Network Conference, Synergies Across Sectors
APM Welcome, APM North West Network Conference, Synergies Across Sectors
 
The Most Excellent Way | 1 Corinthians 13
The Most Excellent Way | 1 Corinthians 13The Most Excellent Way | 1 Corinthians 13
The Most Excellent Way | 1 Corinthians 13
 
Micromeritics - Fundamental and Derived Properties of Powders
Micromeritics - Fundamental and Derived Properties of PowdersMicromeritics - Fundamental and Derived Properties of Powders
Micromeritics - Fundamental and Derived Properties of Powders
 
Sanyam Choudhary Chemistry practical.pdf
Sanyam Choudhary Chemistry practical.pdfSanyam Choudhary Chemistry practical.pdf
Sanyam Choudhary Chemistry practical.pdf
 
MENTAL STATUS EXAMINATION format.docx
MENTAL     STATUS EXAMINATION format.docxMENTAL     STATUS EXAMINATION format.docx
MENTAL STATUS EXAMINATION format.docx
 
Separation of Lanthanides/ Lanthanides and Actinides
Separation of Lanthanides/ Lanthanides and ActinidesSeparation of Lanthanides/ Lanthanides and Actinides
Separation of Lanthanides/ Lanthanides and Actinides
 
Accessible design: Minimum effort, maximum impact
Accessible design: Minimum effort, maximum impactAccessible design: Minimum effort, maximum impact
Accessible design: Minimum effort, maximum impact
 
How to Make a Pirate ship Primary Education.pptx
How to Make a Pirate ship Primary Education.pptxHow to Make a Pirate ship Primary Education.pptx
How to Make a Pirate ship Primary Education.pptx
 
Kisan Call Centre - To harness potential of ICT in Agriculture by answer farm...
Kisan Call Centre - To harness potential of ICT in Agriculture by answer farm...Kisan Call Centre - To harness potential of ICT in Agriculture by answer farm...
Kisan Call Centre - To harness potential of ICT in Agriculture by answer farm...
 
POINT- BIOCHEMISTRY SEM 2 ENZYMES UNIT 5.pptx
POINT- BIOCHEMISTRY SEM 2 ENZYMES UNIT 5.pptxPOINT- BIOCHEMISTRY SEM 2 ENZYMES UNIT 5.pptx
POINT- BIOCHEMISTRY SEM 2 ENZYMES UNIT 5.pptx
 
Science 7 - LAND and SEA BREEZE and its Characteristics
Science 7 - LAND and SEA BREEZE and its CharacteristicsScience 7 - LAND and SEA BREEZE and its Characteristics
Science 7 - LAND and SEA BREEZE and its Characteristics
 
Alper Gobel In Media Res Media Component
Alper Gobel In Media Res Media ComponentAlper Gobel In Media Res Media Component
Alper Gobel In Media Res Media Component
 
Incoming and Outgoing Shipments in 1 STEP Using Odoo 17
Incoming and Outgoing Shipments in 1 STEP Using Odoo 17Incoming and Outgoing Shipments in 1 STEP Using Odoo 17
Incoming and Outgoing Shipments in 1 STEP Using Odoo 17
 
Solving Puzzles Benefits Everyone (English).pptx
Solving Puzzles Benefits Everyone (English).pptxSolving Puzzles Benefits Everyone (English).pptx
Solving Puzzles Benefits Everyone (English).pptx
 
“Oh GOSH! Reflecting on Hackteria's Collaborative Practices in a Global Do-It...
“Oh GOSH! Reflecting on Hackteria's Collaborative Practices in a Global Do-It...“Oh GOSH! Reflecting on Hackteria's Collaborative Practices in a Global Do-It...
“Oh GOSH! Reflecting on Hackteria's Collaborative Practices in a Global Do-It...
 
Paris 2024 Olympic Geographies - an activity
Paris 2024 Olympic Geographies - an activityParis 2024 Olympic Geographies - an activity
Paris 2024 Olympic Geographies - an activity
 
mini mental status format.docx
mini    mental       status     format.docxmini    mental       status     format.docx
mini mental status format.docx
 
The basics of sentences session 2pptx copy.pptx
The basics of sentences session 2pptx copy.pptxThe basics of sentences session 2pptx copy.pptx
The basics of sentences session 2pptx copy.pptx
 
A Critique of the Proposed National Education Policy Reform
A Critique of the Proposed National Education Policy ReformA Critique of the Proposed National Education Policy Reform
A Critique of the Proposed National Education Policy Reform
 
Mastering the Unannounced Regulatory Inspection
Mastering the Unannounced Regulatory InspectionMastering the Unannounced Regulatory Inspection
Mastering the Unannounced Regulatory Inspection
 

Chap4 measure of dispersion and skewness

  • 1. Jamri AB Chapter 4 : Measure of Dispersion and Skewness (EPjj) 1 CHAPTER 4 : MEASURE OF DISPERSION AND SKEWNESS 4.1 VARIANCE (S2) AND STANDARD DEVIATION (S) a) Ungrouped data Variance, S2 = b) Grouped data Variance, S2 = 4.2 COEFFICIENT OF VARIATION (CV)  Sometimes we may need to compare the variability of two different data sets that have different units of measurement, the CV is one such measure.  CV expresses standard deviation as a percentage of the mean and is computed as follows: CV = Example 1: The following table represents the length of life (in seconds) of 20 mosquitoes subjected to a new spray of ABC’s brand in a laboratory experiment. Length of life (in seconds) Number of mosquitoes 10 and less than 15 6 15 and less than 20 9 20 and less than 25 3 25 and less than 30 2 a) Calculate the mean and the standard deviation. b) The mean and the standard deviation for the length of life of mosquitoes using XYZ’s brand are 17.1 seconds and 5.5 seconds respectively. By using a suitable calculation determine which distribution is more consistent. Solution : Length of life Number of mosquitoes 10 and less than 15 6 15 and less than 20 9 20 and less than 25 3 25 and less than 30 2
  • 2. Jamri AB Chapter 4 : Measure of Dispersion and Skewness (EPjj) 2 Mean Standard deviation CV (ABC) CV (XYZ) 4.3 SKEWNESS Skewed to the right (Positively Skewed Distributions) In this distribution, the long tail indicates the presence of extreme values at the positive end of the distribution. This pulls the mean to the right. In a positively skewed distribution, the mean is pulled in a positive direction. The frequency curve would be: Symmetrical Bell-Shaped Distribution, This type of distribution is known as ‘normal’ and an approximately normal distribution occurs when measuring quantities such as heights, examination marks and ext.
  • 3. Jamri AB Chapter 4 : Measure of Dispersion and Skewness (EPjj) 3 Skewed to the left (Negatively Skewed Distributions) In a negatively skewed distribution, the mean is pulled in a negative direction. The frequency curve would be: Mode < median & mean = skewed to the right Mode > median & mean = skewed to the left PEARSON’S COEFFICIENT OF SKEWNESS  We need to know two things to describe the ‘skewness’ of a distribution.  One is the direction of the skew, positive or negative, and the other is a measure of the degree of skewness, i.e. how far the distribution is pulled in one direction.  One measure of skewness is given by PEARSON’S COEFFICIENT OF SKEWNESS.  The formula for skewness is mean – mode or 3(mean – median) standard deviation standard deviation  Generally skewness can take any value between 3 and –3.
  • 4. Jamri AB Chapter 4 : Measure of Dispersion and Skewness (EPjj) 4 4.4 BOX PLOT The following data show the times (in seconds) between an order being placed and the food being received at a MacDonald’s drive-thru window. 166 83 158 101 200 70 255 129 121 135 i. Find the value of first quarter (Q 1 ), Median (Q 2 ) and third quarter (Q 3 ) ii. Construct a box plot for the data. iii. Comment on the skewness. Solution : 1 2 3 4 5 6 7 8 9 10 70 83 101 121 129 135 158 166 200 255 Lower quartile or first quartile , Q 1 => position = n + 1 = 4 Q 1 = Q 2 (median) => position = n + 1 = 2 Q 2 (median) = Upper quartile or third quartile Q 3 => position = 3(n + 1) = 4 Q 3 = Construct a box plot ______________________________________________________________________