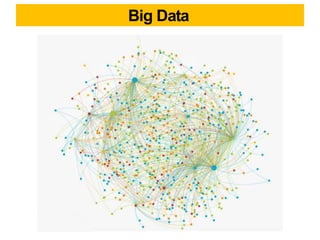
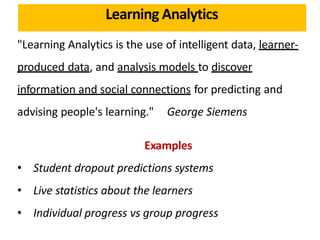
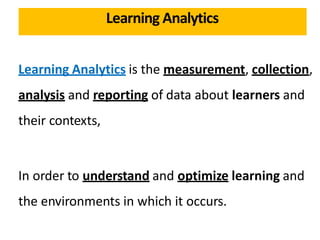
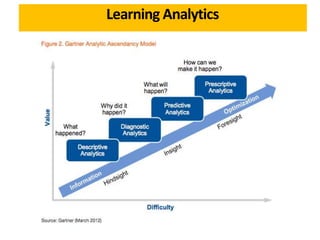
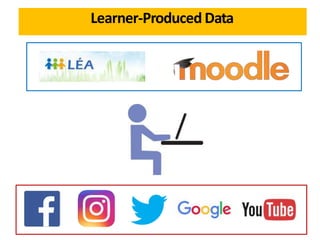
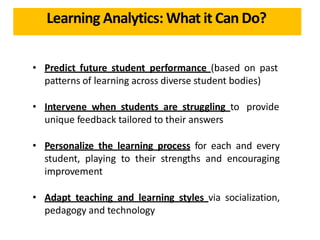
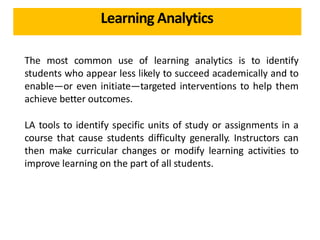
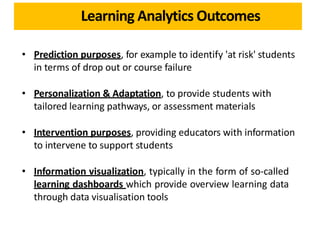
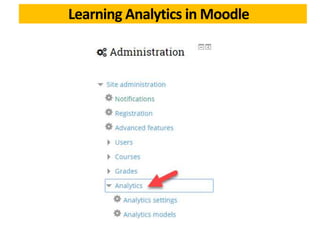
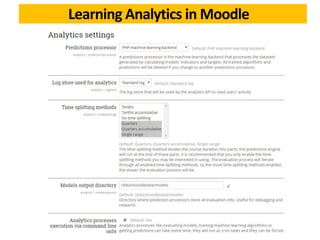
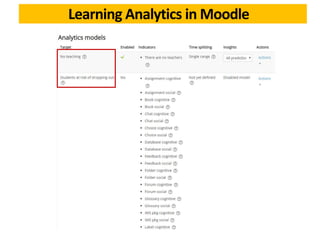
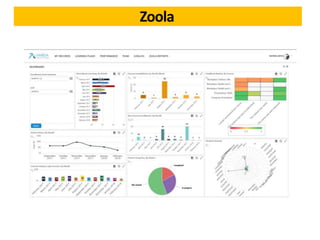
Rafael Scapin, Ph.D.
Coordinator of Educational Technology
Dawson College
Moodle Day 2019 May 24th, 2019
How to Use Learning Analytics
in Moodle
• What’s Learning Analytics?
• Why is it important?
• Using Learning Analytics in Moodle
• Questions
Content
• Learner interaction in Moodle leaves a lot of digital
traces behind.
• This huge amount of aggregate data that is
sourced from as many students as possible is
known as Big Data.
What is Learning Analytics?
• The measurement, collection, analysis and
reporting of data about learners and their
contexts, for purposes of discovering patterns,
understanding and optimizing learning and the
environments in which it occurs is known as
Learning Analytics.
What is Learning Analytics?
Big Data
Big Data
Diapers and Beer
https://youtu.be/RC5HNTj3Dag
Big Data
Data should be used to improve learning!
Big Data in Education
Big Data
"Learning Analytics is the use of intelligent data, learner-
produced data, and analysis models to discover
information and social connections for predicting and
advising people's learning." George Siemens
Examples
• Student dropout predictions systems
• Live statistics about the learners
• Individual progress vs group progress
Learning Analytics
Learning Analytics is the measurement, collection,
analysis and reporting of data about learners and
their contexts,
In order to understand and optimize learning and
the environments in which it occurs.
Learning Analytics
Learning Analytics
Moodle’s Database Schema
Source: https://docs.moodle.org/dev/Database_Schema
Moodle’s Database Schema
Source: https://docs.moodle.org/dev/Database_Schema
Moodle’s Database Schema
Source: https://docs.moodle.org/dev/Database_Schema
Learning Analytics
Source: https://library.educause.edu/-/media/files/library/2019/4/2019horizonreport.pdf
Horizon Report 2019
Learner-Produced Data
Learning Analytics: What it Can Do?
• Predict future student performance (based on past
patterns of learning across diverse student bodies)
• Intervene when students are struggling to provide
unique feedback tailored to their answers
• Personalize the learning process for each and every
student, playing to their strengths and encouraging
improvement
• Adapt teaching and learning styles via socialization,
pedagogy and technology
Learning Analytics
The most common use of learning analytics is to identify
students who appear less likely to succeed academically and to
enable—or even initiate—targeted interventions to help them
achieve better outcomes.
LA tools to identify specific units of study or assignments in a
course that cause students difficulty generally. Instructors can
then make curricular changes or modify learning activities to
improve learning on the part of all students.
Learning Analytics
Much of the data on which LA applications depend
comes from the learning management system (LMS),
including:
• log-in information
• rates of participation in specific activities
• time students spend interacting
resources or others in the class,
• grades
with online
Learning Analytics
Reports can take various forms, but most feature data
visualizations designed to facilitate quick understanding of
which students are likely to succeed.
Some systems proactively notify users; other systems require
users to take some action to access the reports.
System-generated interventions can range from a simple alert
about a student’s likelihood of success to requiring at-risk
students to take specific actions to address concerns.
Learning Analytics
What Learning Analytics Can’t Do?
Data from tracking systems is not inherently intelligent
Hit counts and access patternsdo not really explain
anything.
The intelligence is in the interpretation of the data
by a skilled analyst.
Ideally, data mining enables the visualization of
interesting data that in turn sparks the investigation of
apparent
Another thing analytics can not do by themselves is
improve instruction
While they can point to areas in need of improvement and
they can identify engaging practices, the numbers can not
make suggestion for improvements.
This requires a human intervention – usually in the form of
a focus group or by soliciting suggestions from the learners
themselves.
What Learning Analytics Can’t Do?
Learning Analytics Outcomes
• Prediction purposes, for example to identify 'at risk' students
in terms of drop out or course failure
• Personalization & Adaptation, to provide students with
tailored learning pathways, or assessment materials
• Intervention purposes, providing educators with information
to intervene to support students
• Information visualization, typically in the form of so-called
learning dashboards which provide overview learning data
through data visualisation tools
((})
•
Learning Analytics in Moodle
Learning Analytics in Moodle 3.7
https://www.youtube.com/watch?v=UHwfG6q9UsA
Analytics & Reports in Moodle
https://docs.moodle.org/36/en/Analytics
1. Moodle’s Native Learning Analytics Tool
(Inspire Analytics)
Beginning in version 3.4, Moodle core now implements open source,
transparent next-generation learning analytics using machine learning
backends that go beyond simple descriptive analytics to provide
predictions of learner success, and ultimately diagnosis and prescriptions
(advisements) to learners and teachers.
In Moodle 3.4, this system ships with two built-in models:
• Students at risk of dropping out
• No teaching activity
The system can be easily extended with new custom models, based on
reusable targets, indicators, and other components. For more
information, see the Analytics API developer documentation.
Learning Analytics in Moodle
https://youtu.be/Qyp0tIsC714
Intelliboard
https://intelliboard.net/
Intelliboard
https://youtu.be/LimkbhWFMS4
Intelliboard
Intelliboard
https://intelliboard.net/pricing
Zoola
https://www.zoola.io/
Zoola
https://youtu.be/XYBhEJEds8E
Zoola
Zoola
https://www.zoola.io/pricing/
Resources
Moodle Learning Analytics Work Group
https://moodle.org/course/view.php?id=17233#section-6
Moodle Learning Analytics FAQ
https://docs.moodle.org/37/en/Moodle_Learning_Analytics_FAQ
Contact
Rafael Scapin, Ph.D.
rscapin@dawsoncollege.qc.ca
http://dawsonite.dawsoncollege.qc.ca
How to Use Learning Analytics in Moodle

How to Use Learning Analytics in Moodle

  • 1.
    Rafael Scapin, Ph.D. Coordinatorof Educational Technology Dawson College Moodle Day 2019 May 24th, 2019 How to Use Learning Analytics in Moodle
  • 2.
    • What’s LearningAnalytics? • Why is it important? • Using Learning Analytics in Moodle • Questions Content
  • 3.
    • Learner interactionin Moodle leaves a lot of digital traces behind. • This huge amount of aggregate data that is sourced from as many students as possible is known as Big Data. What is Learning Analytics?
  • 4.
    • The measurement,collection, analysis and reporting of data about learners and their contexts, for purposes of discovering patterns, understanding and optimizing learning and the environments in which it occurs is known as Learning Analytics. What is Learning Analytics?
  • 5.
  • 6.
  • 7.
  • 8.
    Data should beused to improve learning! Big Data in Education
  • 9.
  • 10.
    "Learning Analytics isthe use of intelligent data, learner- produced data, and analysis models to discover information and social connections for predicting and advising people's learning." George Siemens Examples • Student dropout predictions systems • Live statistics about the learners • Individual progress vs group progress Learning Analytics
  • 11.
    Learning Analytics isthe measurement, collection, analysis and reporting of data about learners and their contexts, In order to understand and optimize learning and the environments in which it occurs. Learning Analytics
  • 12.
  • 13.
    Moodle’s Database Schema Source:https://docs.moodle.org/dev/Database_Schema
  • 14.
    Moodle’s Database Schema Source:https://docs.moodle.org/dev/Database_Schema
  • 15.
    Moodle’s Database Schema Source:https://docs.moodle.org/dev/Database_Schema
  • 16.
  • 17.
  • 18.
    Learning Analytics: Whatit Can Do? • Predict future student performance (based on past patterns of learning across diverse student bodies) • Intervene when students are struggling to provide unique feedback tailored to their answers • Personalize the learning process for each and every student, playing to their strengths and encouraging improvement • Adapt teaching and learning styles via socialization, pedagogy and technology
  • 19.
    Learning Analytics The mostcommon use of learning analytics is to identify students who appear less likely to succeed academically and to enable—or even initiate—targeted interventions to help them achieve better outcomes. LA tools to identify specific units of study or assignments in a course that cause students difficulty generally. Instructors can then make curricular changes or modify learning activities to improve learning on the part of all students.
  • 20.
    Learning Analytics Much ofthe data on which LA applications depend comes from the learning management system (LMS), including: • log-in information • rates of participation in specific activities • time students spend interacting resources or others in the class, • grades with online
  • 21.
    Learning Analytics Reports cantake various forms, but most feature data visualizations designed to facilitate quick understanding of which students are likely to succeed. Some systems proactively notify users; other systems require users to take some action to access the reports. System-generated interventions can range from a simple alert about a student’s likelihood of success to requiring at-risk students to take specific actions to address concerns.
  • 22.
  • 23.
    What Learning AnalyticsCan’t Do? Data from tracking systems is not inherently intelligent Hit counts and access patternsdo not really explain anything. The intelligence is in the interpretation of the data by a skilled analyst. Ideally, data mining enables the visualization of interesting data that in turn sparks the investigation of apparent
  • 24.
    Another thing analyticscan not do by themselves is improve instruction While they can point to areas in need of improvement and they can identify engaging practices, the numbers can not make suggestion for improvements. This requires a human intervention – usually in the form of a focus group or by soliciting suggestions from the learners themselves. What Learning Analytics Can’t Do?
  • 25.
    Learning Analytics Outcomes •Prediction purposes, for example to identify 'at risk' students in terms of drop out or course failure • Personalization & Adaptation, to provide students with tailored learning pathways, or assessment materials • Intervention purposes, providing educators with information to intervene to support students • Information visualization, typically in the form of so-called learning dashboards which provide overview learning data through data visualisation tools
  • 26.
  • 27.
  • 28.
  • 29.
  • 30.
    Learning Analytics inMoodle 3.7 https://www.youtube.com/watch?v=UHwfG6q9UsA
  • 31.
    Analytics & Reportsin Moodle https://docs.moodle.org/36/en/Analytics 1. Moodle’s Native Learning Analytics Tool (Inspire Analytics) Beginning in version 3.4, Moodle core now implements open source, transparent next-generation learning analytics using machine learning backends that go beyond simple descriptive analytics to provide predictions of learner success, and ultimately diagnosis and prescriptions (advisements) to learners and teachers. In Moodle 3.4, this system ships with two built-in models: • Students at risk of dropping out • No teaching activity The system can be easily extended with new custom models, based on reusable targets, indicators, and other components. For more information, see the Analytics API developer documentation.
  • 32.
    Learning Analytics inMoodle https://youtu.be/Qyp0tIsC714
  • 33.
  • 34.
  • 35.
  • 36.
  • 37.
  • 38.
  • 39.
  • 40.
  • 41.
    Resources Moodle Learning AnalyticsWork Group https://moodle.org/course/view.php?id=17233#section-6 Moodle Learning Analytics FAQ https://docs.moodle.org/37/en/Moodle_Learning_Analytics_FAQ
  • 43.