CA Regional Home Sales and Prices: Aug 2013
•
0 likes•278 views

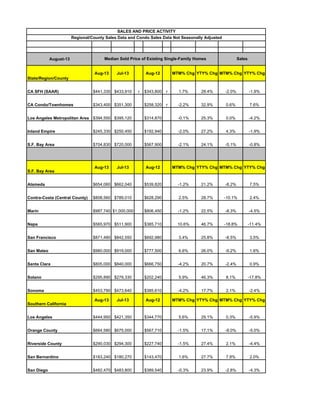
The document provides sales data and median home prices for California regions and counties in August 2013. Some key findings include: - The statewide median price for existing single-family homes was $441,330, up 1.7% from July but down 28.4% from August 2012. The Bay Area saw the largest year-over-year increase at 24.1%. - Within the Bay Area, Contra Costa and San Mateo counties had the highest median prices in August at over $800,000, while Solano and Santa Clara counties were under $805,000. - For Southern California regions, Los Angeles county had the highest median price at $444,950, up 5.6% from

Recommended
Recommended
More Related Content
What's hot
What's hot (20)
Viewers also liked
Viewers also liked (20)
Similar to CA Regional Home Sales and Prices: Aug 2013
Similar to CA Regional Home Sales and Prices: Aug 2013 (20)
More from Ronny Budiutama
More from Ronny Budiutama (20)
Recently uploaded
Recently uploaded (20)
CA Regional Home Sales and Prices: Aug 2013
- 1. SALES AND PRICE ACTIVITY Regional/County Sales Data and Condo Sales Data Not Seasonally Adjusted August-13 Median Sold Price of Existing Single-Family Homes Aug-13 Jul-13 Aug-12 Sales MTM% Chg YTY% Chg MTM% Chg YTY% Chg State/Region/County CA SFH (SAAR) $441,330 $433,910 CA Condo/Townhomes $343,800 r 1.7% 28.4% -2.0% -1.9% $343,400 $351,300 $258,320 r -2.2% 32.9% 0.6% 7.6% Los Angeles Metropolitan Area $394,550 $395,120 $314,870 -0.1% 25.3% 0.0% -4.2% Inland Empire $245,330 $250,450 $192,940 -2.0% 27.2% 4.3% -1.9% S.F. Bay Area $704,830 $720,000 $567,900 -2.1% 24.1% -5.1% -0.8% S.F. Bay Area Aug-13 Jul-13 r Aug-12 MTM% Chg YTY% Chg MTM% Chg YTY% Chg Alameda $654,060 $662,040 $539,820 -1.2% 21.2% -8.2% 7.5% Contra-Costa (Central County) $808,560 $789,010 $628,290 2.5% 28.7% -10.1% 2.4% Marin $987,740 $1,000,000 $806,450 -1.2% 22.5% -8.3% -4.5% Napa $565,970 $511,900 $385,710 10.6% 46.7% -18.8% -11.4% San Francisco $871,480 $842,550 $692,980 3.4% 25.8% -8.5% 3.5% San Mateo $980,000 $919,000 $777,500 6.6% 26.0% -9.2% 1.6% Santa Clara $805,000 $840,000 $666,750 -4.2% 20.7% -2.4% 0.9% Solano $295,890 $279,330 $202,240 5.9% 46.3% 8.1% -17.8% Sonoma $453,790 $473,640 $385,610 -4.2% 17.7% 2.1% -2.4% Southern California Aug-13 Jul-13 Aug-12 MTM% Chg YTY% Chg MTM% Chg YTY% Chg Los Angeles $444,950 $421,350 $344,770 5.6% 29.1% 0.3% -5.9% Orange County $664,580 $675,000 $567,710 -1.5% 17.1% -8.0% -5.0% Riverside County $290,030 $294,300 $227,740 -1.5% 27.4% 2.1% -4.4% San Bernardino $183,240 $180,270 $143,470 1.6% 27.7% 7.8% 2.0% San Diego $482,470 $483,800 $389,540 -0.3% 23.9% -2.8% -4.3%
- 2. Ventura Central Coast $555,560 $545,720 Aug-13 $437,880 Jul-13 1.8% Aug-12 26.9% -0.8% -4.6% MTM% Chg YTY% Chg MTM% Chg YTY% Chg Monterey $407,000 $408,800 $317,500 -0.4% 28.2% -8.4% -3.4% San Luis Obispo $477,420 $491,790 $386,180 -2.9% 23.6% -10.5% 0.4% Santa Barbara $625,000 $598,680 $533,330 4.4% 17.2% 2.1% 1.2% Santa Cruz $629,000 $601,000 $540,000 4.7% 16.5% -3.9% -2.5% Central Valley Aug-13 Jul-13 r Aug-12 MTM% Chg YTY% Chg MTM% Chg YTY% Chg Fresno $184,000 $183,870 $151,110 0.1% 21.8% -4.5% -6.0% Glenn $135,000 $140,000 $160,000 -3.6% -15.6% 0.0% 28.6% Kern (Bakersfield) $200,000 $195,000 $155,000 2.6% 29.0% -4.2% -9.6% Kings County $184,000 $173,330 $153,330 6.2% 20.0% 26.5% -10.4% Madera $170,000 $175,710 $127,500 -3.2% 33.3% -5.1% 0.0% Merced $155,880 $163,080 $123,330 -4.4% 26.4% -7.8% -16.4% Placer County $361,830 $372,220 $288,030 -2.8% 25.6% -15.2% -9.0% Sacramento $257,660 $254,550 $184,000 1.2% 40.0% -1.4% -8.5% San Benito $387,000 $400,000 $335,000 -3.3% 15.5% 0.0% 6.4% San Joaquin $231,390 $225,000 $168,120 2.8% 37.6% -2.0% -19.6% Stanislaus $203,120 $193,920 $147,850 4.7% 37.4% 7.3% -7.4% Tulare $158,460 $157,140 $133,560 0.8% 18.6% -10.8% -31.2% Other Counties in California Aug-13 Jul-13 Amador $213,890 $196,670 Butte County Aug-12 r r r MTM% Chg YTY% Chg MTM% Chg YTY% Chg $175,000 8.8% 22.2% 30.8% -19.0% $281,820 $239,280 $226,090 17.8% 24.6% -23.9% -3.1% Calaveras $220,000 $227,000 NA -3.1% NA 0.0% NA Del Norte $100,000 $155,000 NA -35.5% NA -21.1% NA El Dorado County $355,840 $350,760 $268,380 1.4% 32.6% 2.9% -6.2% Humboldt $247,220 $267,050 $218,750 -7.4% 13.0% -1.7% 22.8%
- 3. Lake County $153,330 $141,430 $125,560 8.4% 22.1% 14.3% 23.9% Tuolumne $215,280 $212,500 $204,690 1.3% 5.2% -6.4% -2.7% Mendocino $276,670 $286,360 $206,250 -3.4% 34.1% 17.2% 41.7% Shasta $203,650 $201,350 $165,480 1.1% 23.1% 16.1% 15.5% Siskiyou County $140,000 $140,000 $127,270 0.0% 10.0% 9.5% -4.2% Sutter $202,000 $212,500 NA -4.9% NA 38.9% NA Tehama $146,670 $185,000 $89,170 -20.7% 64.5% -12.8% -27.7% Yolo $320,310 $346,250 $264,580 -7.5% 21.1% -7.2% -4.3% Yuba $186,000 $170,500 NA 9.1% NA 18.2% NA Note: The County MLS median price and sales data in the table below are generated from a survey of more than 90 associations of REALTORS® throughout the state, and represent statistics of existing single-family detached homes only. County sales data are not adjusted to account for seasonal factors that can influence home sales. Movements in sales prices should not be interpreted as changes in the cost of a standard home. Median prices can be influenced by changes in cost, as well as changes in the characteristics and the size of homes sold. Due to the low sales volume in some areas, median price changes may exhibit unusual fluctuation. Los Angeles Metropolitan Area is a 5-county region that includes Los Angeles County, Orange County, Riverside County, San Bernardino Coun S.F. Bay Area has been redefined to include the following counties: Alameda, Contra Costa, Marin, Napa, San Francisco, San Mateo, Santa Cla Inland Empire includes Riverside County and San Bernardino County Note: "r" = revised Scheduled Date for Press Release: Sept 16, 2013
- 6. ty, and Ventura County ara, Solano, and Sonoma