Download to read offline

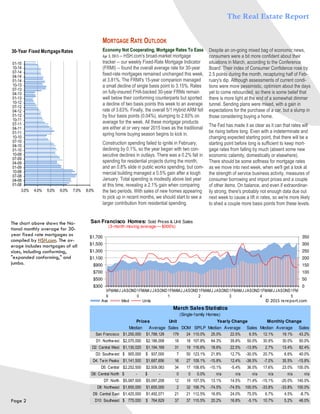
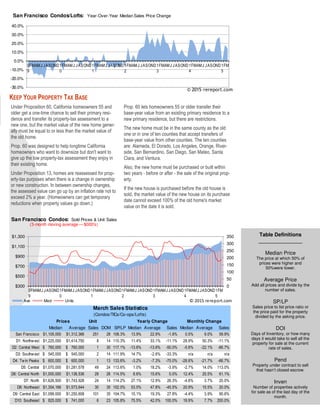

- Home sales in San Francisco jumped 6.5% in March compared to the previous year, while condo sales were down slightly by 1.6%. - Median home prices rose 25% and average prices increased 22.5% in March compared to the previous year, setting new all-time highs. Condo median prices rose 13.9% year-over-year. - Mortgage rates are expected to remain low in the coming weeks as recent economic data has been mixed, though rates will likely begin rising later in the year as signaled by the Federal Reserve.


