SlideShare a Scribd company logo
1 of 4
Download to read offline
ECONOMIC
SNAPSHOT
EMPLOYMENT
Bay Area Unemployment Rates
County Dec-12 Nov-12 Dec-11
Alameda 8.2% 8.5% 9.3%
Contra Costa 8.2% 8.4% 9.3%
Marin 5.5% 5.8% 6.4%
Napa 7.9% 7.5% 8.8%
San Francisco 6.5% 6.7% 7.7%
Santa Clara 7.5% 7.7% 8.6%
Solano 9.3% 9.3% 10.4%
Sonoma 7.7% 7.7% 9.0%
Source: CA-EDD
A SUMMARY OF SONOMA COUNTY’S ECONOMY
HIGHLIGHTS
 In April 2013 the Sonoma County
unemployment rate dropped to
6.5%, according to the California
Employment Development
Department. This is the lowest
unemployment has been in the past
5 years.
 Between 2000 and 2011, the median
household income in Sonoma
County grew by 16.9% to $64,031.
Looking into 2016, this growth is
expected to continue with median
income rising to $76,440, an
increase of 16.2% from 2011.
 Almost half (48.6%) of Sonoma
County’s employed population is in
the services sector, with the second
largest sector being retail trade
(11.5%).

401 College Ave, Suite D
Santa Rosa, CA 95401-5148
707.565.7170 office • 707.565.7231 fax
www.sonomaedb.org
SONOMA COUNTY ECONOMIC
DEVELOPMENT BOARD
JULY 2013
Sonoma County is experiencing
continued job growth. As shown in
the graph below; employment growth
last year was higher than the U.S.
average, and higher than many other
regions, including the Bay Area.
Source: UCLA Anderson Forecast
Sonoma County follows
closely behind North
Dakota, the fastest-
growing state in the U.S.,
for nonfarm job growth
as shown on the right.
Sonoma County also
incurred a 4.9%
employment increase
from November 2011 to
November 2012. This
increase is higher than
that of neighboring
counties such as Marin
and is also higher than
the state average.
Employment
Development
Department
Source: UCLA Anderson Forecast
All data is subject to the most recent information available as of July 2013
RESIDENTIAL REAL ESTATE
Single-Family Home Sales: January 1 - March 31, 2013 Change from 2012 – 2013
Average Sale
Price
Median Sale
Price
Unit
Sales
Days on
Market
Average
Sale Price
Median
Sale Price
Unit
Sales
Sonoma
County
$459,315 $380,000 961 95 16% 20% 16%
Santa Rosa $411,272 $356,500 392 83 21% 21% -20%
Petaluma $480,227 $422,408 132 79 23% 24% -22%
Sonoma $581,305 $425,000 75 101 -5% -3% -15%
Cotati,
Rohnert Park
$370,322 $357,000 67 61 23% 20% -22%
Windsor $367,573 $360,000 63 94 11% 12% -21%
Sebastopol $614,196 $514,000 48 102 39% 30% 14%
Cloverdale $360,864 $315,000 45 91 53% 37% 10%
Healdsburg $767,220 $500,000 37 122 6% 29% -10%
Guerneville $253,276 $249,000 18 117 26% 24% -31%
Bodega Bay $514,125 $504,500 8 191 -26% -28% -47%
Source: BAREIS MLS (Single-family homes sold January 1 - March 31, 2013 &2012)
Commercial Real Estate information provided by Keegan & Coppin-ONCOR International
The Sonoma County Economic Development Board (EDB) believes all data contained within this report to be accurate and the most current
available, but does not guarantee its accuracy or completeness. Use of data from an outside source does not represent an endorsement of any
product or service by the EDB, its members or affiliates.
“In Sonoma County, almost all the recession is over with,”
- Jerry Nickelsburg, Ph.D., senior economist of UCLA’s Anderson School
of Management
COMMERICAL REAL ESTATE
 Retail vacancy rates in Sonoma County
have continued to decline since their peak
in 2009 of 9.2%. In the second quarter of
2012, retail vacancy rates for Sonoma
County were 5.6%.
 Office vacancy rates are currently
fluctuating around 23%.
 Industrial vacancy rates have fallen to
12.3% since their peak of 15.6% in first
quarter 2010
JULY 2013
Sonoma County Economic Snapshot
All data is subject to the most recent information available as of July 2013
TOURISM
The long-term outlook for Sonoma County’s tourism industry
remains positive. The region is growing in recognition as a premier
tourist destination, and its proximity to Bay Area attractions and
airports will continue to support growth.
Compared to the national average, Sonoma County residents
spend considerably more per capita on travel, housing, and
entertainment. They spend 13% less on apparel and services. The
largest consumer expenditures were on housing, transportation, and
food.000
Leisure and hospitality will be among Sonoma County’s
largest drivers, but some risks to labor market improvements exist,
which will weigh on local demand for hospitality services. An uptick in
visitors and stronger pricing power has allowed hotels and other
hospitality industries to increase payrolls. However, another year of
reduced spending by local governments, on K-12 education in
particular, has resulted in layoffs and other cuts. Tech manufacturers
have also slowed hiring. As a result, workers in these industries will be
less likely to increase their spending on restaurants.
Source: California Board of Equalization (www.boe.ca.gov)
HIGHLIGHTS &
DEVELOPMENT
 $53.8million expansion project of
Charles M. Schulz-Sonoma
County Airport expected to begin
in August 2013. This expansion
will allow more flights to come
into Sonoma County’s airport,
expectedly increasing tourism.
 Travel and Leisure Magazine
named Healdsburg Plaza one of
the “Most Beautiful Town
Squares in the US.”
 Hotel Occupancy was up 11.4%
in 201
 In 2012 visitor-generated taxes
made up $168 per household,
while tourism- related
employment accounted for almost
17,000 jobs in Sonoma County
(almost 1 in 10 jobs
 According to a 2011 study by the
American Booksellers
Association, Sonoma County is
ranked 14th in the United States
based on the health of its
independent retail sector, this
study was conducted out of 363
metropolitan areas.
Sonoma County Tourism
Visit California
“Sonoma County has long been an attractive destination for visitors… We
certainly are anticipating that the county will continue the upward trend in
TOT revenues that we have enjoyed over the past few years.”
- Tim McGregor, board chairman of Sonoma County Tourism.
FOR MORE INFORMATION ABOUT SONOMA COUNTY TOURISM & UPCOMING EVENTS
PLEASE VISIT WWW.SONOMACOUNTY.COM
JULY 2013
Sonoma County Economic Snapshot
All data is subject to the most recent information available as of July 2013
The Economic
Development Board’s
Purchasing Trends
Index shows this to be
the second year that
Sonoma County has
scored higher than the
United States Index,
since 2007. This
quarter’s index score of
70 indicates that
businesses feel less
economically
challenged operating in
Sonoma County than in
the US as a whole.
Sonoma County Economic Snapshot
JULY 2013
“We really are a county of small businesses, almost micro businesses…”
- Ben Stone, executive director
Sonoma County Economic Development Board
This graph depicts a Business
Confidence index, by the Economic
Development Board, with information
from Sonoma County’s local business
leaders.
401 College Ave, Suite D
Santa Rosa, CA 95401-5148
707.565.7170 office • 707.565.7231 fax
www.sonomaedb.org
All data is subject to the most recent information available as of July 2013
 Sonoma County has almost 18,000 businesses, most of which are
small in scale. Nine out of 10 companies in Sonoma County employ
fewer than 20 workers, according to a 2011 survey by the state
Employment Development Department.
 According to the EDB’s study of the Sonoma County Economy,
prepared by Moody’s Analytics; Technology and Tourism are
expected to lead the county in growth in 2013. Technology, led by the
many medical device manufacturers in Sonoma County, and wine and
tourism are strengthening at a rate faster than the national average.
 A trend that remains consistent into 2016 is the shrinking percentage
of households earning less than $35,000. The proportion of the county
in this range will decrease by 4.5 percentage points by 2016. This
trend, coupled with the increasing proportion of the county earning
over $100,000, will result in further concentration of households in
higher-income tiers.
QUICK FACTS

More Related Content

What's hot

La Jolla – Neighborhood Report (05.15)
La Jolla – Neighborhood Report (05.15)La Jolla – Neighborhood Report (05.15)
La Jolla – Neighborhood Report (05.15)Phillip J. Blanks
 
California Home Prices for Each Counties August 2013
California Home Prices for Each Counties August 2013California Home Prices for Each Counties August 2013
California Home Prices for Each Counties August 2013Ronny Budiutama
 
2018 Oregon Wine Symposium | State of The Industry - Danny Brager
2018 Oregon Wine Symposium | State of The Industry - Danny Brager2018 Oregon Wine Symposium | State of The Industry - Danny Brager
2018 Oregon Wine Symposium | State of The Industry - Danny BragerOregon Wine Board
 
2018 Oregon Wine Symposium | State of The Industry - Rob McMillan
2018 Oregon Wine Symposium | State of The Industry - Rob McMillan2018 Oregon Wine Symposium | State of The Industry - Rob McMillan
2018 Oregon Wine Symposium | State of The Industry - Rob McMillanOregon Wine Board
 
Coldwell Banker Commercial Market Comparison Report Ranks Denver as Top Comme...
Coldwell Banker Commercial Market Comparison Report Ranks Denver as Top Comme...Coldwell Banker Commercial Market Comparison Report Ranks Denver as Top Comme...
Coldwell Banker Commercial Market Comparison Report Ranks Denver as Top Comme...Coldwell Banker Commercial
 
Sacramento Real Estate Report for 2013
Sacramento Real Estate Report for 2013Sacramento Real Estate Report for 2013
Sacramento Real Estate Report for 2013Ryan Lundquist
 
Metro Area Unemployment Data: June 2011
Metro Area Unemployment Data: June 2011Metro Area Unemployment Data: June 2011
Metro Area Unemployment Data: June 2011REALTORS
 
Orange county, CA Real Estate Market Report: November 2013
Orange county, CA Real Estate Market Report: November 2013Orange county, CA Real Estate Market Report: November 2013
Orange county, CA Real Estate Market Report: November 2013First Team Real Estate
 
#1 Adam Why Minneapolis St Paul[1]
#1 Adam Why Minneapolis St Paul[1]#1 Adam Why Minneapolis St Paul[1]
#1 Adam Why Minneapolis St Paul[1]adamboroughs
 
San Diego Illustrated: 2015 Edition
San Diego Illustrated: 2015 EditionSan Diego Illustrated: 2015 Edition
San Diego Illustrated: 2015 EditionTax Foundation
 
COLI june snapshot 2016
COLI june snapshot 2016COLI june snapshot 2016
COLI june snapshot 2016ARCResearch
 
Loma Portal – Neighborhood Report (05.15)
Loma Portal – Neighborhood Report (05.15)Loma Portal – Neighborhood Report (05.15)
Loma Portal – Neighborhood Report (05.15)Phillip J. Blanks
 
Golden Hill – Neighborhood Report (05.15)
Golden Hill – Neighborhood Report (05.15)Golden Hill – Neighborhood Report (05.15)
Golden Hill – Neighborhood Report (05.15)Phillip J. Blanks
 
Encanto – Neighborhood Report (05.15)
Encanto – Neighborhood Report (05.15)Encanto – Neighborhood Report (05.15)
Encanto – Neighborhood Report (05.15)Phillip J. Blanks
 
Old Town – Neighborhood Report (05.15)
Old Town – Neighborhood Report (05.15)Old Town – Neighborhood Report (05.15)
Old Town – Neighborhood Report (05.15)Phillip J. Blanks
 

What's hot (19)

La Jolla – Neighborhood Report (05.15)
La Jolla – Neighborhood Report (05.15)La Jolla – Neighborhood Report (05.15)
La Jolla – Neighborhood Report (05.15)
 
California Home Prices for Each Counties August 2013
California Home Prices for Each Counties August 2013California Home Prices for Each Counties August 2013
California Home Prices for Each Counties August 2013
 
2018 Oregon Wine Symposium | State of The Industry - Danny Brager
2018 Oregon Wine Symposium | State of The Industry - Danny Brager2018 Oregon Wine Symposium | State of The Industry - Danny Brager
2018 Oregon Wine Symposium | State of The Industry - Danny Brager
 
2018 Oregon Wine Symposium | State of The Industry - Rob McMillan
2018 Oregon Wine Symposium | State of The Industry - Rob McMillan2018 Oregon Wine Symposium | State of The Industry - Rob McMillan
2018 Oregon Wine Symposium | State of The Industry - Rob McMillan
 
Coldwell Banker Commercial Market Comparison Report Ranks Denver as Top Comme...
Coldwell Banker Commercial Market Comparison Report Ranks Denver as Top Comme...Coldwell Banker Commercial Market Comparison Report Ranks Denver as Top Comme...
Coldwell Banker Commercial Market Comparison Report Ranks Denver as Top Comme...
 
CBC 2014 Blue Book
CBC 2014 Blue BookCBC 2014 Blue Book
CBC 2014 Blue Book
 
Sacramento Real Estate Report for 2013
Sacramento Real Estate Report for 2013Sacramento Real Estate Report for 2013
Sacramento Real Estate Report for 2013
 
Metro Area Unemployment Data: June 2011
Metro Area Unemployment Data: June 2011Metro Area Unemployment Data: June 2011
Metro Area Unemployment Data: June 2011
 
Orange county, CA Real Estate Market Report: November 2013
Orange county, CA Real Estate Market Report: November 2013Orange county, CA Real Estate Market Report: November 2013
Orange county, CA Real Estate Market Report: November 2013
 
#1 Adam Why Minneapolis St Paul[1]
#1 Adam Why Minneapolis St Paul[1]#1 Adam Why Minneapolis St Paul[1]
#1 Adam Why Minneapolis St Paul[1]
 
San Diego Illustrated: 2015 Edition
San Diego Illustrated: 2015 EditionSan Diego Illustrated: 2015 Edition
San Diego Illustrated: 2015 Edition
 
1 11 league of cities
1 11 league of cities1 11 league of cities
1 11 league of cities
 
Real Estate Forecast Case-Shiller index
Real Estate Forecast Case-Shiller indexReal Estate Forecast Case-Shiller index
Real Estate Forecast Case-Shiller index
 
COLI june snapshot 2016
COLI june snapshot 2016COLI june snapshot 2016
COLI june snapshot 2016
 
Loma Portal – Neighborhood Report (05.15)
Loma Portal – Neighborhood Report (05.15)Loma Portal – Neighborhood Report (05.15)
Loma Portal – Neighborhood Report (05.15)
 
Golden Hill – Neighborhood Report (05.15)
Golden Hill – Neighborhood Report (05.15)Golden Hill – Neighborhood Report (05.15)
Golden Hill – Neighborhood Report (05.15)
 
Encanto – Neighborhood Report (05.15)
Encanto – Neighborhood Report (05.15)Encanto – Neighborhood Report (05.15)
Encanto – Neighborhood Report (05.15)
 
Palm springs, ca
Palm springs, caPalm springs, ca
Palm springs, ca
 
Old Town – Neighborhood Report (05.15)
Old Town – Neighborhood Report (05.15)Old Town – Neighborhood Report (05.15)
Old Town – Neighborhood Report (05.15)
 

Similar to SC Economic Update

Quarterly Economic Update | Q4 2013
Quarterly Economic Update | Q4 2013Quarterly Economic Update | Q4 2013
Quarterly Economic Update | Q4 2013One Columbus
 
1-866-275-3266[email protected]ANALYSISVITALITYRELATIV.docx
1-866-275-3266[email protected]ANALYSISVITALITYRELATIV.docx1-866-275-3266[email protected]ANALYSISVITALITYRELATIV.docx
1-866-275-3266[email protected]ANALYSISVITALITYRELATIV.docxdorishigh
 
1-866-275-3266[email protected]ANALYSISVITALITYRELATIV.docx
1-866-275-3266[email protected]ANALYSISVITALITYRELATIV.docx1-866-275-3266[email protected]ANALYSISVITALITYRELATIV.docx
1-866-275-3266[email protected]ANALYSISVITALITYRELATIV.docxteresehearn
 
Seattle Tacoma Demographic and Economic Snapshot
Seattle Tacoma Demographic and Economic SnapshotSeattle Tacoma Demographic and Economic Snapshot
Seattle Tacoma Demographic and Economic Snapshotjeffpinkerton
 
Quarterly Economic Update | Q2 2014
Quarterly Economic Update | Q2 2014Quarterly Economic Update | Q2 2014
Quarterly Economic Update | Q2 2014One Columbus
 
Williamson County, Texas: Changing Demographics and Implications of Growth
Williamson County, Texas: Changing Demographics and Implications of GrowthWilliamson County, Texas: Changing Demographics and Implications of Growth
Williamson County, Texas: Changing Demographics and Implications of GrowthCivic Analytics LLC
 
Housing Market Forecast from C.A.R. July 10, 2014
Housing Market Forecast from C.A.R. July 10, 2014Housing Market Forecast from C.A.R. July 10, 2014
Housing Market Forecast from C.A.R. July 10, 2014Timothy Shih
 
State of Recession in Rural NC
State of Recession in Rural NCState of Recession in Rural NC
State of Recession in Rural NCRV Rikard
 
Rhiza Ratio - Low Income by Gender
Rhiza Ratio - Low Income by GenderRhiza Ratio - Low Income by Gender
Rhiza Ratio - Low Income by GenderRhizaLabs
 
Ted Jones Economic Outlook 2018
Ted Jones Economic Outlook 2018Ted Jones Economic Outlook 2018
Ted Jones Economic Outlook 2018Terry Yonker
 
Ocean Beach – Neighborhood Report (05.15)
Ocean Beach – Neighborhood Report (05.15)Ocean Beach – Neighborhood Report (05.15)
Ocean Beach – Neighborhood Report (05.15)Phillip J. Blanks
 
Quarterly Economic Update | Q2 2013
Quarterly Economic Update | Q2 2013Quarterly Economic Update | Q2 2013
Quarterly Economic Update | Q2 2013One Columbus
 
Saratoga County Manufacturing Economic Index 4.17.19
Saratoga County Manufacturing Economic Index 4.17.19Saratoga County Manufacturing Economic Index 4.17.19
Saratoga County Manufacturing Economic Index 4.17.19JenniferKelley47
 
Miramar – Neighborhood Report (05.15)
Miramar – Neighborhood Report (05.15)Miramar – Neighborhood Report (05.15)
Miramar – Neighborhood Report (05.15)Phillip J. Blanks
 
Clairemont Mesa (West) – Neighborhood Report (05.15)
Clairemont Mesa (West) – Neighborhood Report (05.15)Clairemont Mesa (West) – Neighborhood Report (05.15)
Clairemont Mesa (West) – Neighborhood Report (05.15)Phillip J. Blanks
 
Mining BEA Data to Break Local Stories by Jeannine Aversa and Thomas Dail (Te...
Mining BEA Data to Break Local Stories by Jeannine Aversa and Thomas Dail (Te...Mining BEA Data to Break Local Stories by Jeannine Aversa and Thomas Dail (Te...
Mining BEA Data to Break Local Stories by Jeannine Aversa and Thomas Dail (Te...Reynolds Center for Business Journalism
 
Saratoga Partnership Unveils Inaugural Hospitality & Tourism Index: Thriving ...
Saratoga Partnership Unveils Inaugural Hospitality & Tourism Index: Thriving ...Saratoga Partnership Unveils Inaugural Hospitality & Tourism Index: Thriving ...
Saratoga Partnership Unveils Inaugural Hospitality & Tourism Index: Thriving ...Shelby Schneider
 

Similar to SC Economic Update (20)

2013 Year End Commercial Real Estate Review
2013 Year End Commercial Real Estate Review2013 Year End Commercial Real Estate Review
2013 Year End Commercial Real Estate Review
 
Quarterly Economic Update | Q4 2013
Quarterly Economic Update | Q4 2013Quarterly Economic Update | Q4 2013
Quarterly Economic Update | Q4 2013
 
1-866-275-3266[email protected]ANALYSISVITALITYRELATIV.docx
1-866-275-3266[email protected]ANALYSISVITALITYRELATIV.docx1-866-275-3266[email protected]ANALYSISVITALITYRELATIV.docx
1-866-275-3266[email protected]ANALYSISVITALITYRELATIV.docx
 
1-866-275-3266[email protected]ANALYSISVITALITYRELATIV.docx
1-866-275-3266[email protected]ANALYSISVITALITYRELATIV.docx1-866-275-3266[email protected]ANALYSISVITALITYRELATIV.docx
1-866-275-3266[email protected]ANALYSISVITALITYRELATIV.docx
 
Seattle Tacoma Demographic and Economic Snapshot
Seattle Tacoma Demographic and Economic SnapshotSeattle Tacoma Demographic and Economic Snapshot
Seattle Tacoma Demographic and Economic Snapshot
 
Quarterly Economic Update | Q2 2014
Quarterly Economic Update | Q2 2014Quarterly Economic Update | Q2 2014
Quarterly Economic Update | Q2 2014
 
Williamson County, Texas: Changing Demographics and Implications of Growth
Williamson County, Texas: Changing Demographics and Implications of GrowthWilliamson County, Texas: Changing Demographics and Implications of Growth
Williamson County, Texas: Changing Demographics and Implications of Growth
 
Housing Market Forecast from C.A.R. July 10, 2014
Housing Market Forecast from C.A.R. July 10, 2014Housing Market Forecast from C.A.R. July 10, 2014
Housing Market Forecast from C.A.R. July 10, 2014
 
State of Recession in Rural NC
State of Recession in Rural NCState of Recession in Rural NC
State of Recession in Rural NC
 
Anirban Basu - Sage Policy Group - Presentation at MEDA 2019 Annual Conference
Anirban Basu - Sage Policy Group - Presentation at MEDA 2019 Annual ConferenceAnirban Basu - Sage Policy Group - Presentation at MEDA 2019 Annual Conference
Anirban Basu - Sage Policy Group - Presentation at MEDA 2019 Annual Conference
 
Rhiza Ratio - Low Income by Gender
Rhiza Ratio - Low Income by GenderRhiza Ratio - Low Income by Gender
Rhiza Ratio - Low Income by Gender
 
Ted Jones Economic Outlook 2018
Ted Jones Economic Outlook 2018Ted Jones Economic Outlook 2018
Ted Jones Economic Outlook 2018
 
Ocean Beach – Neighborhood Report (05.15)
Ocean Beach – Neighborhood Report (05.15)Ocean Beach – Neighborhood Report (05.15)
Ocean Beach – Neighborhood Report (05.15)
 
Quarterly Economic Update | Q2 2013
Quarterly Economic Update | Q2 2013Quarterly Economic Update | Q2 2013
Quarterly Economic Update | Q2 2013
 
Q2 2013 report
Q2 2013 reportQ2 2013 report
Q2 2013 report
 
Saratoga County Manufacturing Economic Index 4.17.19
Saratoga County Manufacturing Economic Index 4.17.19Saratoga County Manufacturing Economic Index 4.17.19
Saratoga County Manufacturing Economic Index 4.17.19
 
Miramar – Neighborhood Report (05.15)
Miramar – Neighborhood Report (05.15)Miramar – Neighborhood Report (05.15)
Miramar – Neighborhood Report (05.15)
 
Clairemont Mesa (West) – Neighborhood Report (05.15)
Clairemont Mesa (West) – Neighborhood Report (05.15)Clairemont Mesa (West) – Neighborhood Report (05.15)
Clairemont Mesa (West) – Neighborhood Report (05.15)
 
Mining BEA Data to Break Local Stories by Jeannine Aversa and Thomas Dail (Te...
Mining BEA Data to Break Local Stories by Jeannine Aversa and Thomas Dail (Te...Mining BEA Data to Break Local Stories by Jeannine Aversa and Thomas Dail (Te...
Mining BEA Data to Break Local Stories by Jeannine Aversa and Thomas Dail (Te...
 
Saratoga Partnership Unveils Inaugural Hospitality & Tourism Index: Thriving ...
Saratoga Partnership Unveils Inaugural Hospitality & Tourism Index: Thriving ...Saratoga Partnership Unveils Inaugural Hospitality & Tourism Index: Thriving ...
Saratoga Partnership Unveils Inaugural Hospitality & Tourism Index: Thriving ...
 

SC Economic Update

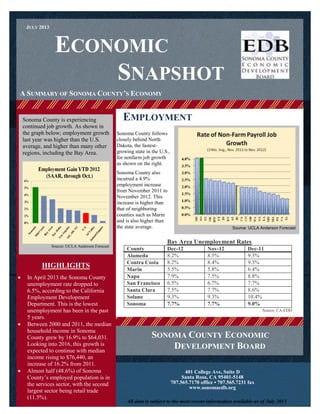
  • 1. ECONOMIC SNAPSHOT EMPLOYMENT Bay Area Unemployment Rates County Dec-12 Nov-12 Dec-11 Alameda 8.2% 8.5% 9.3% Contra Costa 8.2% 8.4% 9.3% Marin 5.5% 5.8% 6.4% Napa 7.9% 7.5% 8.8% San Francisco 6.5% 6.7% 7.7% Santa Clara 7.5% 7.7% 8.6% Solano 9.3% 9.3% 10.4% Sonoma 7.7% 7.7% 9.0% Source: CA-EDD A SUMMARY OF SONOMA COUNTY’S ECONOMY HIGHLIGHTS  In April 2013 the Sonoma County unemployment rate dropped to 6.5%, according to the California Employment Development Department. This is the lowest unemployment has been in the past 5 years.  Between 2000 and 2011, the median household income in Sonoma County grew by 16.9% to $64,031. Looking into 2016, this growth is expected to continue with median income rising to $76,440, an increase of 16.2% from 2011.  Almost half (48.6%) of Sonoma County’s employed population is in the services sector, with the second largest sector being retail trade (11.5%).  401 College Ave, Suite D Santa Rosa, CA 95401-5148 707.565.7170 office • 707.565.7231 fax www.sonomaedb.org SONOMA COUNTY ECONOMIC DEVELOPMENT BOARD JULY 2013 Sonoma County is experiencing continued job growth. As shown in the graph below; employment growth last year was higher than the U.S. average, and higher than many other regions, including the Bay Area. Source: UCLA Anderson Forecast Sonoma County follows closely behind North Dakota, the fastest- growing state in the U.S., for nonfarm job growth as shown on the right. Sonoma County also incurred a 4.9% employment increase from November 2011 to November 2012. This increase is higher than that of neighboring counties such as Marin and is also higher than the state average. Employment Development Department Source: UCLA Anderson Forecast All data is subject to the most recent information available as of July 2013
  • 2. RESIDENTIAL REAL ESTATE Single-Family Home Sales: January 1 - March 31, 2013 Change from 2012 – 2013 Average Sale Price Median Sale Price Unit Sales Days on Market Average Sale Price Median Sale Price Unit Sales Sonoma County $459,315 $380,000 961 95 16% 20% 16% Santa Rosa $411,272 $356,500 392 83 21% 21% -20% Petaluma $480,227 $422,408 132 79 23% 24% -22% Sonoma $581,305 $425,000 75 101 -5% -3% -15% Cotati, Rohnert Park $370,322 $357,000 67 61 23% 20% -22% Windsor $367,573 $360,000 63 94 11% 12% -21% Sebastopol $614,196 $514,000 48 102 39% 30% 14% Cloverdale $360,864 $315,000 45 91 53% 37% 10% Healdsburg $767,220 $500,000 37 122 6% 29% -10% Guerneville $253,276 $249,000 18 117 26% 24% -31% Bodega Bay $514,125 $504,500 8 191 -26% -28% -47% Source: BAREIS MLS (Single-family homes sold January 1 - March 31, 2013 &2012) Commercial Real Estate information provided by Keegan & Coppin-ONCOR International The Sonoma County Economic Development Board (EDB) believes all data contained within this report to be accurate and the most current available, but does not guarantee its accuracy or completeness. Use of data from an outside source does not represent an endorsement of any product or service by the EDB, its members or affiliates. “In Sonoma County, almost all the recession is over with,” - Jerry Nickelsburg, Ph.D., senior economist of UCLA’s Anderson School of Management COMMERICAL REAL ESTATE  Retail vacancy rates in Sonoma County have continued to decline since their peak in 2009 of 9.2%. In the second quarter of 2012, retail vacancy rates for Sonoma County were 5.6%.  Office vacancy rates are currently fluctuating around 23%.  Industrial vacancy rates have fallen to 12.3% since their peak of 15.6% in first quarter 2010 JULY 2013 Sonoma County Economic Snapshot All data is subject to the most recent information available as of July 2013
  • 3. TOURISM The long-term outlook for Sonoma County’s tourism industry remains positive. The region is growing in recognition as a premier tourist destination, and its proximity to Bay Area attractions and airports will continue to support growth. Compared to the national average, Sonoma County residents spend considerably more per capita on travel, housing, and entertainment. They spend 13% less on apparel and services. The largest consumer expenditures were on housing, transportation, and food.000 Leisure and hospitality will be among Sonoma County’s largest drivers, but some risks to labor market improvements exist, which will weigh on local demand for hospitality services. An uptick in visitors and stronger pricing power has allowed hotels and other hospitality industries to increase payrolls. However, another year of reduced spending by local governments, on K-12 education in particular, has resulted in layoffs and other cuts. Tech manufacturers have also slowed hiring. As a result, workers in these industries will be less likely to increase their spending on restaurants. Source: California Board of Equalization (www.boe.ca.gov) HIGHLIGHTS & DEVELOPMENT  $53.8million expansion project of Charles M. Schulz-Sonoma County Airport expected to begin in August 2013. This expansion will allow more flights to come into Sonoma County’s airport, expectedly increasing tourism.  Travel and Leisure Magazine named Healdsburg Plaza one of the “Most Beautiful Town Squares in the US.”  Hotel Occupancy was up 11.4% in 201  In 2012 visitor-generated taxes made up $168 per household, while tourism- related employment accounted for almost 17,000 jobs in Sonoma County (almost 1 in 10 jobs  According to a 2011 study by the American Booksellers Association, Sonoma County is ranked 14th in the United States based on the health of its independent retail sector, this study was conducted out of 363 metropolitan areas. Sonoma County Tourism Visit California “Sonoma County has long been an attractive destination for visitors… We certainly are anticipating that the county will continue the upward trend in TOT revenues that we have enjoyed over the past few years.” - Tim McGregor, board chairman of Sonoma County Tourism. FOR MORE INFORMATION ABOUT SONOMA COUNTY TOURISM & UPCOMING EVENTS PLEASE VISIT WWW.SONOMACOUNTY.COM JULY 2013 Sonoma County Economic Snapshot All data is subject to the most recent information available as of July 2013 The Economic Development Board’s Purchasing Trends Index shows this to be the second year that Sonoma County has scored higher than the United States Index, since 2007. This quarter’s index score of 70 indicates that businesses feel less economically challenged operating in Sonoma County than in the US as a whole.
  • 4. Sonoma County Economic Snapshot JULY 2013 “We really are a county of small businesses, almost micro businesses…” - Ben Stone, executive director Sonoma County Economic Development Board This graph depicts a Business Confidence index, by the Economic Development Board, with information from Sonoma County’s local business leaders. 401 College Ave, Suite D Santa Rosa, CA 95401-5148 707.565.7170 office • 707.565.7231 fax www.sonomaedb.org All data is subject to the most recent information available as of July 2013  Sonoma County has almost 18,000 businesses, most of which are small in scale. Nine out of 10 companies in Sonoma County employ fewer than 20 workers, according to a 2011 survey by the state Employment Development Department.  According to the EDB’s study of the Sonoma County Economy, prepared by Moody’s Analytics; Technology and Tourism are expected to lead the county in growth in 2013. Technology, led by the many medical device manufacturers in Sonoma County, and wine and tourism are strengthening at a rate faster than the national average.  A trend that remains consistent into 2016 is the shrinking percentage of households earning less than $35,000. The proportion of the county in this range will decrease by 4.5 percentage points by 2016. This trend, coupled with the increasing proportion of the county earning over $100,000, will result in further concentration of households in higher-income tiers. QUICK FACTS