Urban Transport
•
0 likes•97 views

Urban Transport Overview, Issues, Solutions, Traditional Approach

Recommended
Recommended
More Related Content
What's hot
What's hot (17)
Similar to Urban Transport
Similar to Urban Transport (20)
More from Rayala Spandana
Recently uploaded
Recently uploaded (20)
Urban Transport
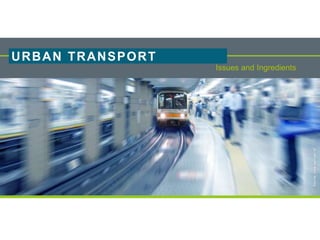
- 1. Urban Transport 28/01/2016 1 Issues and Ingredients URBAN TRANSPORT copyright Source: www.sampec.nl
- 2. Urban Transport 28/01/2016 2 URBAN TRANSPORT – TRADITIONAL THINKING Traffic Congestion- Go for Roads widening and expand parking facilities
- 3. Urban Transport 28/01/2016 3 CONGESTION PROBLEM SOLVED??? Congestion further exceeds
- 4. Urban Transport 28/01/2016 4 WHAT DO YOU FIND ON CITY ROADS?
- 5. Urban Transport 28/01/2016 5 WHAT DO YOU FIND ON CITY ROADS?
- 6. Urban Transport 28/01/2016 6 WHY PERSONALIZED VEHICLES ARE MORE?
- 7. Urban Transport 28/01/2016 7 WHY PERSONALIZED VEHICLES ARE MORE? Lack of facilities No option Time consuming Comfort level Lack of integration Absence of active transport choices Absence of side walks
- 8. Urban Transport 28/01/2016 8 EXCERPTS FROM A SURVEY “I have to travel between Basavanagudi and Agara every day for work. There aren’t direct buses to my office; I change three buses to get there and on my way back, I usually have to take an auto as one or the other connecting bus is never available. If I am not allowed to take my car, how do they expect me to get home,” questions T. Rashmi, a marketing professional from Bangalore.
- 9. Urban Transport 28/01/2016 9 EXCERPTS FROM A SURVEY Father Son Dad I need a bike for going to college Why you need bike? You can go in a bus.
- 10. Urban Transport 28/01/2016 10 EXCERPTS FROM A SURVEY Father Son Time waste and no time to study OH!!!!????? Purchase bike for him????
- 11. Urban Transport 28/01/2016 11 WHAT ARE WE DOING? Creating more space for cars by widening further
- 12. Urban Transport 28/01/2016 12 WHAT ARE WE DOING? Giving space for vehicles. Car- centric development. Where to walk?
- 13. Urban Transport 28/01/2016 13 WHERE IS THE PROBLEM? Design and Evaluation approach Egis Graphic
- 14. Urban Transport 28/01/2016 14 PRESENT APPROACH
- 15. Urban Transport 28/01/2016 15 FROM WHERE A TRIP STARTS?
- 16. Urban Transport 28/01/2016 16 Decision depends on the choices available INFLUENCING DECISIONS ABOUT TRAVEL Of India’s 360 million urban residents, nearly 150 million people live in urban slums. 150 million people won’t think of these. Opting available public transportation
- 17. Urban Transport 28/01/2016 17 Measures to retain the public transport users and to increase the percentage of people using sustainable transport users URGENT NEED OF PROVIDING SUSTAINABLE TRANSPORT INFRASTRUCTURE City Population (in millions) Mass Transport Bicycle Other modes 0.1–0.5 30–40 30–40 25–35 0.5–1.0 40–50 25–35 20–30 1.0–2.0 50–60 20–30 15–25 2.0–5.0 60–70 15–25 10–20 5.0+ 70–85 15–20 10–15 Desirable modal split for Indian cities (as percentage of total trips) Source: Ministry of Urban Development, Government of India, New Delhi. 1998. Traffic and Transportation Policies and Strategies in Urban Areas in India.
- 18. Urban Transport 28/01/2016 18 City Population (in millions) Walk Mass Transport IPT Car Two Wheeler Bicycle Fast Slow 0.10–0.25 37.1 16.4 10.4 20.1 3.3 24.1 25.7 0.25–0.50 37.8 20.6 8.9 17.2 2.6 29.8 20.9 0.50–1.0 30.7 25.4 8.2 12 9.5 29.1 15.9 1.0–2.0 29.6 30.6 6.4 8.1 3.3 39.6 12.1 2.0–5.0 28.7 42.3 4.9 3 5 28.9 15.9 5.0+ 28.4 62.8 3.3 3.7 6.1 14.8 9.4 NO RESPECT FOR SUSTAINABLE TRANSPORT USERS City Population (in millions) Walk Mass Transport IPT Car Two Wheeler Bicycle Fast Slow 0.10–0.25 37.1 16.4 10.4 20.1 3.3 24.1 25.7 0.25–0.50 37.8 20.6 8.9 17.2 2.6 29.8 20.9 0.50–1.0 30.7 25.4 8.2 12 9.5 29.1 15.9 1.0–2.0 29.6 30.6 6.4 8.1 3.3 39.6 12.1 2.0–5.0 28.7 42.3 4.9 3 5 28.9 15.9 5.0+ 28.4 62.8 3.3 3.7 6.1 14.8 9.4 Existing Modal Split in Indian Cities (as a % of Total Trips) Source: Ministry of Urban Development, Government of India, New Delhi. 1998. Traffic and Transportation Policies and Strategies in Urban Areas in India. Dreaming about personalized vehicle
- 19. Urban Transport 28/01/2016 19 WHAT IS THE SOLUTION? Right design and planning approach
- 20. Urban Transport 28/01/2016 20 RIGHT APPROACH Egis Graphic
- 21. Urban Transport 28/01/2016 21 ACCESS HIERARCHY Hierarchy - based on the type of city road. Ex: Transit > Pedestrian > Bicycle >Automobile - along a major Transit Corridor Typical Hierarchy
- 22. Urban Transport 28/01/2016 22 TRANSPORTATION CHOICES Giving people a range of transportation choices . Mobility choices are governed by the provided options
- 23. Urban Transport 28/01/2016 23 Better public transport facilities Pleasure in walking Pleasure in cycling Overall integration Parking for sustainable modes at stations PROVIDING SUSTAINABLE TRANSPORT INFRASTRUCTURE
- 24. Urban Transport 28/01/2016 24 WHAT WE ACHIEVE? City Population (in millions) Walk Mass Transport IPT Car Two Wheeler Bicycle Fast Slow 0.10–0.25 37.1 16.4 10.4 20.1 3.3 24.1 25.7 0.25–0.50 37.8 20.6 8.9 17.2 2.6 29.8 20.9 0.50–1.0 30.7 25.4 8.2 12 9.5 29.1 15.9 1.0–2.0 29.6 30.6 6.4 8.1 3.3 39.6 12.1 2.0–5.0 28.7 42.3 4.9 3 5 28.9 15.9 5.0+ 28.4 62.8 3.3 3.7 6.1 14.8 9.4
- 25. Urban Transport 28/01/2016 25 WHAT WE ACHIEVE? City Population (in millions) Walk Mass Transport IPT Car Two Wheeler Bicycle Fast Slow 0.10–0.25 37.1 16.4 10.4 20.1 3.3 24.1 25.7 0.25–0.50 37.8 20.6 8.9 17.2 2.6 29.8 20.9 0.50–1.0 30.7 25.4 8.2 12 9.5 29.1 15.9 1.0–2.0 29.6 30.6 6.4 8.1 3.3 39.6 12.1 2.0–5.0 28.7 42.3 4.9 3 5 28.9 15.9 5.0+ 28.4 62.8 3.3 3.7 6.1 14.8 9.4
- 26. Urban Transport 28/01/2016 26 WHAT WE ACHIEVE? City Population (in millions) Walk Mass Transport IPT Car Two Wheeler Bicycle Fast Slow 0.10–0.25 37.1 16.4 10.4 20.1 3.3 24.1 25.7 0.25–0.50 37.8 20.6 8.9 17.2 2.6 29.8 20.9 0.50–1.0 30.7 25.4 8.2 12 9.5 29.1 15.9 1.0–2.0 29.6 30.6 6.4 8.1 3.3 39.6 12.1 2.0–5.0 28.7 42.3 4.9 3 5 28.9 15.9 5.0+ 28.4 62.8 3.3 3.7 6.1 14.8 9.4 Stop dreaming about personalized vehicle. Stick to sustainable modes
- 27. Urban Transport 28/01/2016 27 WHAT WE ACHIEVE? City Population (in millions) Walk Mass Transport IPT Car Two Wheeler Bicycle Fast Slow 0.10–0.25 37.1 16.4 10.4 20.1 3.3 24.1 25.7 0.25–0.50 37.8 20.6 8.9 17.2 2.6 29.8 20.9 0.50–1.0 30.7 25.4 8.2 12 9.5 29.1 15.9 1.0–2.0 29.6 30.6 6.4 8.1 3.3 39.6 12.1 2.0–5.0 28.7 42.3 4.9 3 5 28.9 15.9 5.0+ 28.4 62.8 3.3 3.7 6.1 14.8 9.4 Even these people will think of using public transport
- 28. Urban Transport 28/01/2016 28 TRANSPORT CHOICES Source: smartgrowth.org
- 29. Urban Transport 28/01/2016 29 APPROACH RESULT Overall Improved Accessibility for every road user
- 30. Urban Transport 28/01/2016 30 WHAT WE NEED!!!!
- 31. Urban Transport 28/01/2016 31 WHAT WE NEED!!!!
- 32. Urban Transport 28/01/2016 32 WHAT WE NEED!!!!
- 33. Urban Transport 28/01/2016 33 WHAT WE NEED!!!!
- 34. Urban Transport 28/01/2016 34 PLEASURE IN WALKING???? Where is wrong? © Spandana
- 35. Urban Transport 28/01/2016 35 PLEASURE IN WALKING???? They are doing wrong??? NO!!! forcing them to walk on road © Spandana
- 36. Urban Transport 28/01/2016 36 EXISTING SIDEWALKS IN BANGALORE Source: Internet
- 37. Urban Transport 28/01/2016 37 MEASURES TO IMPROVE URBAN TRANSPORT
- 38. Urban Transport 28/01/2016 38 taking transport as an opportunity to create vibrant public spaces thereby improving the image and livability of the city. Transport Integration as Facelift for city Area OVERALL APPROACH
- 39. Urban Transport 28/01/2016 39 TRANSPORTATION EVALUATION Based on Accessibility – Multi Modal Level of Service (MLOS)
- 40. Urban Transport 28/01/2016 40 MULTI MODAL LEVEL OF SERVICE
- 41. Urban Transport 28/01/2016 41 ANALYTICAL TOOL FOR IMPROVING URBAN TRANSPORT Physical Integration Fare Integration Route Integration Institutional Integration Intelligent Transportation System Integration city as connected when citizens have peace of mind regarding mobility – making transportation available so that every citizen in a country can be present in the right place at the right time.
- 42. Urban Transport 28/01/2016 42 ANALYTICAL TOOL FOR IMPROVING URBAN TRANSPORT city as connected when citizens have peace of mind regarding mobility – making transportation available so that every citizen in a country can be present in the right place at the right time.
- 43. Urban Transport 28/01/2016 43 Typical map - Route Rationalization and Integrated Public Transport Service Plan.
- 44. Urban Transport 28/01/2016 44 Typical map – Before Route Rationalization Typical map – After Route Rationalization
- 45. Urban Transport 28/01/2016 45 TRANSIT CORRIDOR PLANNING Through the dense areas. All Successful transit corridors are along the dense areas of city. Scope for Transit oriented development (TOD)
- 46. Urban Transport 28/01/2016 46 SUCCESSFUL TRANSIT CORRIDOR Curitiba, BRT
- 47. Urban Transport 28/01/2016 47 SUCESSFUL TRANSIT CORRIDOR BRT OF GUANGZHOU
- 48. Urban Transport 28/01/2016 48 SUCCESSFUL TRANSIT CORRIDOR Lanzhou, China
- 49. Urban Transport 28/01/2016 49 TOD - STATION ACCESSIBILITY
- 50. Urban Transport 28/01/2016 50 Source:www.lta.gov.s g