ĐỀ THAM KHẢO KÌ THI TUYỂN SINH VÀO LỚP 10 MÔN TIẾNG ANH FORM 50 CÂU TRẮC NGHI...
Prashant analysis
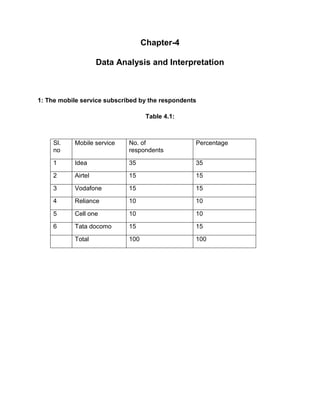
1. Chapter-4
Data Analysis and Interpretation
1: The mobile service subscribed by the respondents
Table 4.1:
Sl.
no
Mobile service No. of
respondents
Percentage
1 Idea 35 35
2 Airtel 15 15
3 Vodafone 15 15
4 Reliance 10 10
5 Cell one 10 10
6 Tata docomo 15 15
Total 100 100
2. Mobile service subscribed by the respondents
Graph 4.1:
Inference: 39% respondents of Idea, 16% respondents of Airtel,16% respondents of
Vodafone.9% respondents of Reliance, 20% respondents of Cell From this we come to
know that largest segment of respondents are of idea then comes Cell one, Airtel and
Vodafone.
0
5
10
15
20
25
30
35
40
Idea Airtel Vodafone Reliance Cell one Tata docomo
no. of respondent
3. 2: The mobile subscribers preferring the type of service
Table 4.2:
Sl. no Type of service No. of respondents Percentage
1 Pre Paid 29 29
2 Post Paid 71 71
Total 100 100
4. Mobile subscribers preferring the Type of service
Graph 4.2:
Inference:
29% respondents of Idea are using pre paid
71% respondents of Idea are using post paid
From this we can conclude that most of the respondents of Idea prefer post-paid
servicethan to pre paid
0
10
20
30
40
50
60
70
80
Pre Paid Post Paid
No. of respondent
No. of respondent
5. 3: The prepaid respondents using the recharge coupon
Table 4.3:
Sl. No Type of
recharge
coupon
No of
respondents
Percentage
1 Rs.108 11 11
2 Rs.324 55 55
3 Rs.540 10 10
4 Rs.1080 15 15
5 Rs.3240 9 9
Total 100 100
6. Usage of Recharge coupons
Graph4.3:
Inference:11% respondents prefer Rs. 108 recharge coupon, 55% respondents prefer
Rs.324 recharge coupon, 10% respondents prefer Rs.540 recharge coupon, 15%
respondents prefer Rs.1080 recharge coupon, 9% respondents prefer Rs. 3240
recharge coupon.
From this we conclude that most of the respondents prefer the Rs. 324/- recharge
coupon.
0
10
20
30
40
50
60
Rs.108 Rs.324 Rs.540 Rs.1080
No.of respondent
7. MODE OF AWARENESS
4: Through which media respondents came to know about Idea.
Table 4.4:
Sl. No Type of media No. of
respondents
Percentage
1 Television 23 23
2 Print Media 23 23
3 Friends/Relatives 37 37
4 Hoardings 7 7
5 Other 10 10
Total 100 100
8. Type of Media
Graph 4.4:
Inference:23% respondents came to know through television, 23% respondents came
to know through print media, 37% respondents came to know through friends / relatives,
7% respondents came to know through hoardings,10%respondents came to know
through others.
From this it is clear that most of the respondents came to know about idea through
friends / relatives.
0
5
10
15
20
25
30
35
40
No. of respondent
No. of respondent
9. 5: The features that attract an Idea card purchase.
Table 4.5:
Sl.no Features No of
respondents
Percentage
1 Most friendly &
affordable plans
7 18
2 Best quality
network
12 31
3 Widest coverage
in A.P
20 51
4 Brand loyalty 0 0
Total 39 100
10. Features that attract Idea card purchase
Graph 4.5:
Inference: 18% respondents are attracted towards Idea’s most friendly &affordable
plans.31% respondents are attracted towards Idea’s best quality network.51%
respondents are attracted towards Idea’s widest coverage in A.P.1% respondents are
attracted towards Idea’s brand loyalty.
0
5
10
15
20
25
Most friendly &
affordable plans
Best quality network Widest coverage in A.P Brand loyalty
No. of respondent
11. 6: The features that need improvement.
Table 4.6:
Sl. No Features No. of
respondents
Percentage
1 Service 41 41
2 Transparency in
billing
24 24
3 Call clarity 20 20
4 Other 25 25
Total 100 100
12. Features need to Improve
Graph 4.6:
Inference:41% respondents say service need improvement.24% respondents say more
transparency in billing should maintained.20% respondents say call clarity need
improvement.25% respondents say other features need improvement.
From this we conclude that most of the respondents need improvement in service.
0
5
10
15
20
25
30
35
40
45
Service Transparency in
billing
Call clarity Other
No. of respondent
No. of respondent
13. 7: The sales promotion tools.
Table4.7:
Sl. No Sales Promotional
tool
No. of
respondents
Percentage
1 Extra talk time 38 38
2 Customized
recharge facility
9 9
3 Free incoming for
more than 1 month
38 38
4 Other 15 15
Total 100 100
14. Sales Promotion tools
Graph 4.7:
Inference:38% respondents suggested for extra talk time.9% respondents suggested
for customized recharge facility.38% respondents suggested for free incoming for more
than 1 month.15% respondents gave other suggestions for sales promotion.
From this we can say that respondents prefer extra talk time and free incoming for more
than 1 month as good sales promotional tools.
0
5
10
15
20
25
30
35
40
Extra talk time Customized recharge
facility
Free incoming for more
than 1 month
Other
No. of respondent
15. 8: The Brand ambassador who can influence sales
Table4.8:
bSl. No Brand
Ambassador
No. of
respondents
Percentage
1 Film star 34 34
2 Sports person 46 46
3 Politician 3 3
4 Company CEO 17 17
Total 100 100
16. Brand Ambassador
Graph 4.8:
Inference: 34% respondents suggested for film star as brand ambassador.46%
respondents suggested for sports person as brand ambassador.3% respondents
suggested for politician as brand ambassador.17% respondents suggested for company
CEO as brand ambassador.
From this it is clear that more respondents prefer sports person to film state
0
5
10
15
20
25
30
35
40
45
50
Film star Sports person Politician Company CEO
No. of respondent
17. 9: The features that make idea cellular the most preferred.
Table 4.9:
Sl. No Features No of
respondents
Percentage
1 Widest coverage in AP 15 39
2 Brand loyalty 0 0
3 Most Economical and
friendly packages
11 29
4 Best quality and
extensive network
13 32
Total 39 100
18. Features of Idea Cellular preferred
Graph 4.9:
Inference: 39% respondents suggested for extra talk time.29% respondents
suggested for customized recharge facility.32% respondents suggested for free
incoming for more than 1 month.15% respondents gave other suggestions for sales
promotion.
0
2
4
6
8
10
12
14
16
Widest coverage in AP Brand loyalty Most Economical and
friendly packages
Best quality and
extensive network
No. of respondent
19. 10: The ratings the respondents gave for “Idea Cellular” services.
Table 4.10
Sl. No Ratings No of
respondents
Percentage
1 Excellent 17 43
2 Good 12 35
3 Satisfactory 10 22
4 Poor 0 0
Total 39 100
20. Ratings of Idea Cellular Services
Graph 4.10
Inference:
43% respondents rated an excellent.
35% respondents rated as good.
22% respondents rated satisfactory.
0
2
4
6
8
10
12
14
16
18
Excellent Good Satisfactory Poor
No. of respondent
No. of respondent
21. 11: The opinions of respondents towards the Idea’s recently launched recharge
coupon of Rs. 50/- Rs 100/-.
Table 4.11:
Si. No Ratings No of
respondents
Percentage
1 Excellent 9 18
2 Good 20 39
3 Satisfactory 16 36
4 Poor 3 7
Total 49 100
22. Opinion of Respondents
Graph 4.11:
Inference:18% respondents rated as excellent.39% respondents rated as good.36%
respondents rated as satisfactory.7% respondents rated as not exciting.
0
5
10
15
20
25
Excellent Good Satisfactory Poor
No. of respondent
No. of respondent
23. 12: The opinions of the respondents regarding Lifelong incoming.
Table 4.12:
Si .No Response No. of
Respondents
Percentage
1 Yes 56 56
2 No 44 44
100 100
24. Opinion regarding lifelong incoming
Graph 4.12:
Inference:
55% respondents are ready to subscribe the lifelong plan
44% respondents do not want to subscribe because they make more outgoing call rates
less
0
10
20
30
40
50
60
Yes No
No. of respondent
25. 13: The age group of the respondents
Table 4.13:
Si .no Age group No. of
respondents
Percentage
1 15-25 31 31
2 26-35 51 51
3 36-45 31 31
4 46 and above 4 4
100 100
26. Age Group of Respondents
Graph4.13:
Inference:31% respondents are in the age group of 15-25 years.51% respondents are
in the age group of 26-35 years.14% respondents are in the age group of 36-45
years.4% respondents are in the age group of46and above-25 year
0
10
20
30
40
50
60
15-25 26-35 36-45 46 and above
No. of respondent
No. of respondent
27. 14: The occupation of respondents.
Table 4.14:
Si. no Occupation No. of
Respondents
Percentage
1 Business 39 39
2 Employee 34 34
3 Student 13 13
4 Professional 11 11
5 Others 3 3
Total 100 100
28. Occupation of Respondents
Graph 4.14:
Inference: 39% respo9ndetns are businessmen.34% respo9ndetns are
employees.13% respo9ndetns are students.11% respo9ndetns are professionals.3%
respo9ndetns are other.
0
5
10
15
20
25
30
35
40
45
Business Employee Student Professional Others
No. of respondent
29. 15: The income group of the respondents
Table 4.15:
Sl .no Income group No .of respondents Percentage
1 Less than 5000 25 25
2 5000-10000 45 45
3 10000-15000 17 17
4 15000 and above 13 13
Total 100 100
30. Income Group of Respondents
Graph4.15
Inference:
25% respondents are in the income group of less than Rs.5000/-
45% respondents are in the income group of Rs. 5000-10000.
17% respondents are in the income group of Rs. 10000-15000.
13% respondents ate in the income group of Rs 15000 and above.
0
5
10
15
20
25
30
35
40
45
50
Less than 5000 5000-10000 10000-15000 15000 and above
No. of respondent