FULL ENJOY Call Girls In Mahipalpur Delhi Contact Us 8377877756
lakshmi project 1.docx
1. CHAPTER – 05
DATA ANALYSIS AND INTERPRETATION
MEANING OF DATA ANALYSIS:
The process of evaluating data using analytical and logical reasoning to examine each
component of the data provided. This form of analysis is just one of the many steps that must
be completed when conducting a research experiment. Data from various sources is gathered,
reviewed, and then analyzed to form some sort of finding or conclusion. There are a variety of
specific data analysis method, some of which include data mining, text analytics, business
intelligence, and data visualizations. Data analysis and interpretation is the process of assigning
meaning to the collected information and determining the conclusions, significance, and
implications of the findings. The steps involved in data analysis are a function of the type of
information collected; however, returning to the purpose of the assessment and the assessment
questions will provide a structure for the organization of the data and a focus for the analysis.
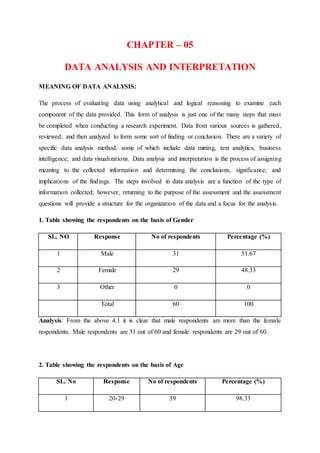
1. Table showing the respondents on the basis of Gender
SL. NO Response No of respondents Percentage (%)
1 Male 31 51.67
2 Female 29 48.33
3 Other 0 0
Total 60 100
Analysis: From the above 4.1 it is clear that male respondents are more than the female
respondents. Male respondents are 31 out of 60 and female respondents are 29 out of 60.
2. Table showing the respondents on the basis of Age
SL. No Response No of respondents Percentage (%)
1 20-29 59 98.33
2. 2 30-39 1 1.67
3 40-49 0 0
4 50 and over 0 0
5 Total 60 100
Analysis: From the above table 4.2 it is clear that the number of respondents aged 20-29 years
are 59, 30-39 years are 1, 40-49 years are 0, 50 and above are 0.
.3. Table showing the respondents on the basis of Education Qualification
SL. No Response No of respondents Percentage (%)
1 Below 10th 2 3.33
2 Pre-University 11 18.33
3 UG 20 33.33
4 PG and above 27 45.00
Total 60 100
Analysis: From the above table 4.3 it is clear that the number of respondents with the education
qualification Below 10th are 2, Pre University are 11, UG are 20, PG and above are 27 out of
total respondents
4.Table showing the respondents on the basis of Occupation
SL. No Response No of respondents Percentage (%)
1 Students 34 56.67
2 Professional 13 21.67
3 House Wife 2 3.33
4 Business Man 2 3.33
5 Others 9 15.0
3. Total 60 100
Analysis: From the above table 4.4 it is clear that the number of respondents who are
students are 34, Professional are 13, House wife are 2, Business man are 2 and the
respondents with other occupations are 9 out of total respondents.
5. Table showing the respondents on the basis of how did you get the Idea of online
shopping
SL. No Response No of
respondents
Percentage
(%)
1 Referred by friend or family 30 50.00
2 Saw an online advertisement 21 35.00
3 Saw an offline
advertisement(local electronic
stores)
4 6.67
4 I was just waiting for launch of
this product since long
5 8.33
Total 60 100
Analysis: From the above table 4.24 it is clear that 30 respondents Referred by friend or
family, 21 respondents Saw an online advertisement, 4 respondents Saw an offline
advertisement(local Electronic stores) and 5 respondents I was waiting for launch of this
product since long for the idea of buying specific electronics products out of total respondents
6. Table showing the respondents on the basis of why are you Choosing online shopping
SL. No Response No of
respondents
Percentage
(%)
4. 1 Very Convenience & Time
saving
19 31.67
2 Low Price 16 26.67
3 Product variety 15 25.00
4 You can buy the rare products
here
5 8.33
4 You can buy the rare products
here
5 8.33
5 Others 5 8.33
Total 60 100
Analysis: From the above table 4.18 it is clear that 19 respondents Very Convenience and Time
saving, 16 respondents Low Price, 15 respondents Product variety, 5 respondents You can buy
the rare products here, 5 respondents Others for the choosing shop online out of total
respondents.
7.Table showing the responds on the basis of preferred online shopping portals
SL. No Response No of
respondents
Percentage (%)
1 Amazon 20 33.33
2 Flipkart 34 56.67
3 Snapdeal 0 0
4 Myntra 1 1.67
5 Others 5 8.33
Total 60 100
Analysis: From the above table 4.5 it is found that the number respondents who prefer
Amazon are 20, who prefer Flipkart are 34, who prefer Snapdeal are 0, who prefer Myntra
are 1 and 5 respondents prefer Others shopping portals out of total respondents.
5. 8. Table showing the respondents on the basis of how long have you been Shopping
Online
SL No Response No of respondents Percentage (%)
1 Less than 6 months 22 36.67
2 Less than a year 14 23.32
3 1-5 year 18 30.00
4 5 year and above 6 10.00
Total 60 100
Analysis: From the above table 4.7 it is clear that the number of respondents whose frequency
of online shopping - Less than 6 months are 22, Less than a year are 14, 1-5 year are 18 and 5
year and above are 6 out of total respondents.
9. Table showing the respondents on the basis of Preliminary enquiery in retail shop
before Online Shopping
SL. No Response No of respondents Percentage (%)
1 Yes 51 85.00
2 No 9 15.00
Total 60 100
Analysis: From the above table 4.8 it is clear that 51 out of 60 respondents prefer preliminary
enquiry in retail shop before online shopping and 9 out of 60 respondents do not prefer
preliminary enquiry.
10. Table showing the respondents on basis of main Reasonto Buy Online Shopping
6. SL. No Response No of
respondents
Percentage (%)
1 Less Price 12 20.00
2 Convenience & Time
saving
35 58.33
3 Trust & Fast shipping 8 13.33
4 Brand Consciousness 2 3.33
5 Friend referral 3 5.00
Total 60 100
Analysis: From the above table 4.9 it is clear that 12 respondents consider Less Price as main
reason to buy online, 35 respondents consider Convenience and Time saving ,8 respondents
consider Trust and fast shipping, 2 respondents consider Brand Consciousness, and 3
respondent consider Friends refferal to buy online out of the total respondents.
11. Table showing the respondents on the basis of Factors Motivating to Shopping
Online
SL. No Response No of
respondents
Percentage
(%)
1 Convenience and easy buying 21 35.00
2 Variety of options 13 21.67
3 Reasonable Prices 10 16.67
4 Cash on delivery 14 23.33
5 Better Delivery Better Post
buying services
2 3.33
Total 60 100
7. Analysis: From the above table 4.28 it is found that 21 respondents motivated because of
Convenience and and easy buying, 13 respondents motivated because of Variety of options,
10 respondents because of Reasonable prices, 14 respondents motivated because of Cash on
delivery and 2 respondents motivated because of Better Delivery better post buying services
out of total respondents
12.Table showing the respondents on basis of what are the Problems faced in Online
Shopping
SL. No Response No of respondents Percentage (%)
1 Lack of Quality 20 33.33
2 Delay in delivery 16 26.67
3 Receiving Wrong product 6 10.00
4 Product return & Service
Problem
14 23.33
5 Lack of Security or Privacy 4 6.67
Total 60 100
Analysis: From the above table 4.11 it is clear that 20 respondents consider Lack of Quality,
16 respondents consider Delivery too slow, 6 respondents consider Receiving wrong product,
14 respondents consider Product return & Service Problem and 4 respondents consider Lack
of Security/Privacy, as problem major problem faced in online shopping put of total 100
respondents.
13. Table showing the respondents on basis of Prices is lesserthan Offline Buying
SL No Response No of
respondents
Percentage
(%)
1 Strongly agree 8 13.33
2 Agree 40 66.67
8. 3 Neither agree nor disagree 7 11.67
4 Disagree 2 3.33
5 Strongly disagree 3 5.00
Total 60 100
Analysis: From the above table 4.14 it is clear that 8 respondents Strongly agree, 40
respondents Agree, 7 respondents Neither agree nor disagree, 2 respondents Disagree and 3
respondents Strongly disagree for the lesser price than offline buying out of total respondents.
14. Table showing the respondents on basis of Easy Return is possible in Online
Shopping
SL. No Response No of
respondents
Percentage
(%)
1 Strongly agree 7 11.67
2 Agree 35 58.33
3 Neither agree nor disagree 9 15.00
4 Disagree 7 11.67
5 Strongly disagree 2 3.33
Total 60 100
Analysis: From the above table 4.15 it is clear that 7 respondents Strongly agree, 35
respondents Agree, 9 respondents Neither agree nor disagree, 7 respondents disagree and 2
respondent Strongly disagree for the out of total respondents.
15. Table showing the respondents on the basis of how much Time do you spend on
Internet Every day
SL. No Response No of
respondents
Percentage
(%)
1 Below 1 hour 15 25.00
9. 2 1 hour 12 20.00
3 2-4 hours 18 30.00
4 4-8 hours 9 15.00
5 8-10 hours 2 3.33
6 10-12 hours & above 4 6.67
Total 60 100
Analysis: From the above table 4.17 it is clear that respondents are Below 1 hour are 15, 1 hour
are 12, 2-4 hours are 18, 4-8 hours are 9, 8-10 hours are 2, 10-12 hours & above are 4 for the
time spend on Internet Every day out of total respondents.
16. Table showing the respondents on the basis of Online Payments are secured
SL. No Response No of
respondents
Percentage
(%)
1 Strongly agree 11 18.33
2 Agree 34 56.67
3 Neither agree or nor disagree 10 16.67
4 Disagree 4 6.67
5 Strongly disagree 1 1.67
Total 60 100
Analysis: From the above table 4.26 it is clear that 11 respondents Strongly agree, 34
respondents Agree, 10 respondents Neither agree or not disagree, 4 respondents Disagree and
1 respondents Strongly disagree for the online payments are secured in online shopping out of
total respondents.
17. Table showing the respondents on the basis of on average, how aften do you shop
online in the last Six Month's
10. SL. No Response No of
respondents
Percentage
(%)
1 Every day 5 8.33
2 Two times a week 3 5.00
3 Weekly 10 16.67
4 Once every two weeks 4 6.67
5 Once a month 18 30.30
6 Every 2 or 3 months 20 33.33
Total 60 100
Analysis: From the above table 4.16 it is clear that number of respondents having shop in
online last six months, Everyday are 5, Two times a week are 3, Weekly are 10, Once every
two weeks are 4, Once a month are 18 and Every 2 or 3 months are 20 for the total respondents.
18. Table showing the respondents on the basis of So far, I am satisfied with the Speed
of Delivery for online shopping
SL. No Response No of
respondents
Percentage
(%)
1 Strongly agree 10 16.67
2 Agree 34 56.67
3 Neutral 10 16.67
de4 Disagree 04 6.67
5 Strongly disagree 02 3.33
Total 60 100
11. Analysis: From the above table 4.20 it is clear that 10 respondents Strongly agree, 34
respondents Agree, 10 respondents Neutral, 4 respondents Disagree and 2 respondents Strongly
disagree for the Satisfied with the Speed delivery of online shops out of total respondents
19 .Table showing the respondents on the basis of how much do you Spend on Online
Shopping Every month
SL. No Response No of
respondents
Percentage
(%)
1 100 Rs -1000 Rs 40 66.67
2 1000 Rs-2000 Rs 14 23.33
3 3000 Rs – 4000 Rs 6 10.00
4 5000 RS and above 0 0.00
Total 60 100
Analysis: From the above table 4.22 it is clear that 40 respondents 100Rs-1000Rs, 14
respondents 1000Rs-2000Rs, 6 respondents 3000Rs-4000Rs and 0 respondents 5000Rs and
above for the Spend on Online Shopping Every month out of total respondents.
20.Table showing the respondents on the basis of Overall Satisfied in Online Shopping
SL. No Response No of
respondents
Percentage
(%)
1 Strongly agree 13 21.67
2 Agree 40 66.67
3 Neither agree or nor disagree 4 6.67
4 Disagree 2 3.33
5 Strongly disagree 1 1.67
Total 60 100
12. Analysis: From the above table 4.29 it is clear that 13 respondents Strongly agree, 40
respondents Agree, 4 respondents Neither agree or nor disagree, 2 respondents Disagree and 1
respondent Strongly disagree for the Overall satisfaction in online shopping out of total
respondents.