Recommended

Recommended
More Related Content
Similar to BMD Conference Poster
Similar to BMD Conference Poster (20)
Recently uploaded
Recently uploaded (20)
BMD Conference Poster
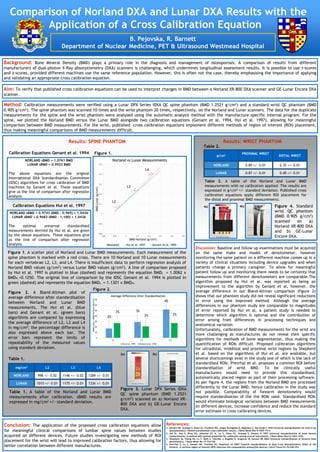
- 1. Comparison of Norland DXA and Lunar DXA Results with the Application of a Cross Calibration Equation B. Pejovska, R. Barnett Department of Nuclear Medicine, PET & Ultrasound Westmead Hospital Background: Bone Mineral Density (BMD) plays a primary role in the diagnosis and management of osteoporosis. A comparison of results from different manufacturers of dual-photon X-Ray absorptiometry (DXA) scanners is challenging, which undermines longitudinal assessment results. It is possible to use t-scores and z-scores, provided different machines use the same reference population. However, this is often not the case, thereby emphasising the importance of applying and validating an appropriate cross calibration equation. Aim: To verify that published cross calibration equations can be used to interpret changes in BMD between a Norland XR-800 DXA scanner and GE-Lunar Encore DXA scanner. Method: Calibration measurements were verified using a Lunar DPX Series iDXA QC spine phantom (BMD 1.2521 g/cm2) and a standard wrist QC phantom (BMD 0.905 g/cm2). The spine phantom was scanned 10 times and the wrist phantom 20 times, respectively, on the Norland and Lunar scanners. The data for the duplicate measurements for the spine and the wrist phantom were analysed using the automatic analysis method with the manufacture specific internal program. For the spine, we plotted the Norland BMD versus the Lunar BMD alongside two calibration equations (Genant et al. 1994, Hui et al. 1997), allowing for meaningful comparison between BMD measurements. For the wrist, published cross calibration equations implement different methods of region of interest (ROI) placement, thus making meaningful comparisons of BMD measurements difficult. Results: SPINE PHANTOM NORLAND sBMD = 1.0761 BMD LUNAR sBMD = 0.9522 BMD The above equations are the original International DXA Standardisation Committee (IDSC) algorithms for cross calibration of BMD machines by Genant et al. These equations give us the line of comparison after regression analysis. NORLAND sBMD = 0.9743 (BMD - 0.969) + 1.0436 LUNAR sBMD = 0.9683 (BMD - 1.100) + 1.0436 The optimal universal standardised measurements derived by Hui et al. are given by the above equations. These equations give us the line of comparison after regression analysis. Calibration Equations Genant et al. 1994 Calibration Equations Hui et al. 1997 Figure 1. A scatter plot of Norland and Lunar BMD measurements. Each measurement of the spine phantom is marked with a red cross. There are 10 Norland and 10 Lunar measurements for each vertebrae L2, L3, and L4. There is insufficient data to perform regression analysis of Norland BMD values (g/cm2) versus Lunar BMD values (g/cm2). A line of comparison proposed by Hui et al. 1997 is plotted in blue (dashed) and represents the equation BMDL = 1.0062 x BMDN +0.1250. The original line of comparison by the IDSC Genant et al. 1994 is plotted in green (dashed) and represents the equation BMDL = 1.1301 x BMDN. Figure 2. A Bland-Altman plot of average difference after standardisation between Norland and Lunar BMD measurements. The Hui et al. (blue bars) and Genant et al. (green bars) algorithms are compared by expressing the average difference of L2, L3 and L4 in mg/cm2; the percentage difference is also expressed above each bar. The error bars represent the limits of repeatability of the measured values using standard deviation. g/cm2 PROXIMAL WRIST DISTAL WRIST NORLAND 0.89 +/- 0.01 0.35 +/- 0.01 LUNAR 0.87 +/- 0.01 0.40 +/- 0.01 Results: WRIST PHANTOM Table 2. A table of the Norland and Lunar BMD measurements with no calibration applied. The results are expressed in g/cm2 +/- standard deviation. Published cross calibration equations apply different ROI placement for the distal and proximal BMD measurements. Conclusion: The application of the proposed cross calibration equations allow for meaningful clinical comparisons of lumbar spine values between studies acquired on different devices. Future studies investigating new methods of ROI placement for the wrist will lead to improved calibration factors, thus allowing for better correlation between different manufactures. B. Pejovska, R. Barnett Department of Nuclear Medicine, PET & Ultrasound Westmead Hospital Discussion: Baseline and follow up examinations must be acquired on the same make and model of densitometer, however monitoring the same patient on a different machine comes up in a variety of clinical situations including device upgrades and when patients change a primary caregiver. To allow for meaningful patient follow up and monitoring there needs to be certainty that measurements from different densitometers are comparable.The algorithm proposed by Hui et al. was reported as being an improvement to the algorithm by Genant et al, however, the average difference in our Bland-Altman comparison (figure 2) shows that our phantom study did not reveal significant reductions in error using the improved method. Although the average differences in our phantom study are comparable to magnitudes of error reported by Hui et al, a patient study is needed to determine which algorithm is optimal and the contribution of error arising from differences in processing techniques and anatomical variation. Unfortunately, calibration of BMD measurements for the wrist are more challenging as manufactures do not reveal their specific algorithms for methods of bone segmentation, thus making the quantification of ROIs difficult. Proposed calibration algorithms for ultradistal, middistal and proximal wrist regions by Shepherd et al. based on the algorithms of Hui et al. are available, but several shortcomings exist in the study one of which is the lack of standardised ROIs. Prevrhal et al. proposes a common ROI before standardisation of wrist BMD. To be clinically useful manufacturers would need to provide this standardised, automatically placed region as part of their processing software. As per figure 4, the regions from the Norland BMD are processed differently to the Lunar BMD, hence calibration in the study was not possible. Comparability of forearm densitometry would require standardisation of the the ROIs used. Standardised ROIs would eliminate biological variations between BMD measurements on different devices, increase confidence and reduce the standard error estimate in cross calibrating devices. Figure 3. Lunar DPX Series iDXA QC spine phantom (BMD 1.2521 g/cm2) scanned on a) Norland XR- 800 DXA and b) GE-Lunar Encore DXA. Figure 4. Standard wrist QC phantom (BMD 0.905 g/cm2) scanned on a) Norland XR-800 DXA and b) GE-Lunar Encore DXA. 4a) 4b) mg/cm2 L2 L3 L4 NORLAND 998 +/- 0.02 1146 +/- 0.02 1284 +/- 0.01 LUNAR 1015 +/- 0.01 1175 +/- 0.01 1336 +/- 0.01 Table 1. A table of the Norland and Lunar BMD measurements after calibration. sBMD results are expressed in mg/cm2 +/- standard deviation. Figure 1. Figure 2. Table 1. Table 2. 3a) 3b) References: 1. Genant HK, Grampp S, Gluer CC, Faulkner KG, Jergas M,Engelke K, Hagiwara S, Van Kuijk C 1994 Universal standardisation for dual X-ray absorptiometry: Patient and phantom cross-calibration results. J Bone Miner Res 9:1503–1514. 2. Hui SL, Gao S, Zhou XH, Johnston CC Jr, Lu Y, Gluer CC, Grampp S, Genant H 1997 Universal standardisation of bone density measurements: A method with optimal properties for calibration among several instruments. J Bone Miner Res12:1463–1470. 3. Shepherd JA, Cheng XG, Lu Y, Njeh C, Toschke J, Engelke K, Grigorian M, Genant HK 2002 Universal standardisation of forearm bone densitometry. J Bone Miner Re 17:734-745 4. Prevrhal S, Lu Y, Genant HK, Toschke JO, Shepherd JA 2005 Towards standardisation of dual X-ray absorptiometry (DXA) at the forearm. A common region of interest (ROI) improves the comparability among DXA devices. Calcif Tissue Int 76:348-354 L2 L3 L4 2% 3% 3% 2% 4% 2%