SlideShare a Scribd company logo
1 of 15
Download to read offline
ISSN 2349-7831
International Journal of Recent Research in Social Sciences and Humanities (IJRRSSH)
Vol. 1, Issue 3, pp: (16-30), Month: October - December 2014, Available at: www.paperpublications.org
Page | 16
Paper Publications
THE IMPACT OF TUBERCULOSIS (TB) ON
FARMER’S INCOME, IN EASTERN SUDAN,
WITH SPECIAL REFRENCE TO GASH
DELTA, KASSALA STATE, SUDAN
1
Sumaya Mohammed Mustafa Mohammed Elamin
Department of Agricultural Economics, Faculty of Agriculture and Natural Resources, University of Kassala, Sudan
Abstract: The study is designed to evaluate the impact of TB on farmer's income in the Gash delta. It depends
mainly on primary and secondary data, the primary data was collected by questionnaire through direct interview
of the respondents in the Gash delta agricultural scheme. The sample covers 100 farmers of TB morbidity and
debility cases selected randomly from the farmers in the area, using the registration list in Aroma, Kassala and
Wager hospitals after diagnosis of the disease, another 100 healthy farmers were selected using the same method of
sample selection. (The total sample size was 200 farmers). Secondary data was collected from different sources
related to the field of the study. Statistical procedures were used, including frequencies and inter-correlation
matrix for the selected variables. The principal results are summarized in the following points:
There is a strong positive correlation between farmer's annual income and the following variables: Age,
Educational level, family size, Number of working daily hours, Annual expenditure, Price per unit of output,
Farmer's productivity and strong negative correlation with infection. Finally, a set of recommendations were
generated which aimed to reduce TB infection and disease in the Gash delta:
1- Periodic test and prevention of the disease.
2- Isolation of the patient farmers with active disease, before starting effective anti-tuberculosis therapy, so as to
break the chain of transmission of the disease among the farmers.
3-Adequate TB control and management program is needed and integration into primary health care.
4- There is a need of health education to teach the farmers about TB disease and how to avoid its infection.
5- Aroma hospital should have to coordinate with the Gash delta agricultural scheme to play an effective role in
reaching and looking after the patient farmers.
6- The Gash delta agricultural scheme management should have to seek a way for supporting the patient farmer's
income.
7-The state government should have to compensate the infected farmers for the lost seasons.
8- Incorporate the international NGOs.
I. INTRODUCTION
1.1 Tuberculosis in the Sudan
Tuberculosis remains one of the formidable public health challenges in the Sudan. Meager resources and underdeveloped
health infrastructure with devastating ongoing civil war since 1955 aggravate the situation. Collins, S. (1996) was the
pioneer who studied tuberculosis in Sudanese and Egyptian armies. To his amazement, he found that the incidence of the
disease was much Counterparts. Between 1902-1908 he reported an average annual incidence of 3.7 per 1000 in Sudanese
and 1.5 per 1000 in Egyptian. From these observations Collins, S. (1996) advanced his theory of virgin soil that the
isolated communities were more susceptible to infection than the advanced societies. Collins also observed that
ISSN 2349-7831
International Journal of Recent Research in Social Sciences and Humanities (IJRRSSH)
Vol. 1, Issue 3, pp: (16-30), Month: October - December 2014, Available at: www.paperpublications.org
Page | 17
Paper Publications
tuberculosis was less frequent or complete absent in the Sudanese tribes in their national surrounding, including their
cattle. In contrast to Cummins observations Bergen. (1967). asserted that the Sudanese had much more susceptibility and
predisposition particularly to Tuberculosis because pulmonary tuberculosis is very common amongst the native Sudanese.
No doubt due to the fact that they live in ill-ventilated mud dwellings, the main object of which is to exclude the powerful
rays of the sun. Though this statement is generally true, yet it is not accurate because the rural Sudanese never stay
indoors during the day time as they go about their economic activities as example cattle rearing, cultivating, and fishing
…..Etc. Moreover some communities in the semi-arid areas do not dwell in mud huts but rather in well ventilated tents.
1.2 Socioeconomic Impact of Tuberculosis
Tuberculosis (TB) is essentially a disease of social and economic deterioration (Barr and Menzies, 1994). In fact the close
connection between social and economic deprivation and the emergence of tuberculosis is well known, Rieder HL,
(1994). Many authors have acknowledged that people who are cut-off from income Opportunities become vulnerable for
diseases like tuberculosis. Tomes, for instance, reflecting in her essay review on new work about the history of
tuberculosis, cites an English public health authority who, as early as 1903, noted that the drops in tuberculosis mortality
closely parallels the decline in wheat prices, (Dhesi, 1989).
1.3 Problem Statement
Tuberculosis is not only a health problem it is a social and economical disease.75% of cases of TB occur among the
productive age group (20-50 years) .Studies have found that untreated TB can lead to 20-30% reduction of household
annual wages.
In the Sudan studies suggested that the rate of infection was 1.8% i.e. 1800 persons out of 100,000 persons which
considered to be the highest rate of infection in the world. In the eastern region – where agriculture plays an important
role in the economical and social development of the region and it satisfied the local demand for food as well as the
demand in other regions in the country – The rate of TB infection increased up to 4% i.e. 4000 persons out of 100,000
persons.
1.4 Overall and Specific Objectives
1.4.1 The Overall Objective
The fundamental objective of the study is to assess the socioeconomic impact of Tuberculosis (TB) on farmer's income in
the Gash Delta in the eastern region of the Sudan; to achieve this objective the study sought the following specific
objectives.
1.4.2 The Specific Objectives
1- Determining the farmer's personal characteristics in the study area.
2-Determining the factors affecting farmer's income in the study area.
3-study the impact of Tuberculosis (TB) on farmer's income in the study area.
4-To suggest some recommendations and issues for policies implications to enhance the state of development, encourage
farmer's income in the study area.
1.5 Hypotheses to Be Tested
The hypotheses listed below, are formulated to represent and satisfy the objectives of the study.
Due to TB morbidity, there is a difference between the infected and healthy farmers with respect to:
 Age.
 Secondary occupation.
 Marital status.
 Educational level.
ISSN 2349-7831
International Journal of Recent Research in Social Sciences and Humanities (IJRRSSH)
Vol. 1, Issue 3, pp: (16-30), Month: October - December 2014, Available at: www.paperpublications.org
Page | 18
Paper Publications
 Family size.
A- Agronomic activities, which include:
 Total cultivated area.
 Time of sowing the crop.
 Time of harvesting the crop.
 Cultivation cost.
 Crop marketing.
 Numbers of working hours per day.
 Labour cost.
 Crop market price.
 Farmer's productivity.
B- There is a strong positive correlation between farmer,s annual income and the following factors:
1. Age.
2. Educational level.
3. family size.
4. Number of working daily hours.
5. Annual expenditure.
6. Price per unit of out put.
7. Farmer's productivity.
and strong negative correlation with infection.
1.6 Justification
 TB is essentially a disease of social and economic deterioration.
 75% of cases of tuberculosis occur among the economically productive age group (20-60 years) .
 It has a negative impact on the household income due to cost of traveling to diagnosis, and nursing.
 TB causes social ramification due to isolation or rejection.
II. RESEARCH METHODOLOGY
This section describes the methods utilized to gather data for this research, it includes:
(a) The study area
(b) Sample design and sample selecting Technique
(c) Data analysis procedures
(d) Ethical Considerations.
2.1 The study area
This study was conducted in the Gash delta in Kassala state in the eastern region of the Sudan. The area represents one of
the main agricultural areas in the country. It was selected based on the fact that agriculture in this area plays an important
role in the economical and social development of the region and it satisfied the local demand for food as well as the
ISSN 2349-7831
International Journal of Recent Research in Social Sciences and Humanities (IJRRSSH)
Vol. 1, Issue 3, pp: (16-30), Month: October - December 2014, Available at: www.paperpublications.org
Page | 19
Paper Publications
demand in other regions in the country. TB prevalence rate is high. (The rate of TB infection increased up to 4% i.e. 4000
persons out of 100,000 persons) .
2.2 Methods of Data Collection
2.2.1 Population of the study
All farmers in the Gash delta were considered for the purpose of this study. The population is more or less homogeneous,
they are mostly of the Hadendwa tribe, they are similar in their customs and they grow the same crops.
2.2.2 Determination of Sample Size
For the determination of the sample size we use the following equation :-
n= K x V
D
K = Z value (the normal deviation of 0.90 probability) =1.78
V = the estimated variance (2.8).
D = the magnitude of the difference to be detected (0.05).
n = 1.78 x 2.8 = 99.7 = 100
0.05
2.2.3 Selecting Sampling Technique
Random sample of 100 infected farmers were selected from the diagnostics cases (positive smear) in Aroma and Weger
(Hadalya) hospitals using registered list as guide line. Another 100 healthy farmers is also selected using the same
procedure of sample selection, which used as control, the total sample size is (n=200).
2.2.4 Data collection
The Information were collected using two main sources of data collection:
Secondary Source: depending on references such as previous studies, different ministries reports, offices.
Primary Source: depending on direct observation and questionnaire technique. There are two types of questionnaires, the
first one for the respondents including the following information.
2.2.5 Data Analysis
The data were processed and transformed to computer coding form. Then fed to the computer to calculate the following:
1. Frequencies.
2. Inter-correlation matrix for the selected variables.
III. ANALYTICAL RESULTS
This chapter will present the analytical results of the study, which includes:
3.1 Frequency distribution
3.1.1 Personal characteristics of the farmers in the Gash area
3.1.1.1 Sex
100% of the farmers in the Gash area were male, Table (1).
Table (1): Frequency distribution of farmers according to sex in the Gash area.
Sex
Patient
(n = 100)
Healthy
(n = 100)
Total sample
(n = 200)
Freq. % Freq. % Freq. %
Male 100 100 100 100 200 100
Female 0 0 0 0 0 0
Total 100 100 100 100 022 100
Source: field survey.
ISSN 2349-7831
International Journal of Recent Research in Social Sciences and Humanities (IJRRSSH)
Vol. 1, Issue 3, pp: (16-30), Month: October - December 2014, Available at: www.paperpublications.org
Page | 20
Paper Publications
3.1.1.2 Age
98% and 92% of the infected and healthy farmers respectively, fall within (20–60) year's age group. The mean age was
42.68 years for the infected farmers and 43.78 years for the healthy farmers. Table (2).
Table (2): Frequency distribution of farmer's according to age in Gash area.
Source: field survey.
3.1.1.3 Marital status
96% among the infected farmers in the Gash area were married, and only 4% were single. On the other hand 93% of the
healthy farmers were married, while only 7% were single, table (3)
Table (3): Frequency distribution of farmers according to marital status in the Gash area.
Marital
Status
Patient
(n = 100)
Healthy
(n = 100)
Total sample
(n = 200)
Freq. % Freq. % Freq. %
Married 96 96 93 93 981 12.5
Single 4 4 7 7 99 5.5
Total 100 100 100 100 022 100
3.1.1.4 Educational Level
7% and 23% among infected and healthy farmers respectively, received between basic and secondary levels of
education.59% and 72% received khalwa level of education. Illiteracy is 34% among infected and only 5% among healthy
farmers, Table 4)
Table (4): Frequency distribution of farmers according to Educational level
Source: field survey
Age (group)
Patient
(n =100)
Healthy
(n = 100)
Total sample
(n = 200)
Freq % Freq. % Freq. %
20 – 40 44 44 43 43 87 43.5
41 – 60 54 54 49 49 103 51.5
61 – 80 2 2 08 08 10 5
Total 100 100 100 100 200 100
Mean 42.68 years 43.78 years 43.23 years
Educational
Level
Patient
(n = 100)
Healthy
(n = 100)
Total sample
(n = 200)
Freq. % Freq. % Freq. %
Illiterate 34 34 5 5 39 19.5
Khalwa 59 59 72 72 131 65.5
Basic school 05 05 11 11 16 08
Medium school 01 01 06 06 07 3.5
Secondary 01 01 06 06 07 3.5
Universities 0 0 0 0 0 0
Total 100 100 100 100 200 100
ISSN 2349-7831
International Journal of Recent Research in Social Sciences and Humanities (IJRRSSH)
Vol. 1, Issue 3, pp: (16-30), Month: October - December 2014, Available at: www.paperpublications.org
Page | 21
Paper Publications
3.1.1.5 Family size
The frequency distribution of the farmers in the sample by the family size was, 65% among the infected farmers was
observed to be restricted in less than 5 individuals. On the other hand, 48% among healthy farmers was restricted between
6 and 10 individuals. The mean family size of the infected farmers was 5.08 individuals and for the healthy farmers were
7 individuals, Table (5) Table (5): Frequency distribution of farmers according to family size in the Gash area .
3.1.2 Socioeconomic factors
3.1.2.1 Secondary occupation
32% of the infected and healthy farmers do not have secondary occupation, they restrict themselves to agriculture, and
68% were engaged in other jobs besides agriculture, Table (6).
Table (6): Frequency distribution of farmers according to secondary occupation in the Gash area.
Occupation
Patient
(n = 100)
Healthy
(n = 100)
Freq. % Freq. %
labour 08 08 10 10
others 59 59 57 57
total 67 67 67 67
Source: field survey.
3.1.2.2 Total Cultivated Area
The majority of the farmers grown crops in area ranges between 1 to 5 feddans, while a very few proportion cultivate land
reaches up to 20 feddans. The mean cultivated area among the infected farmers in season 2005-2006 was found to be 2.8
feddans. Compared to 5.76 feddans among the healthy farmers table (7).
Table (7): Distribution of farmers according to the Total cultivated area/farmer in the Gash area.
Total cultivated
area/fed.
Patient
(n =100)
Healthy
(n =100)
Total sample
(n =200)
Freq. % Freq. % Freq. %
1-5 96 96 81 81 177 88.5
6-10 3 3 14 14 17 8.5
11-15 0 0 1 1 01 0.5
16-20 1 1 2 2 03 1.5
≥20 0 0 2 2 02 1
Total 100 100 100 100 200 100
Mean 2.8 (feddans) 5.76 (feddans) 4.28 (feddans)
Source: field survey.
Valid Patient
(n = 100)
Healthy
(n = 100)
Total sample
(n = 200)
Freq. % Freq. % Freq. %
5≥ 65 65 38 38 921 31.5
6 – 10 34 34 48 48 80 41
11 - 15 1 1 10 10 99 5.5
16≤ 0 0 04 04 22 02
Total 100 100 100 100 022 100
mean 5.08 individuals 7individuals 4.09 individuals
ISSN 2349-7831
International Journal of Recent Research in Social Sciences and Humanities (IJRRSSH)
Vol. 1, Issue 3, pp: (16-30), Month: October - December 2014, Available at: www.paperpublications.org
Page | 22
Paper Publications
3.1.2.3 Sowing Date and Harvesting Time
19% of infected farmers grow Sorghum off-season, compare to only 3% of healthy farmers. On the other hand, 22% of
infected farmers and 5% of healthy farmers harvested it off-suitable time, table (8).
Table (8): Shows frequency distribution of farmers according to sowing date and harvesting time of Sorghum in Gash area
Item
Sowing date Harvesting time
Patient Healthy Patient Healthy
Freq. % Freq. % Freq. % Freq. %
Unsuitable 19 19 3 3 22 22 5 5
Suitable 81 81 97 97 78 78 95 95
Total 100 100 100 100 100 100 100 100
Source: field survey.
3.1.2.4 Numbers of Daily Working Hours
The study found that the mean numbers of daily working hours of the infected farmer is 2.78 hours, compared to 10.31
hours of the healthy farmer. Table (9).
Table (9): Numbers of working daily hours /farmer in the Gash area.
Number of working
hours
Patient (n =100) Healthy (n =100) Total sample (n =200)
Freq. % Freq. % Freq. %
0 < 2 30 30 1 1 31 15.5
2 < 4 30 30 3 3 33 16.5
4 < 6 37 37 2 2 39 19.5
6 < 8 2 2 9 9 11 5.5
8 < 10 1 1 7 7 08 04
10 < 12 0 0 23 23 23 11.5
12 < 14 0 0 51 51 51 25.5
14 < 16 0 0 4 4 04 02
Total 100 100 100 100 200 100
Mean 2.78 (hours) 10.31(hours) 6.545 (hours)
Source: Field survey
3.1.2.5 Cultivation Cost
The mean cultivation cost among the infected farmers was found to be 134.6 SDG. Compared to 210.3 SDG. among the
healthy farmers, table (10).
3.1.2.6 Marketing of the Crop Sorghum
95% of both healthy and infected farmers in the Gash area marketed their crops locally; table (11)
3.1.2.7 Labour Cost
The mean labour cost among the infected farmers was found to be 135.5 SDG. Compared to 201.3 SDG. among the
healthy farmers, table (12).
3.1.2.8 Farmer Productivity
The mean output/feddan per infected farmer was found to be 2.84 sacks. Compared to 8.87 sacks/faddan of the healthy
farmers, with variation of 6.03 sacks/faddan table (13).
ISSN 2349-7831
International Journal of Recent Research in Social Sciences and Humanities (IJRRSSH)
Vol. 1, Issue 3, pp: (16-30), Month: October - December 2014, Available at: www.paperpublications.org
Page | 23
Paper Publications
Table (10): Frequency distribution of farmers according to the cultivation cost per feddan in the Gash area.
Cost (SDG) Per
feddan
Patient
(n =100)
Healthy
(n =100)
Total sample
(n =200)
Freq. % Freq. % Freq. %
0 < 50 15 15 1 1 16 08
50 < 100 4 4 5 5 09 4.5
100< 150 43 43 31 31 74 37
150 < 200 21 21 30 30 51 25.5
200 < 250 9 9 11 11 20 10
250 < 300 4 4 3 3 07 3.5
300 < 350 1 1 4 4 05 2.5
350 < 400 1 1 2 2 03 1.5
400 < 450 1 1 2 2 03 1.5
450 < 500 1 1 3 3 04 02
500 < 550 0 0 2 2 02 01
550 < 600 0 0 3 3 03 1.5
600 < 650 0 0 2 2 02 01
650 < 700 0 0 1 1 01 0.5
Total 100 100 100 100 200 100
Mean 134.6 (SDG). 210.3(SDG). 174.80 (SDG).
Table (11): Frequency distribution of farmers according to the marketing of the crop in the Gash area.
Marketing
type
Patient
(n =200)
Healthy
(n =200)
Total sample
(n =200)
Freq. % Freq. % Freq. %
Local 95 95 95 95 190 95
External 5 5 5 5 10 05
Total 100 100 100 100 200 100
Source: Data from field survey.
Table (12): Frequency distribution of farmers according to the labour cost in the Gash area.
Cost (SDG). Per
feddan
Patient
(n =100)
Healthy
(n =100)
Total sample
(n =200)
Freq. % Freq. % Freq. %
0 < 10 20 20 15 15 35 17.5
10 < 20 66 66 40 40 106 53
20 < 30 10 10 30 30 40 20
30 < 40 1 1 3 3 04 02
40 < 50 0 0 3 3 03 1.5
50 < 60 3 3 7 7 10 05
60 < 70 0 0 1 1 01 0.5
70 < 80 0 0 1 1 01 0.5
Total 100 100 100 100 200 100
Mean 135.5(SDG). 201.3(SDG). 196.75 (SDG).
ISSN 2349-7831
International Journal of Recent Research in Social Sciences and Humanities (IJRRSSH)
Vol. 1, Issue 3, pp: (16-30), Month: October - December 2014, Available at: www.paperpublications.org
Page | 24
Paper Publications
Table (13): Frequency distribution of farmers according to the farmer productivity in the Gash area.
Number of sacks
/feddan
Patient (n =100) Healthy (n =100) Total sample(n =100)
Freq. % Freq. % Freq. %
0 < 2 36 36 1 1 37 18.5
2 < 4 23 23 1 1 24 12
4 < 6 36 36 4 4 40 20
6 < 8 3 3 3 3 06 03
8 < 10 2 2 36 36 38 19
10 < 12 0 0 55 55 55 27.5
Total 100 100 100 100 200 100
Mean 2.84 (sack) 8.87 (sack ) 5.905 (sack).
Source: Data from field survey.
3.1.2.9 Crop Market Price
The mean crop market price among the infected farmers was found to be 43.5 SDG. Per sack, Compared to 49.6 SDG.
among the healthy farmers, table (14).
3.1.2.10 Annual Expenditure
Annual expenditure ranges between less than 1000 (SDG) to more than 3000 (SDG) among both healthy and infected
farmers, depending on family size. The mean annual expenditure among the infected farmers was found to be 2175 SDG.
Compared to 1889.2 SDG. among healthy farmers, table (15).
3.1.2.11 Annual Income
Annual income in the Gash area varies between less than 1000 SDG to more than 4000 SDG among the infected farmers.
While among healthy farmers reached up to 10000 (SDG). The mean annual income of the infected farmer was found to
be 300.44 (SDG), compared to 486.58 (SDG) of the healthy farmers. Farmer's annual income generates from two main
sources which are:
1- Annual farm income.
2- Annual off-farm income Table (16).
Table (14): Frequency distribution of farmers according to the crop market price in the Gash area.
Price Per sack of
Sorghum SDG.
Patient
(n =100)
Healthy
(n =100)
Total sample
(n =200)
Freq. % Freq. % Freq. %
0 < 20 13 13 1 1 14 07
20 < 40 0 0 1 1 01 0.5
40 < 60 85 85 89 89 174 87
60 < 80 2 2 9 9 11 5.5
Total 100 100 100 100 200 100
Mean 43.5 (SDG). 49.6(SDG). 46.45(SDG).
Table (15): Frequency distribution of farmers according to annual expenditure in the Gash area.
Annual expenditure
(SDG.)
Patient
(n =100)
Healthy (n=100) Total sample (n=200)
Freq. % Freq. % Freq. %
0 < 100 1 1 2 2 3 1.5
100 < 200 34 34 43 43 77 38.5
200 < 300 49 49 52 52 101 50.5
300<400 16 16 3 3 19 9.5
Total 100 100 100 100 200 100
Mean 217.5/ SDG. 188.092/ SDG. 203.9750 SDG.
ISSN 2349-7831
International Journal of Recent Research in Social Sciences and Humanities (IJRRSSH)
Vol. 1, Issue 3, pp: (16-30), Month: October - December 2014, Available at: www.paperpublications.org
Page | 25
Paper Publications
Table (16): Frequency distribution of the farmers according to annual income in the Gash area
Average
income(SDG)
Annual farm
income(SDG)
Annual off-farm
income(SDG)
Total Annual income(SDG)
Freq. Freq. Freq.
Patient Healthy Patient Healthy Patient Healthy
< 1000 28 14 35 24 6 03
100 0< 2000 37 20 41 30 13 12
200 0< 3000 20 20 8 10 12 11
3000 < 4000 10 5 16 36 48 15
4000 < 5000 5 15 0 0 21 09
5000 < 6000 0 15 0 0 0 16
6000 < 7000 0 04 0 0 0 11
7000 < 8000 0 27 0 0 0 08
8000 < 9000 0 0 0 0 0 08
9000 < 10000 0 0 0 0 0 04
10000 < 11000 0 0 0 0 0 03
Total 100 100 100 100 100 100
Mean 1651.0 3176.2 1336.1 1776.3 3004.4 4865.8
Source: field survey
3.2 Results of Correlation Analysis
This part will represent the significant correlation among the variables for the total sample (n=200). The matrix of Inter
correlation computed for the sample is presented in, (AppendixA1,2,3).
Annual income is positively correlated with:
1. Educational level (r=0.18642).
2. family size (r=0.22314).
3. Number of working daily hours (r=0.33274).
4. Annual expenditure (r=0.19273).
5. Price per unit of out put (r=0.145591).
6. Farmer's productivity (r=0.38089)
and negatively correlated with infection (r=-0.43484).
IV. DISCUSSION
This section is going to discuss the finding of the analytical results of the study, so as to evaluate the impact of TB on
farmer's income in the Gash delta.
4.1 The Impact of TB on Farmer's Annual Income in the Gash Area
The study found a significant and strong negative correlation with the farmer's annual income and disease infection (r=-
0.43484), as the farmer getting ill, his annual income decreases by 186.14 units. According to the frequency distribution
the mean annual income of the infected farmer was 3004.4 (SDG), compare to 4865.8 (SDG) of the healthy farmers, fig.
(1). The vast majority of the infected farmers (79%) earned annual income ranged 1000 < 4000 (SDG.), while the healthy
farmer's annual income may reaches up to 10000 (SDG.) fig. (2). The study concluded that the negative impact of TB on
farmer's annual income is due to its negative effect on the main factors that affect farmer's annual income in the Gash
area, which are:
ISSN 2349-7831
International Journal of Recent Research in Social Sciences and Humanities (IJRRSSH)
Vol. 1, Issue 3, pp: (16-30), Month: October - December 2014, Available at: www.paperpublications.org
Page | 26
Paper Publications
1-Farmer's Productivity: Farmer's annual income has a significant and strong positive correlation with the farmer's
productivity (r=0.38089). Actually annual farm income which is the farmer's productivity times total cultivated area times
price per unit of output, is the main component of annual income fig (3). TB has a negative impact on farmer's
productivity, thus result in a negative impact on farmer's annual income.
2-Secondary Occupation: Farmer's annual income has a significant and strong positive correlation with the secondary
occupation (r=0.35043). The mean annual off-farm income for the infected farmers was found to be 1336.1(SDG.),
compare to 1776.3 (SDG.) for the healthy farmers, fig. (3). the loss from inability to work will vary with the severity of
the disease and the age of the patient, with older patients losing more
time away from work. However, in India, which currently has the largest number of cases in the world, one study shows
that the average period of loss of wages was three months (Rajeswari et al., 1999). The impact of lost earnings will
obviously vary with the nature of the occupation.
Fig. (2) Frequency distribution of the farmers with respect
to annual income in the Gash area
0
10
20
30
40
50
60
70
< 100100 <
200
200 <
300
300 <
400
400 <
500
500 <
600
600 <
700
700 <
800
800 <
900
900 <
1000
1000
<
1100
SD G.
Frequency
Patient Frequency (n=100)
Healthy Frequency (n=100)
Total farmers Frequency (n=200)
10
Fig. (1 ) The mean annual income of the farmers in the Gash area
0
1000
2000
3000
4000
5000
6000
Farm incomeOff-farm incomeTotal income
Income Items
patient
Healthy
SD
G
ISSN 2349-7831
International Journal of Recent Research in Social Sciences and Humanities (IJRRSSH)
Vol. 1, Issue 3, pp: (16-30), Month: October - December 2014, Available at: www.paperpublications.org
Page | 27
Paper Publications
3-Educational Level: The study found that farmer's annual income has a significant positive correlation with educational
level (r=0.18642), More educated farmer generates more annual income by 65.86 (SDG.), TB patient farmer is less
educated and the chance of supplemented his annual income is low compared to the healthy farmer, this can be seemed
obvious from the distribution of the off-farm income, table (15) and fig. (3), moreover their productivity is low which
result in low annual farm income.
4-External Marketing: Healthy farmer will market his crop externally, if the crop market price in the local market
declines due to high crop supply. The infected farmer due to TB morbidity cannot do so, since TB increases fatigability.
5-Labour Cost: The mean labour cost among the infected farmers was found to be 135.5 SDG. Compare to 201.3 SDG.
This indicates that healthy farmer hires labour for the intensive labour work operations. In some cases infected farmer
hires labour to perform the field work when he was ill, most infected farmers cannot afford to hire labour to carry the
agricultural activities due to income constraints. The results in usual cases they neglected the agricultural duties.
6- Total Cultivated Area: The total area owned by the farmer in the Gash area is controlled by the Gash agricultural
scheme management, depending on the total annual flooded area and the ability of the farmer to utilize it. The study found
that TB decreases area under cultivation by 2.96 feddan. The mean cultivated area among the infected farmers was found
to be 2.8 feddans, compared to 5.76 feddans among the healthy farmers. This is due to TB disease weakened farmers
ability to work. According to WHO, a sick worker means disrupted workflow, TB results in reduced farmer's annual
income due to chronic illnesses which leads to poor crop yields due to reduction of the area under cultivation, Haddad and
Gillespie, (2001).
7-Age: Older farmer has a large family size with employer members that supplement his income, moreover, due to his
agricultural experiments his crop yield become high which increases income. Age is a very important risk factor for
tuberculosis, as it plays a role in all stages from exposure to mortality. Tuberculosis infection prevalence, i.e. the
probability of being infected at some time during one’s life, increases with age . As a result, the risk of reactivation
disease increases with age, and the risk of primary tuberculosis declines, (other things being equal), (Styblo K. (KNCV),
(1991). Progression from tuberculosis infection to pulmonary tuberculosis disease is also strongly age dependent. Smear-
positive pulmonary tuberculosis usually occurs among patients aged 15 years and over.
8-Cultivation Cost: As has been discussed above increasing cultivation cost means proper and timely agricultural
operation, high farmer's productivity hence high farmer's annual income. TB restricts all these factors thus restrict farmer's
annual income.
9- Family Size: The study found that there is a positive correlation between farmer's annual income and the number of
his family members (r=0.22314), The negative impact of TB on annual income through family size may be due to TB
mortality by causing individual death or morbidity by weakened their ability to work.
Fig. (3) Percentage of the farm and off - farm income with respect to
total income for the tow farmers samples
0
20
40
60
80
100
120
PatientHealthy
Farmers sample
Percentage
Annual farm income%
Annual off-farm income%
ISSN 2349-7831
International Journal of Recent Research in Social Sciences and Humanities (IJRRSSH)
Vol. 1, Issue 3, pp: (16-30), Month: October - December 2014, Available at: www.paperpublications.org
Page | 28
Paper Publications
10-Harvesting Time: Due to TB morbidity the infected farmer delay harvesting of the crop which from the agronomic
point of view, results in low crop yield that generates low annual income.
11-Sowing Date: Due to TB morbidity the infected farmer delay sowing of the crop which from the agronomic point of
view results in low crop yield thus generates low annual income.
12-Local Marketing: Local marketing reduces cost of transportation of the crop to the external market.
13- Number Of Working Daily Hours: Farmer's annual income has a significant and strong positive correlations with the
number of working daily hours (r=0.33274), TB reduces number of working daily hours by 7.53 hours/day which reduces
farmer's productivity by 4.29 sacks/feddan, that result in low annual income. international NGOs.
ACKNOWLEDGEMENTS
First of all, I render my prayers and thanks to the most Gracious and Merciful for carrying out this study successfully. My
great thanks to the University of Kassala for providing me with a generous scholarship to prepare studies, and my great
thanks extend to LHL for providing me with the financial support during data collection.
I have gained much knowledge and insight during the research period. I could not have reached my goals without the
assistance and support of several individuals. In great indebtedness and gratitude, I would like to express my deepest
appreciation to my main supervisor, Dr. Kamil Ibrahim Hassan for his generous assistance, keen interest, useful and
patience guidance and unlimited help. And to my co-supervisor Dr. Asma Elsony for her valuable advice and help.
I gratefully acknowledge the help rendered by Dr. Ali Abdelaziz Salih, Department of Agricultural economics, faculty of
Agriculture, University of Khartoum for his assistance and valuable advice, Dr. Shakir Farah, Gash delta agricultural
scheme, for his assistance during the primary visits to the study area, Dr. Babikir Elkhwaja, TB control programme,
Kassala State, Dr. Mawya, Institute of Endemic Diseases, University of Khartoum, Mr. Ata, Gash delta agricultural
scheme, Aroma Hospital staff worker, Regional Ministry of Health, staff worker.
I gratefully thank Dr. Adam Ali Ishag and Dr. Abdelmoneim Hussien Hassan, Faculty of agriculture and National
resources, University of Kassala, for their assistance.
My deepest thanks to my husband Hatim Mohammed Yousif for helping me during data collection and thesis typing,
without his assistance, this project could not have been possible and all of my family members.
I extend my thanks to my family, Colleagues and friends for their continuous encouragement and kind understanding
during the preparation of this work. Thanks for my students Taha Yousif and Khidir Hassan Omer, Faculty of agriculture
and National resources, University of Kassala, Fifth class, for their assistance during data collection, and thanks for all
farmers in the Gash delta agricultural scheme, for their help and cooperation.
Finally, but by no means minimally, I owe much gratitude to every one who contributed in the preparation of this study.
REFERENCES
[1] Barr, R.G. and Menzies, R. (1994). The effect of war on Tuberculosis. Results of a tuberculin survey among
displaced persons in ELSalvador and a review of the literature. Tubercle and Lung Disease 75 pp.251-259.
[2] Bergen. (1967). Human Resources Social and Cultural feature of the Jabel Mara Project area. P-130.
[3] Bernhard, H.Lies (1991). "Economic development of malaria". World Health Organization.
[4] Bruce (1993). "Essential Malariology". (3rd
ed).
[5] Collins, S. (1996) “Using Middle Upper Arm Circumference to Assess Severe Adult Malnutrition During Famine,”
Journal of the American Medical Association 276 (5): 391-395.
[6] Dhesi, A.S. Dhariwal. M.S. (1989). "Health labour supply and productivity of agricultural workers". A case study
of Amrissar. Indian Journal of Industerial.2, 225-240
ISSN 2349-7831
International Journal of Recent Research in Social Sciences and Humanities (IJRRSSH)
Vol. 1, Issue 3, pp: (16-30), Month: October - December 2014, Available at: www.paperpublications.org
Page | 29
Paper Publications
[7] Haddad L, Gillespie S and Jackson M (2001). Effective Food and Nutrition Pole Responses to HIV/AIDS: what we
know and what we need to know..
[8] Rieder HL. Socialization patterns are key to the transmission dynamics of tuberculosis. Int J Tuberc Lung Dis
1994;3:177-8.
[9] Regional Ministry of Health, (2000-2003). Annual reports.
[10] Styblo K. (KNCV), (1991). Epidemiology of tuberculosis. The Hague: Royal Netherlands Tuberculosis
Association.
APPENDIX (A1)
Matrix inter-correlation of the variables for all sample of farmers
Local
marketing
Cultivation
cost
Harvesting
time
Sowing
date
Total
cultivated
area
Family
size
Marital
status
Educational
level
Secondary
occupation
Variables
1.0000
Secondary
occupation
1.0000.24761
Educational
level
1.0000-.21894-.00058
Marital
status
1.0000.16436-.08023-.12378
Family
size
1.0000.07618.01980.17327.09660
Total
cultivated
area
1.0000.17000.09468-.04803.14086-.03174
Sowing
date
1.0000.83173.17817.08733-.05775.09997.00123
Harvesting
time
1.0000.23948.25649.15099.22415-.02395.19318-.12070
Cultivation
cost
1.0000-.02837.14980.06045.02643-.00622.03451-.05438.03724
Local
marketing
APPENDIX (A2)
Continue, Matrix inter-correlation of the variables for all sample of farmers
Local
marketing
Cultivation
cost
Harvesting
time
Sowing
date
Total
cultivated
area
Family
size
Marital
status
Educational
level
Secondary
occupation
Variables
-.03920.39302.25938.27112.25884.27615-.11862.35998.08790
Working
hours
.03243.03079.10291.10825.52058.04568.02500.18713-.0538
Labour
cost
.03521.06379.08645.09846.12624.22314-.03985.18641.33043
Annual
income
-.08198-.06896-.03633.03283.05047.10902.14916-.11015.10894
Annual
expenditure
-.09821.33266.57832.68701.15489.02866-.03775.14838-.01678
Price per unit
of output
-.10308.17694.04647.04087.03287.52419.18947-.18532-.26827Age
-.33109.14069-.06601-.09192-.02356-.00039-.11088-.01055.10247
External
marketing
.02419.36886.35346.34119.26255.32594-.12539.32818.7910
Farmer's
productivity
ISSN 2349-7831
International Journal of Recent Research in Social Sciences and Humanities (IJRRSSH)
Vol. 1, Issue 3, pp: (16-30), Month: October - December 2014, Available at: www.paperpublications.org
Page | 30
Paper Publications
APPENDIX (A3)
Continue, Matrix inter-correlation of the variables for all sample of farmers.
Farmer's
productivity
External
marketing
Age
Price per
unit of
output
Annual
expenditure
Annual
income
Labour
cost
Working
hours
Variables
1.0000
Working
hours
1.0000.16181
Labour
cost
1.0000.13439.33274
Annual
income
1.0000.19273.02704-.11243
Annual
expenditure
1.0000.05542.14559.09713.29182
Price per unit
of output
1.0000.07237.11613.11934-.03088.07504Age
1.0000.05870.06441.03137.09054-.01284.06764
External
marketing
1.0000.01474.11347.35135-.06015.38089.15792.85575
Farmer's
productivity
CRITICAL VALUE (1-tail, .05) = + or - .11668
CRITICAL VALUE (2-tail, .05) = +/- .13877
Source:( Data from field survey).

More Related Content

What's hot

Mortality & Morbidity in the 21st Century
Mortality & Morbidity in the 21st CenturyMortality & Morbidity in the 21st Century
Mortality & Morbidity in the 21st CenturyPaul Coelho, MD
 
Mortality and mobidity indicators
Mortality and mobidity indicatorsMortality and mobidity indicators
Mortality and mobidity indicatorsPriyamadhaba Behera
 
Medical and social problems of demographic processes
Medical and social problems of demographic processesMedical and social problems of demographic processes
Medical and social problems of demographic processesEneutron
 
One Health – an interdisciplinary approach in combating emerging diseases
One Health – an interdisciplinary approach in combating emerging diseasesOne Health – an interdisciplinary approach in combating emerging diseases
One Health – an interdisciplinary approach in combating emerging diseasesILRI
 
3.SANITATION VS VACCINATION - Nutrition, Sleep, Vitamin A/D, Breast-feeding a...
3.SANITATION VS VACCINATION - Nutrition, Sleep, Vitamin A/D, Breast-feeding a...3.SANITATION VS VACCINATION - Nutrition, Sleep, Vitamin A/D, Breast-feeding a...
3.SANITATION VS VACCINATION - Nutrition, Sleep, Vitamin A/D, Breast-feeding a...Antonio Bernard
 
Ozz(morbidity and mortality)
Ozz(morbidity and mortality)Ozz(morbidity and mortality)
Ozz(morbidity and mortality)Viju Rathod
 
Health transition
Health transitionHealth transition
Health transitionZakiul Alam
 
Seroepidemiological Investigation for Chagas Disease in Two Municipalities of...
Seroepidemiological Investigation for Chagas Disease in Two Municipalities of...Seroepidemiological Investigation for Chagas Disease in Two Municipalities of...
Seroepidemiological Investigation for Chagas Disease in Two Municipalities of...Agriculture Journal IJOEAR
 
Biological theories of population
Biological theories of populationBiological theories of population
Biological theories of populationAvanish Kumar Verma
 
Biopolitics an advanced introduction (lemke)
Biopolitics   an advanced introduction (lemke)Biopolitics   an advanced introduction (lemke)
Biopolitics an advanced introduction (lemke)Queljour
 
Global Climate Change and the Potential Risk of
Global Climate Change and the Potential Risk ofGlobal Climate Change and the Potential Risk of
Global Climate Change and the Potential Risk ofBrianna Ferri
 
Social Dimensions of Pandemics
Social Dimensions of PandemicsSocial Dimensions of Pandemics
Social Dimensions of PandemicsNicolae Sfetcu
 
Malthus' theory of population growth
Malthus' theory of population growthMalthus' theory of population growth
Malthus' theory of population growthyahui_tan
 
5.SANITATION VS VACCINATION- Vaccines Did Not Save Us- Charts and Statistics
5.SANITATION VS VACCINATION- Vaccines Did Not Save Us- Charts and Statistics5.SANITATION VS VACCINATION- Vaccines Did Not Save Us- Charts and Statistics
5.SANITATION VS VACCINATION- Vaccines Did Not Save Us- Charts and StatisticsAntonio Bernard
 

What's hot (17)

Mortality & Morbidity in the 21st Century
Mortality & Morbidity in the 21st CenturyMortality & Morbidity in the 21st Century
Mortality & Morbidity in the 21st Century
 
Godoyetal2004
Godoyetal2004Godoyetal2004
Godoyetal2004
 
Mortality and mobidity indicators
Mortality and mobidity indicatorsMortality and mobidity indicators
Mortality and mobidity indicators
 
Epidemiologic Transition
Epidemiologic Transition Epidemiologic Transition
Epidemiologic Transition
 
One Health Overview
One Health OverviewOne Health Overview
One Health Overview
 
Medical and social problems of demographic processes
Medical and social problems of demographic processesMedical and social problems of demographic processes
Medical and social problems of demographic processes
 
One Health – an interdisciplinary approach in combating emerging diseases
One Health – an interdisciplinary approach in combating emerging diseasesOne Health – an interdisciplinary approach in combating emerging diseases
One Health – an interdisciplinary approach in combating emerging diseases
 
3.SANITATION VS VACCINATION - Nutrition, Sleep, Vitamin A/D, Breast-feeding a...
3.SANITATION VS VACCINATION - Nutrition, Sleep, Vitamin A/D, Breast-feeding a...3.SANITATION VS VACCINATION - Nutrition, Sleep, Vitamin A/D, Breast-feeding a...
3.SANITATION VS VACCINATION - Nutrition, Sleep, Vitamin A/D, Breast-feeding a...
 
Ozz(morbidity and mortality)
Ozz(morbidity and mortality)Ozz(morbidity and mortality)
Ozz(morbidity and mortality)
 
Health transition
Health transitionHealth transition
Health transition
 
Seroepidemiological Investigation for Chagas Disease in Two Municipalities of...
Seroepidemiological Investigation for Chagas Disease in Two Municipalities of...Seroepidemiological Investigation for Chagas Disease in Two Municipalities of...
Seroepidemiological Investigation for Chagas Disease in Two Municipalities of...
 
Biological theories of population
Biological theories of populationBiological theories of population
Biological theories of population
 
Biopolitics an advanced introduction (lemke)
Biopolitics   an advanced introduction (lemke)Biopolitics   an advanced introduction (lemke)
Biopolitics an advanced introduction (lemke)
 
Global Climate Change and the Potential Risk of
Global Climate Change and the Potential Risk ofGlobal Climate Change and the Potential Risk of
Global Climate Change and the Potential Risk of
 
Social Dimensions of Pandemics
Social Dimensions of PandemicsSocial Dimensions of Pandemics
Social Dimensions of Pandemics
 
Malthus' theory of population growth
Malthus' theory of population growthMalthus' theory of population growth
Malthus' theory of population growth
 
5.SANITATION VS VACCINATION- Vaccines Did Not Save Us- Charts and Statistics
5.SANITATION VS VACCINATION- Vaccines Did Not Save Us- Charts and Statistics5.SANITATION VS VACCINATION- Vaccines Did Not Save Us- Charts and Statistics
5.SANITATION VS VACCINATION- Vaccines Did Not Save Us- Charts and Statistics
 

Viewers also liked

Boletín jurídico proceso civil de sepín
Boletín jurídico proceso civil de sepínBoletín jurídico proceso civil de sepín
Boletín jurídico proceso civil de sepínPASCUAL MARTINEZ ESPIN
 
Organizaciones del cpu
Organizaciones del cpu Organizaciones del cpu
Organizaciones del cpu Anthony Leon
 
生命禅院导游路线图
生命禅院导游路线图生命禅院导游路线图
生命禅院导游路线图Baishen Cao
 
Antes y después photoshopp
Antes y después photoshoppAntes y después photoshopp
Antes y después photoshopptecnologiaddlc
 
My Works About UT Plan (draft) 2004
My Works About UT Plan (draft) 2004My Works About UT Plan (draft) 2004
My Works About UT Plan (draft) 2004Ruby Kuo
 
Activitat tema 1-2
Activitat tema 1-2Activitat tema 1-2
Activitat tema 1-2raucru
 
Modeling Immigrant Narrative @ HathiTrust UnCamp 2015
Modeling Immigrant Narrative @ HathiTrust UnCamp 2015Modeling Immigrant Narrative @ HathiTrust UnCamp 2015
Modeling Immigrant Narrative @ HathiTrust UnCamp 2015Liz Rodrigues
 

Viewers also liked (8)

Boletín jurídico proceso civil de sepín
Boletín jurídico proceso civil de sepínBoletín jurídico proceso civil de sepín
Boletín jurídico proceso civil de sepín
 
Organizaciones del cpu
Organizaciones del cpu Organizaciones del cpu
Organizaciones del cpu
 
生命禅院导游路线图
生命禅院导游路线图生命禅院导游路线图
生命禅院导游路线图
 
Antes y después photoshopp
Antes y después photoshoppAntes y después photoshopp
Antes y después photoshopp
 
My Works About UT Plan (draft) 2004
My Works About UT Plan (draft) 2004My Works About UT Plan (draft) 2004
My Works About UT Plan (draft) 2004
 
Activitat tema 1-2
Activitat tema 1-2Activitat tema 1-2
Activitat tema 1-2
 
skole
skoleskole
skole
 
Modeling Immigrant Narrative @ HathiTrust UnCamp 2015
Modeling Immigrant Narrative @ HathiTrust UnCamp 2015Modeling Immigrant Narrative @ HathiTrust UnCamp 2015
Modeling Immigrant Narrative @ HathiTrust UnCamp 2015
 

Similar to THE IMPACT OF TUBERCULOSIS (TB) ON FARMER’S INCOME, IN EASTERN SUDAN, WITH SPECIAL REFRENCE TO GASH DELTA, KASSALA STATE, SUDAN

Challenges in Food Safety and the Possible Solutions Fizi and Mwenga Territor...
Challenges in Food Safety and the Possible Solutions Fizi and Mwenga Territor...Challenges in Food Safety and the Possible Solutions Fizi and Mwenga Territor...
Challenges in Food Safety and the Possible Solutions Fizi and Mwenga Territor...inventionjournals
 
Effect of millennium village project on livelihood of farmers in beneficiary ...
Effect of millennium village project on livelihood of farmers in beneficiary ...Effect of millennium village project on livelihood of farmers in beneficiary ...
Effect of millennium village project on livelihood of farmers in beneficiary ...Nuhu Bamalli Polytechnic Zaria
 
Influence of Farmer Group Membership on the Practice of Improved Agricultural...
Influence of Farmer Group Membership on the Practice of Improved Agricultural...Influence of Farmer Group Membership on the Practice of Improved Agricultural...
Influence of Farmer Group Membership on the Practice of Improved Agricultural...paperpublications3
 
Improved animal health for poverty reduction and sustainable livelihoods
Improved animal health for poverty reduction and sustainable livelihoodsImproved animal health for poverty reduction and sustainable livelihoods
Improved animal health for poverty reduction and sustainable livelihoodsSharadindu Shil
 
Twenty-first Century disease threats, epidemiology and One Health
Twenty-first Century disease threats, epidemiology and One HealthTwenty-first Century disease threats, epidemiology and One Health
Twenty-first Century disease threats, epidemiology and One HealthILRI
 
Journalists’ attitudes towards the coverage of agricultural and rural develop...
Journalists’ attitudes towards the coverage of agricultural and rural develop...Journalists’ attitudes towards the coverage of agricultural and rural develop...
Journalists’ attitudes towards the coverage of agricultural and rural develop...Alexander Decker
 
Farmers Adaptive Capacities to Poverty-Related Diseases in Riverine Communiti...
Farmers Adaptive Capacities to Poverty-Related Diseases in Riverine Communiti...Farmers Adaptive Capacities to Poverty-Related Diseases in Riverine Communiti...
Farmers Adaptive Capacities to Poverty-Related Diseases in Riverine Communiti...BRNSSPublicationHubI
 
Analysis of Rural Households Food Security Status in Dibatie District, Wester...
Analysis of Rural Households Food Security Status in Dibatie District, Wester...Analysis of Rural Households Food Security Status in Dibatie District, Wester...
Analysis of Rural Households Food Security Status in Dibatie District, Wester...Premier Publishers
 
Geographical Analysis of Covid 19 Its Relationship with Socio Economic Condit...
Geographical Analysis of Covid 19 Its Relationship with Socio Economic Condit...Geographical Analysis of Covid 19 Its Relationship with Socio Economic Condit...
Geographical Analysis of Covid 19 Its Relationship with Socio Economic Condit...YogeshIJTSRD
 
Assay on Vegetable Production and Marketing in Zanzaibar Island, Tanzania
Assay on Vegetable Production and Marketing in Zanzaibar Island, TanzaniaAssay on Vegetable Production and Marketing in Zanzaibar Island, Tanzania
Assay on Vegetable Production and Marketing in Zanzaibar Island, TanzaniaAgriculture Journal IJOEAR
 
Global health - People, animals, plants, the environment: towards an integrat...
Global health - People, animals, plants, the environment: towards an integrat...Global health - People, animals, plants, the environment: towards an integrat...
Global health - People, animals, plants, the environment: towards an integrat...Agropolis International
 
Communicable DiseaseChapter 12Chapter 12 Communicab.docx
Communicable DiseaseChapter 12Chapter 12 Communicab.docxCommunicable DiseaseChapter 12Chapter 12 Communicab.docx
Communicable DiseaseChapter 12Chapter 12 Communicab.docxcargillfilberto
 

Similar to THE IMPACT OF TUBERCULOSIS (TB) ON FARMER’S INCOME, IN EASTERN SUDAN, WITH SPECIAL REFRENCE TO GASH DELTA, KASSALA STATE, SUDAN (20)

Challenges in Food Safety and the Possible Solutions Fizi and Mwenga Territor...
Challenges in Food Safety and the Possible Solutions Fizi and Mwenga Territor...Challenges in Food Safety and the Possible Solutions Fizi and Mwenga Territor...
Challenges in Food Safety and the Possible Solutions Fizi and Mwenga Territor...
 
Proposal Heavily Edted
Proposal Heavily EdtedProposal Heavily Edted
Proposal Heavily Edted
 
30 32
30 3230 32
30 32
 
Effect of millennium village project on livelihood of farmers in beneficiary ...
Effect of millennium village project on livelihood of farmers in beneficiary ...Effect of millennium village project on livelihood of farmers in beneficiary ...
Effect of millennium village project on livelihood of farmers in beneficiary ...
 
Influence of Farmer Group Membership on the Practice of Improved Agricultural...
Influence of Farmer Group Membership on the Practice of Improved Agricultural...Influence of Farmer Group Membership on the Practice of Improved Agricultural...
Influence of Farmer Group Membership on the Practice of Improved Agricultural...
 
2 (1)
2 (1)2 (1)
2 (1)
 
2
22
2
 
Improved animal health for poverty reduction and sustainable livelihoods
Improved animal health for poverty reduction and sustainable livelihoodsImproved animal health for poverty reduction and sustainable livelihoods
Improved animal health for poverty reduction and sustainable livelihoods
 
Twenty-first Century disease threats, epidemiology and One Health
Twenty-first Century disease threats, epidemiology and One HealthTwenty-first Century disease threats, epidemiology and One Health
Twenty-first Century disease threats, epidemiology and One Health
 
Khan21530.pdf
Khan21530.pdfKhan21530.pdf
Khan21530.pdf
 
Journalists’ attitudes towards the coverage of agricultural and rural develop...
Journalists’ attitudes towards the coverage of agricultural and rural develop...Journalists’ attitudes towards the coverage of agricultural and rural develop...
Journalists’ attitudes towards the coverage of agricultural and rural develop...
 
Farmers Adaptive Capacities to Poverty-Related Diseases in Riverine Communiti...
Farmers Adaptive Capacities to Poverty-Related Diseases in Riverine Communiti...Farmers Adaptive Capacities to Poverty-Related Diseases in Riverine Communiti...
Farmers Adaptive Capacities to Poverty-Related Diseases in Riverine Communiti...
 
Analysis of Rural Households Food Security Status in Dibatie District, Wester...
Analysis of Rural Households Food Security Status in Dibatie District, Wester...Analysis of Rural Households Food Security Status in Dibatie District, Wester...
Analysis of Rural Households Food Security Status in Dibatie District, Wester...
 
The Roll Back Malaria Program
The Roll Back Malaria ProgramThe Roll Back Malaria Program
The Roll Back Malaria Program
 
Hepatitis B Knowledge and Vaccination Status among Ethnic Kashmiri Population...
Hepatitis B Knowledge and Vaccination Status among Ethnic Kashmiri Population...Hepatitis B Knowledge and Vaccination Status among Ethnic Kashmiri Population...
Hepatitis B Knowledge and Vaccination Status among Ethnic Kashmiri Population...
 
Geographical Analysis of Covid 19 Its Relationship with Socio Economic Condit...
Geographical Analysis of Covid 19 Its Relationship with Socio Economic Condit...Geographical Analysis of Covid 19 Its Relationship with Socio Economic Condit...
Geographical Analysis of Covid 19 Its Relationship with Socio Economic Condit...
 
Assay on Vegetable Production and Marketing in Zanzaibar Island, Tanzania
Assay on Vegetable Production and Marketing in Zanzaibar Island, TanzaniaAssay on Vegetable Production and Marketing in Zanzaibar Island, Tanzania
Assay on Vegetable Production and Marketing in Zanzaibar Island, Tanzania
 
Global health - People, animals, plants, the environment: towards an integrat...
Global health - People, animals, plants, the environment: towards an integrat...Global health - People, animals, plants, the environment: towards an integrat...
Global health - People, animals, plants, the environment: towards an integrat...
 
Impact of Pests on Stored Cereal Crops in Selected Market Sites of Axum Town,...
Impact of Pests on Stored Cereal Crops in Selected Market Sites of Axum Town,...Impact of Pests on Stored Cereal Crops in Selected Market Sites of Axum Town,...
Impact of Pests on Stored Cereal Crops in Selected Market Sites of Axum Town,...
 
Communicable DiseaseChapter 12Chapter 12 Communicab.docx
Communicable DiseaseChapter 12Chapter 12 Communicab.docxCommunicable DiseaseChapter 12Chapter 12 Communicab.docx
Communicable DiseaseChapter 12Chapter 12 Communicab.docx
 

Recently uploaded

Employee wellbeing at the workplace.pptx
Employee wellbeing at the workplace.pptxEmployee wellbeing at the workplace.pptx
Employee wellbeing at the workplace.pptxNirmalaLoungPoorunde1
 
Separation of Lanthanides/ Lanthanides and Actinides
Separation of Lanthanides/ Lanthanides and ActinidesSeparation of Lanthanides/ Lanthanides and Actinides
Separation of Lanthanides/ Lanthanides and ActinidesFatimaKhan178732
 
microwave assisted reaction. General introduction
microwave assisted reaction. General introductionmicrowave assisted reaction. General introduction
microwave assisted reaction. General introductionMaksud Ahmed
 
POINT- BIOCHEMISTRY SEM 2 ENZYMES UNIT 5.pptx
POINT- BIOCHEMISTRY SEM 2 ENZYMES UNIT 5.pptxPOINT- BIOCHEMISTRY SEM 2 ENZYMES UNIT 5.pptx
POINT- BIOCHEMISTRY SEM 2 ENZYMES UNIT 5.pptxSayali Powar
 
Crayon Activity Handout For the Crayon A
Crayon Activity Handout For the Crayon ACrayon Activity Handout For the Crayon A
Crayon Activity Handout For the Crayon AUnboundStockton
 
Science 7 - LAND and SEA BREEZE and its Characteristics
Science 7 - LAND and SEA BREEZE and its CharacteristicsScience 7 - LAND and SEA BREEZE and its Characteristics
Science 7 - LAND and SEA BREEZE and its CharacteristicsKarinaGenton
 
Alper Gobel In Media Res Media Component
Alper Gobel In Media Res Media ComponentAlper Gobel In Media Res Media Component
Alper Gobel In Media Res Media ComponentInMediaRes1
 
Contemporary philippine arts from the regions_PPT_Module_12 [Autosaved] (1).pptx
Contemporary philippine arts from the regions_PPT_Module_12 [Autosaved] (1).pptxContemporary philippine arts from the regions_PPT_Module_12 [Autosaved] (1).pptx
Contemporary philippine arts from the regions_PPT_Module_12 [Autosaved] (1).pptxRoyAbrique
 
SOCIAL AND HISTORICAL CONTEXT - LFTVD.pptx
SOCIAL AND HISTORICAL CONTEXT - LFTVD.pptxSOCIAL AND HISTORICAL CONTEXT - LFTVD.pptx
SOCIAL AND HISTORICAL CONTEXT - LFTVD.pptxiammrhaywood
 
MENTAL STATUS EXAMINATION format.docx
MENTAL     STATUS EXAMINATION format.docxMENTAL     STATUS EXAMINATION format.docx
MENTAL STATUS EXAMINATION format.docxPoojaSen20
 
Micromeritics - Fundamental and Derived Properties of Powders
Micromeritics - Fundamental and Derived Properties of PowdersMicromeritics - Fundamental and Derived Properties of Powders
Micromeritics - Fundamental and Derived Properties of PowdersChitralekhaTherkar
 
Introduction to AI in Higher Education_draft.pptx
Introduction to AI in Higher Education_draft.pptxIntroduction to AI in Higher Education_draft.pptx
Introduction to AI in Higher Education_draft.pptxpboyjonauth
 
18-04-UA_REPORT_MEDIALITERAСY_INDEX-DM_23-1-final-eng.pdf
18-04-UA_REPORT_MEDIALITERAСY_INDEX-DM_23-1-final-eng.pdf18-04-UA_REPORT_MEDIALITERAСY_INDEX-DM_23-1-final-eng.pdf
18-04-UA_REPORT_MEDIALITERAСY_INDEX-DM_23-1-final-eng.pdfssuser54595a
 
Measures of Central Tendency: Mean, Median and Mode
Measures of Central Tendency: Mean, Median and ModeMeasures of Central Tendency: Mean, Median and Mode
Measures of Central Tendency: Mean, Median and ModeThiyagu K
 
Presiding Officer Training module 2024 lok sabha elections
Presiding Officer Training module 2024 lok sabha electionsPresiding Officer Training module 2024 lok sabha elections
Presiding Officer Training module 2024 lok sabha electionsanshu789521
 
Mastering the Unannounced Regulatory Inspection
Mastering the Unannounced Regulatory InspectionMastering the Unannounced Regulatory Inspection
Mastering the Unannounced Regulatory InspectionSafetyChain Software
 
The Most Excellent Way | 1 Corinthians 13
The Most Excellent Way | 1 Corinthians 13The Most Excellent Way | 1 Corinthians 13
The Most Excellent Way | 1 Corinthians 13Steve Thomason
 
Incoming and Outgoing Shipments in 1 STEP Using Odoo 17
Incoming and Outgoing Shipments in 1 STEP Using Odoo 17Incoming and Outgoing Shipments in 1 STEP Using Odoo 17
Incoming and Outgoing Shipments in 1 STEP Using Odoo 17Celine George
 
CARE OF CHILD IN INCUBATOR..........pptx
CARE OF CHILD IN INCUBATOR..........pptxCARE OF CHILD IN INCUBATOR..........pptx
CARE OF CHILD IN INCUBATOR..........pptxGaneshChakor2
 

Recently uploaded (20)

Employee wellbeing at the workplace.pptx
Employee wellbeing at the workplace.pptxEmployee wellbeing at the workplace.pptx
Employee wellbeing at the workplace.pptx
 
Separation of Lanthanides/ Lanthanides and Actinides
Separation of Lanthanides/ Lanthanides and ActinidesSeparation of Lanthanides/ Lanthanides and Actinides
Separation of Lanthanides/ Lanthanides and Actinides
 
microwave assisted reaction. General introduction
microwave assisted reaction. General introductionmicrowave assisted reaction. General introduction
microwave assisted reaction. General introduction
 
POINT- BIOCHEMISTRY SEM 2 ENZYMES UNIT 5.pptx
POINT- BIOCHEMISTRY SEM 2 ENZYMES UNIT 5.pptxPOINT- BIOCHEMISTRY SEM 2 ENZYMES UNIT 5.pptx
POINT- BIOCHEMISTRY SEM 2 ENZYMES UNIT 5.pptx
 
Crayon Activity Handout For the Crayon A
Crayon Activity Handout For the Crayon ACrayon Activity Handout For the Crayon A
Crayon Activity Handout For the Crayon A
 
Science 7 - LAND and SEA BREEZE and its Characteristics
Science 7 - LAND and SEA BREEZE and its CharacteristicsScience 7 - LAND and SEA BREEZE and its Characteristics
Science 7 - LAND and SEA BREEZE and its Characteristics
 
Alper Gobel In Media Res Media Component
Alper Gobel In Media Res Media ComponentAlper Gobel In Media Res Media Component
Alper Gobel In Media Res Media Component
 
Contemporary philippine arts from the regions_PPT_Module_12 [Autosaved] (1).pptx
Contemporary philippine arts from the regions_PPT_Module_12 [Autosaved] (1).pptxContemporary philippine arts from the regions_PPT_Module_12 [Autosaved] (1).pptx
Contemporary philippine arts from the regions_PPT_Module_12 [Autosaved] (1).pptx
 
SOCIAL AND HISTORICAL CONTEXT - LFTVD.pptx
SOCIAL AND HISTORICAL CONTEXT - LFTVD.pptxSOCIAL AND HISTORICAL CONTEXT - LFTVD.pptx
SOCIAL AND HISTORICAL CONTEXT - LFTVD.pptx
 
TataKelola dan KamSiber Kecerdasan Buatan v022.pdf
TataKelola dan KamSiber Kecerdasan Buatan v022.pdfTataKelola dan KamSiber Kecerdasan Buatan v022.pdf
TataKelola dan KamSiber Kecerdasan Buatan v022.pdf
 
MENTAL STATUS EXAMINATION format.docx
MENTAL     STATUS EXAMINATION format.docxMENTAL     STATUS EXAMINATION format.docx
MENTAL STATUS EXAMINATION format.docx
 
Micromeritics - Fundamental and Derived Properties of Powders
Micromeritics - Fundamental and Derived Properties of PowdersMicromeritics - Fundamental and Derived Properties of Powders
Micromeritics - Fundamental and Derived Properties of Powders
 
Introduction to AI in Higher Education_draft.pptx
Introduction to AI in Higher Education_draft.pptxIntroduction to AI in Higher Education_draft.pptx
Introduction to AI in Higher Education_draft.pptx
 
18-04-UA_REPORT_MEDIALITERAСY_INDEX-DM_23-1-final-eng.pdf
18-04-UA_REPORT_MEDIALITERAСY_INDEX-DM_23-1-final-eng.pdf18-04-UA_REPORT_MEDIALITERAСY_INDEX-DM_23-1-final-eng.pdf
18-04-UA_REPORT_MEDIALITERAСY_INDEX-DM_23-1-final-eng.pdf
 
Measures of Central Tendency: Mean, Median and Mode
Measures of Central Tendency: Mean, Median and ModeMeasures of Central Tendency: Mean, Median and Mode
Measures of Central Tendency: Mean, Median and Mode
 
Presiding Officer Training module 2024 lok sabha elections
Presiding Officer Training module 2024 lok sabha electionsPresiding Officer Training module 2024 lok sabha elections
Presiding Officer Training module 2024 lok sabha elections
 
Mastering the Unannounced Regulatory Inspection
Mastering the Unannounced Regulatory InspectionMastering the Unannounced Regulatory Inspection
Mastering the Unannounced Regulatory Inspection
 
The Most Excellent Way | 1 Corinthians 13
The Most Excellent Way | 1 Corinthians 13The Most Excellent Way | 1 Corinthians 13
The Most Excellent Way | 1 Corinthians 13
 
Incoming and Outgoing Shipments in 1 STEP Using Odoo 17
Incoming and Outgoing Shipments in 1 STEP Using Odoo 17Incoming and Outgoing Shipments in 1 STEP Using Odoo 17
Incoming and Outgoing Shipments in 1 STEP Using Odoo 17
 
CARE OF CHILD IN INCUBATOR..........pptx
CARE OF CHILD IN INCUBATOR..........pptxCARE OF CHILD IN INCUBATOR..........pptx
CARE OF CHILD IN INCUBATOR..........pptx
 

THE IMPACT OF TUBERCULOSIS (TB) ON FARMER’S INCOME, IN EASTERN SUDAN, WITH SPECIAL REFRENCE TO GASH DELTA, KASSALA STATE, SUDAN

  • 1. ISSN 2349-7831 International Journal of Recent Research in Social Sciences and Humanities (IJRRSSH) Vol. 1, Issue 3, pp: (16-30), Month: October - December 2014, Available at: www.paperpublications.org Page | 16 Paper Publications THE IMPACT OF TUBERCULOSIS (TB) ON FARMER’S INCOME, IN EASTERN SUDAN, WITH SPECIAL REFRENCE TO GASH DELTA, KASSALA STATE, SUDAN 1 Sumaya Mohammed Mustafa Mohammed Elamin Department of Agricultural Economics, Faculty of Agriculture and Natural Resources, University of Kassala, Sudan Abstract: The study is designed to evaluate the impact of TB on farmer's income in the Gash delta. It depends mainly on primary and secondary data, the primary data was collected by questionnaire through direct interview of the respondents in the Gash delta agricultural scheme. The sample covers 100 farmers of TB morbidity and debility cases selected randomly from the farmers in the area, using the registration list in Aroma, Kassala and Wager hospitals after diagnosis of the disease, another 100 healthy farmers were selected using the same method of sample selection. (The total sample size was 200 farmers). Secondary data was collected from different sources related to the field of the study. Statistical procedures were used, including frequencies and inter-correlation matrix for the selected variables. The principal results are summarized in the following points: There is a strong positive correlation between farmer's annual income and the following variables: Age, Educational level, family size, Number of working daily hours, Annual expenditure, Price per unit of output, Farmer's productivity and strong negative correlation with infection. Finally, a set of recommendations were generated which aimed to reduce TB infection and disease in the Gash delta: 1- Periodic test and prevention of the disease. 2- Isolation of the patient farmers with active disease, before starting effective anti-tuberculosis therapy, so as to break the chain of transmission of the disease among the farmers. 3-Adequate TB control and management program is needed and integration into primary health care. 4- There is a need of health education to teach the farmers about TB disease and how to avoid its infection. 5- Aroma hospital should have to coordinate with the Gash delta agricultural scheme to play an effective role in reaching and looking after the patient farmers. 6- The Gash delta agricultural scheme management should have to seek a way for supporting the patient farmer's income. 7-The state government should have to compensate the infected farmers for the lost seasons. 8- Incorporate the international NGOs. I. INTRODUCTION 1.1 Tuberculosis in the Sudan Tuberculosis remains one of the formidable public health challenges in the Sudan. Meager resources and underdeveloped health infrastructure with devastating ongoing civil war since 1955 aggravate the situation. Collins, S. (1996) was the pioneer who studied tuberculosis in Sudanese and Egyptian armies. To his amazement, he found that the incidence of the disease was much Counterparts. Between 1902-1908 he reported an average annual incidence of 3.7 per 1000 in Sudanese and 1.5 per 1000 in Egyptian. From these observations Collins, S. (1996) advanced his theory of virgin soil that the isolated communities were more susceptible to infection than the advanced societies. Collins also observed that
  • 2. ISSN 2349-7831 International Journal of Recent Research in Social Sciences and Humanities (IJRRSSH) Vol. 1, Issue 3, pp: (16-30), Month: October - December 2014, Available at: www.paperpublications.org Page | 17 Paper Publications tuberculosis was less frequent or complete absent in the Sudanese tribes in their national surrounding, including their cattle. In contrast to Cummins observations Bergen. (1967). asserted that the Sudanese had much more susceptibility and predisposition particularly to Tuberculosis because pulmonary tuberculosis is very common amongst the native Sudanese. No doubt due to the fact that they live in ill-ventilated mud dwellings, the main object of which is to exclude the powerful rays of the sun. Though this statement is generally true, yet it is not accurate because the rural Sudanese never stay indoors during the day time as they go about their economic activities as example cattle rearing, cultivating, and fishing …..Etc. Moreover some communities in the semi-arid areas do not dwell in mud huts but rather in well ventilated tents. 1.2 Socioeconomic Impact of Tuberculosis Tuberculosis (TB) is essentially a disease of social and economic deterioration (Barr and Menzies, 1994). In fact the close connection between social and economic deprivation and the emergence of tuberculosis is well known, Rieder HL, (1994). Many authors have acknowledged that people who are cut-off from income Opportunities become vulnerable for diseases like tuberculosis. Tomes, for instance, reflecting in her essay review on new work about the history of tuberculosis, cites an English public health authority who, as early as 1903, noted that the drops in tuberculosis mortality closely parallels the decline in wheat prices, (Dhesi, 1989). 1.3 Problem Statement Tuberculosis is not only a health problem it is a social and economical disease.75% of cases of TB occur among the productive age group (20-50 years) .Studies have found that untreated TB can lead to 20-30% reduction of household annual wages. In the Sudan studies suggested that the rate of infection was 1.8% i.e. 1800 persons out of 100,000 persons which considered to be the highest rate of infection in the world. In the eastern region – where agriculture plays an important role in the economical and social development of the region and it satisfied the local demand for food as well as the demand in other regions in the country – The rate of TB infection increased up to 4% i.e. 4000 persons out of 100,000 persons. 1.4 Overall and Specific Objectives 1.4.1 The Overall Objective The fundamental objective of the study is to assess the socioeconomic impact of Tuberculosis (TB) on farmer's income in the Gash Delta in the eastern region of the Sudan; to achieve this objective the study sought the following specific objectives. 1.4.2 The Specific Objectives 1- Determining the farmer's personal characteristics in the study area. 2-Determining the factors affecting farmer's income in the study area. 3-study the impact of Tuberculosis (TB) on farmer's income in the study area. 4-To suggest some recommendations and issues for policies implications to enhance the state of development, encourage farmer's income in the study area. 1.5 Hypotheses to Be Tested The hypotheses listed below, are formulated to represent and satisfy the objectives of the study. Due to TB morbidity, there is a difference between the infected and healthy farmers with respect to:  Age.  Secondary occupation.  Marital status.  Educational level.
  • 3. ISSN 2349-7831 International Journal of Recent Research in Social Sciences and Humanities (IJRRSSH) Vol. 1, Issue 3, pp: (16-30), Month: October - December 2014, Available at: www.paperpublications.org Page | 18 Paper Publications  Family size. A- Agronomic activities, which include:  Total cultivated area.  Time of sowing the crop.  Time of harvesting the crop.  Cultivation cost.  Crop marketing.  Numbers of working hours per day.  Labour cost.  Crop market price.  Farmer's productivity. B- There is a strong positive correlation between farmer,s annual income and the following factors: 1. Age. 2. Educational level. 3. family size. 4. Number of working daily hours. 5. Annual expenditure. 6. Price per unit of out put. 7. Farmer's productivity. and strong negative correlation with infection. 1.6 Justification  TB is essentially a disease of social and economic deterioration.  75% of cases of tuberculosis occur among the economically productive age group (20-60 years) .  It has a negative impact on the household income due to cost of traveling to diagnosis, and nursing.  TB causes social ramification due to isolation or rejection. II. RESEARCH METHODOLOGY This section describes the methods utilized to gather data for this research, it includes: (a) The study area (b) Sample design and sample selecting Technique (c) Data analysis procedures (d) Ethical Considerations. 2.1 The study area This study was conducted in the Gash delta in Kassala state in the eastern region of the Sudan. The area represents one of the main agricultural areas in the country. It was selected based on the fact that agriculture in this area plays an important role in the economical and social development of the region and it satisfied the local demand for food as well as the
  • 4. ISSN 2349-7831 International Journal of Recent Research in Social Sciences and Humanities (IJRRSSH) Vol. 1, Issue 3, pp: (16-30), Month: October - December 2014, Available at: www.paperpublications.org Page | 19 Paper Publications demand in other regions in the country. TB prevalence rate is high. (The rate of TB infection increased up to 4% i.e. 4000 persons out of 100,000 persons) . 2.2 Methods of Data Collection 2.2.1 Population of the study All farmers in the Gash delta were considered for the purpose of this study. The population is more or less homogeneous, they are mostly of the Hadendwa tribe, they are similar in their customs and they grow the same crops. 2.2.2 Determination of Sample Size For the determination of the sample size we use the following equation :- n= K x V D K = Z value (the normal deviation of 0.90 probability) =1.78 V = the estimated variance (2.8). D = the magnitude of the difference to be detected (0.05). n = 1.78 x 2.8 = 99.7 = 100 0.05 2.2.3 Selecting Sampling Technique Random sample of 100 infected farmers were selected from the diagnostics cases (positive smear) in Aroma and Weger (Hadalya) hospitals using registered list as guide line. Another 100 healthy farmers is also selected using the same procedure of sample selection, which used as control, the total sample size is (n=200). 2.2.4 Data collection The Information were collected using two main sources of data collection: Secondary Source: depending on references such as previous studies, different ministries reports, offices. Primary Source: depending on direct observation and questionnaire technique. There are two types of questionnaires, the first one for the respondents including the following information. 2.2.5 Data Analysis The data were processed and transformed to computer coding form. Then fed to the computer to calculate the following: 1. Frequencies. 2. Inter-correlation matrix for the selected variables. III. ANALYTICAL RESULTS This chapter will present the analytical results of the study, which includes: 3.1 Frequency distribution 3.1.1 Personal characteristics of the farmers in the Gash area 3.1.1.1 Sex 100% of the farmers in the Gash area were male, Table (1). Table (1): Frequency distribution of farmers according to sex in the Gash area. Sex Patient (n = 100) Healthy (n = 100) Total sample (n = 200) Freq. % Freq. % Freq. % Male 100 100 100 100 200 100 Female 0 0 0 0 0 0 Total 100 100 100 100 022 100 Source: field survey.
  • 5. ISSN 2349-7831 International Journal of Recent Research in Social Sciences and Humanities (IJRRSSH) Vol. 1, Issue 3, pp: (16-30), Month: October - December 2014, Available at: www.paperpublications.org Page | 20 Paper Publications 3.1.1.2 Age 98% and 92% of the infected and healthy farmers respectively, fall within (20–60) year's age group. The mean age was 42.68 years for the infected farmers and 43.78 years for the healthy farmers. Table (2). Table (2): Frequency distribution of farmer's according to age in Gash area. Source: field survey. 3.1.1.3 Marital status 96% among the infected farmers in the Gash area were married, and only 4% were single. On the other hand 93% of the healthy farmers were married, while only 7% were single, table (3) Table (3): Frequency distribution of farmers according to marital status in the Gash area. Marital Status Patient (n = 100) Healthy (n = 100) Total sample (n = 200) Freq. % Freq. % Freq. % Married 96 96 93 93 981 12.5 Single 4 4 7 7 99 5.5 Total 100 100 100 100 022 100 3.1.1.4 Educational Level 7% and 23% among infected and healthy farmers respectively, received between basic and secondary levels of education.59% and 72% received khalwa level of education. Illiteracy is 34% among infected and only 5% among healthy farmers, Table 4) Table (4): Frequency distribution of farmers according to Educational level Source: field survey Age (group) Patient (n =100) Healthy (n = 100) Total sample (n = 200) Freq % Freq. % Freq. % 20 – 40 44 44 43 43 87 43.5 41 – 60 54 54 49 49 103 51.5 61 – 80 2 2 08 08 10 5 Total 100 100 100 100 200 100 Mean 42.68 years 43.78 years 43.23 years Educational Level Patient (n = 100) Healthy (n = 100) Total sample (n = 200) Freq. % Freq. % Freq. % Illiterate 34 34 5 5 39 19.5 Khalwa 59 59 72 72 131 65.5 Basic school 05 05 11 11 16 08 Medium school 01 01 06 06 07 3.5 Secondary 01 01 06 06 07 3.5 Universities 0 0 0 0 0 0 Total 100 100 100 100 200 100
  • 6. ISSN 2349-7831 International Journal of Recent Research in Social Sciences and Humanities (IJRRSSH) Vol. 1, Issue 3, pp: (16-30), Month: October - December 2014, Available at: www.paperpublications.org Page | 21 Paper Publications 3.1.1.5 Family size The frequency distribution of the farmers in the sample by the family size was, 65% among the infected farmers was observed to be restricted in less than 5 individuals. On the other hand, 48% among healthy farmers was restricted between 6 and 10 individuals. The mean family size of the infected farmers was 5.08 individuals and for the healthy farmers were 7 individuals, Table (5) Table (5): Frequency distribution of farmers according to family size in the Gash area . 3.1.2 Socioeconomic factors 3.1.2.1 Secondary occupation 32% of the infected and healthy farmers do not have secondary occupation, they restrict themselves to agriculture, and 68% were engaged in other jobs besides agriculture, Table (6). Table (6): Frequency distribution of farmers according to secondary occupation in the Gash area. Occupation Patient (n = 100) Healthy (n = 100) Freq. % Freq. % labour 08 08 10 10 others 59 59 57 57 total 67 67 67 67 Source: field survey. 3.1.2.2 Total Cultivated Area The majority of the farmers grown crops in area ranges between 1 to 5 feddans, while a very few proportion cultivate land reaches up to 20 feddans. The mean cultivated area among the infected farmers in season 2005-2006 was found to be 2.8 feddans. Compared to 5.76 feddans among the healthy farmers table (7). Table (7): Distribution of farmers according to the Total cultivated area/farmer in the Gash area. Total cultivated area/fed. Patient (n =100) Healthy (n =100) Total sample (n =200) Freq. % Freq. % Freq. % 1-5 96 96 81 81 177 88.5 6-10 3 3 14 14 17 8.5 11-15 0 0 1 1 01 0.5 16-20 1 1 2 2 03 1.5 ≥20 0 0 2 2 02 1 Total 100 100 100 100 200 100 Mean 2.8 (feddans) 5.76 (feddans) 4.28 (feddans) Source: field survey. Valid Patient (n = 100) Healthy (n = 100) Total sample (n = 200) Freq. % Freq. % Freq. % 5≥ 65 65 38 38 921 31.5 6 – 10 34 34 48 48 80 41 11 - 15 1 1 10 10 99 5.5 16≤ 0 0 04 04 22 02 Total 100 100 100 100 022 100 mean 5.08 individuals 7individuals 4.09 individuals
  • 7. ISSN 2349-7831 International Journal of Recent Research in Social Sciences and Humanities (IJRRSSH) Vol. 1, Issue 3, pp: (16-30), Month: October - December 2014, Available at: www.paperpublications.org Page | 22 Paper Publications 3.1.2.3 Sowing Date and Harvesting Time 19% of infected farmers grow Sorghum off-season, compare to only 3% of healthy farmers. On the other hand, 22% of infected farmers and 5% of healthy farmers harvested it off-suitable time, table (8). Table (8): Shows frequency distribution of farmers according to sowing date and harvesting time of Sorghum in Gash area Item Sowing date Harvesting time Patient Healthy Patient Healthy Freq. % Freq. % Freq. % Freq. % Unsuitable 19 19 3 3 22 22 5 5 Suitable 81 81 97 97 78 78 95 95 Total 100 100 100 100 100 100 100 100 Source: field survey. 3.1.2.4 Numbers of Daily Working Hours The study found that the mean numbers of daily working hours of the infected farmer is 2.78 hours, compared to 10.31 hours of the healthy farmer. Table (9). Table (9): Numbers of working daily hours /farmer in the Gash area. Number of working hours Patient (n =100) Healthy (n =100) Total sample (n =200) Freq. % Freq. % Freq. % 0 < 2 30 30 1 1 31 15.5 2 < 4 30 30 3 3 33 16.5 4 < 6 37 37 2 2 39 19.5 6 < 8 2 2 9 9 11 5.5 8 < 10 1 1 7 7 08 04 10 < 12 0 0 23 23 23 11.5 12 < 14 0 0 51 51 51 25.5 14 < 16 0 0 4 4 04 02 Total 100 100 100 100 200 100 Mean 2.78 (hours) 10.31(hours) 6.545 (hours) Source: Field survey 3.1.2.5 Cultivation Cost The mean cultivation cost among the infected farmers was found to be 134.6 SDG. Compared to 210.3 SDG. among the healthy farmers, table (10). 3.1.2.6 Marketing of the Crop Sorghum 95% of both healthy and infected farmers in the Gash area marketed their crops locally; table (11) 3.1.2.7 Labour Cost The mean labour cost among the infected farmers was found to be 135.5 SDG. Compared to 201.3 SDG. among the healthy farmers, table (12). 3.1.2.8 Farmer Productivity The mean output/feddan per infected farmer was found to be 2.84 sacks. Compared to 8.87 sacks/faddan of the healthy farmers, with variation of 6.03 sacks/faddan table (13).
  • 8. ISSN 2349-7831 International Journal of Recent Research in Social Sciences and Humanities (IJRRSSH) Vol. 1, Issue 3, pp: (16-30), Month: October - December 2014, Available at: www.paperpublications.org Page | 23 Paper Publications Table (10): Frequency distribution of farmers according to the cultivation cost per feddan in the Gash area. Cost (SDG) Per feddan Patient (n =100) Healthy (n =100) Total sample (n =200) Freq. % Freq. % Freq. % 0 < 50 15 15 1 1 16 08 50 < 100 4 4 5 5 09 4.5 100< 150 43 43 31 31 74 37 150 < 200 21 21 30 30 51 25.5 200 < 250 9 9 11 11 20 10 250 < 300 4 4 3 3 07 3.5 300 < 350 1 1 4 4 05 2.5 350 < 400 1 1 2 2 03 1.5 400 < 450 1 1 2 2 03 1.5 450 < 500 1 1 3 3 04 02 500 < 550 0 0 2 2 02 01 550 < 600 0 0 3 3 03 1.5 600 < 650 0 0 2 2 02 01 650 < 700 0 0 1 1 01 0.5 Total 100 100 100 100 200 100 Mean 134.6 (SDG). 210.3(SDG). 174.80 (SDG). Table (11): Frequency distribution of farmers according to the marketing of the crop in the Gash area. Marketing type Patient (n =200) Healthy (n =200) Total sample (n =200) Freq. % Freq. % Freq. % Local 95 95 95 95 190 95 External 5 5 5 5 10 05 Total 100 100 100 100 200 100 Source: Data from field survey. Table (12): Frequency distribution of farmers according to the labour cost in the Gash area. Cost (SDG). Per feddan Patient (n =100) Healthy (n =100) Total sample (n =200) Freq. % Freq. % Freq. % 0 < 10 20 20 15 15 35 17.5 10 < 20 66 66 40 40 106 53 20 < 30 10 10 30 30 40 20 30 < 40 1 1 3 3 04 02 40 < 50 0 0 3 3 03 1.5 50 < 60 3 3 7 7 10 05 60 < 70 0 0 1 1 01 0.5 70 < 80 0 0 1 1 01 0.5 Total 100 100 100 100 200 100 Mean 135.5(SDG). 201.3(SDG). 196.75 (SDG).
  • 9. ISSN 2349-7831 International Journal of Recent Research in Social Sciences and Humanities (IJRRSSH) Vol. 1, Issue 3, pp: (16-30), Month: October - December 2014, Available at: www.paperpublications.org Page | 24 Paper Publications Table (13): Frequency distribution of farmers according to the farmer productivity in the Gash area. Number of sacks /feddan Patient (n =100) Healthy (n =100) Total sample(n =100) Freq. % Freq. % Freq. % 0 < 2 36 36 1 1 37 18.5 2 < 4 23 23 1 1 24 12 4 < 6 36 36 4 4 40 20 6 < 8 3 3 3 3 06 03 8 < 10 2 2 36 36 38 19 10 < 12 0 0 55 55 55 27.5 Total 100 100 100 100 200 100 Mean 2.84 (sack) 8.87 (sack ) 5.905 (sack). Source: Data from field survey. 3.1.2.9 Crop Market Price The mean crop market price among the infected farmers was found to be 43.5 SDG. Per sack, Compared to 49.6 SDG. among the healthy farmers, table (14). 3.1.2.10 Annual Expenditure Annual expenditure ranges between less than 1000 (SDG) to more than 3000 (SDG) among both healthy and infected farmers, depending on family size. The mean annual expenditure among the infected farmers was found to be 2175 SDG. Compared to 1889.2 SDG. among healthy farmers, table (15). 3.1.2.11 Annual Income Annual income in the Gash area varies between less than 1000 SDG to more than 4000 SDG among the infected farmers. While among healthy farmers reached up to 10000 (SDG). The mean annual income of the infected farmer was found to be 300.44 (SDG), compared to 486.58 (SDG) of the healthy farmers. Farmer's annual income generates from two main sources which are: 1- Annual farm income. 2- Annual off-farm income Table (16). Table (14): Frequency distribution of farmers according to the crop market price in the Gash area. Price Per sack of Sorghum SDG. Patient (n =100) Healthy (n =100) Total sample (n =200) Freq. % Freq. % Freq. % 0 < 20 13 13 1 1 14 07 20 < 40 0 0 1 1 01 0.5 40 < 60 85 85 89 89 174 87 60 < 80 2 2 9 9 11 5.5 Total 100 100 100 100 200 100 Mean 43.5 (SDG). 49.6(SDG). 46.45(SDG). Table (15): Frequency distribution of farmers according to annual expenditure in the Gash area. Annual expenditure (SDG.) Patient (n =100) Healthy (n=100) Total sample (n=200) Freq. % Freq. % Freq. % 0 < 100 1 1 2 2 3 1.5 100 < 200 34 34 43 43 77 38.5 200 < 300 49 49 52 52 101 50.5 300<400 16 16 3 3 19 9.5 Total 100 100 100 100 200 100 Mean 217.5/ SDG. 188.092/ SDG. 203.9750 SDG.
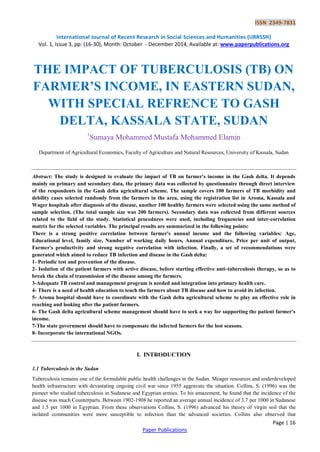
  • 10. ISSN 2349-7831 International Journal of Recent Research in Social Sciences and Humanities (IJRRSSH) Vol. 1, Issue 3, pp: (16-30), Month: October - December 2014, Available at: www.paperpublications.org Page | 25 Paper Publications Table (16): Frequency distribution of the farmers according to annual income in the Gash area Average income(SDG) Annual farm income(SDG) Annual off-farm income(SDG) Total Annual income(SDG) Freq. Freq. Freq. Patient Healthy Patient Healthy Patient Healthy < 1000 28 14 35 24 6 03 100 0< 2000 37 20 41 30 13 12 200 0< 3000 20 20 8 10 12 11 3000 < 4000 10 5 16 36 48 15 4000 < 5000 5 15 0 0 21 09 5000 < 6000 0 15 0 0 0 16 6000 < 7000 0 04 0 0 0 11 7000 < 8000 0 27 0 0 0 08 8000 < 9000 0 0 0 0 0 08 9000 < 10000 0 0 0 0 0 04 10000 < 11000 0 0 0 0 0 03 Total 100 100 100 100 100 100 Mean 1651.0 3176.2 1336.1 1776.3 3004.4 4865.8 Source: field survey 3.2 Results of Correlation Analysis This part will represent the significant correlation among the variables for the total sample (n=200). The matrix of Inter correlation computed for the sample is presented in, (AppendixA1,2,3). Annual income is positively correlated with: 1. Educational level (r=0.18642). 2. family size (r=0.22314). 3. Number of working daily hours (r=0.33274). 4. Annual expenditure (r=0.19273). 5. Price per unit of out put (r=0.145591). 6. Farmer's productivity (r=0.38089) and negatively correlated with infection (r=-0.43484). IV. DISCUSSION This section is going to discuss the finding of the analytical results of the study, so as to evaluate the impact of TB on farmer's income in the Gash delta. 4.1 The Impact of TB on Farmer's Annual Income in the Gash Area The study found a significant and strong negative correlation with the farmer's annual income and disease infection (r=- 0.43484), as the farmer getting ill, his annual income decreases by 186.14 units. According to the frequency distribution the mean annual income of the infected farmer was 3004.4 (SDG), compare to 4865.8 (SDG) of the healthy farmers, fig. (1). The vast majority of the infected farmers (79%) earned annual income ranged 1000 < 4000 (SDG.), while the healthy farmer's annual income may reaches up to 10000 (SDG.) fig. (2). The study concluded that the negative impact of TB on farmer's annual income is due to its negative effect on the main factors that affect farmer's annual income in the Gash area, which are:
  • 11. ISSN 2349-7831 International Journal of Recent Research in Social Sciences and Humanities (IJRRSSH) Vol. 1, Issue 3, pp: (16-30), Month: October - December 2014, Available at: www.paperpublications.org Page | 26 Paper Publications 1-Farmer's Productivity: Farmer's annual income has a significant and strong positive correlation with the farmer's productivity (r=0.38089). Actually annual farm income which is the farmer's productivity times total cultivated area times price per unit of output, is the main component of annual income fig (3). TB has a negative impact on farmer's productivity, thus result in a negative impact on farmer's annual income. 2-Secondary Occupation: Farmer's annual income has a significant and strong positive correlation with the secondary occupation (r=0.35043). The mean annual off-farm income for the infected farmers was found to be 1336.1(SDG.), compare to 1776.3 (SDG.) for the healthy farmers, fig. (3). the loss from inability to work will vary with the severity of the disease and the age of the patient, with older patients losing more time away from work. However, in India, which currently has the largest number of cases in the world, one study shows that the average period of loss of wages was three months (Rajeswari et al., 1999). The impact of lost earnings will obviously vary with the nature of the occupation. Fig. (2) Frequency distribution of the farmers with respect to annual income in the Gash area 0 10 20 30 40 50 60 70 < 100100 < 200 200 < 300 300 < 400 400 < 500 500 < 600 600 < 700 700 < 800 800 < 900 900 < 1000 1000 < 1100 SD G. Frequency Patient Frequency (n=100) Healthy Frequency (n=100) Total farmers Frequency (n=200) 10 Fig. (1 ) The mean annual income of the farmers in the Gash area 0 1000 2000 3000 4000 5000 6000 Farm incomeOff-farm incomeTotal income Income Items patient Healthy SD G
  • 12. ISSN 2349-7831 International Journal of Recent Research in Social Sciences and Humanities (IJRRSSH) Vol. 1, Issue 3, pp: (16-30), Month: October - December 2014, Available at: www.paperpublications.org Page | 27 Paper Publications 3-Educational Level: The study found that farmer's annual income has a significant positive correlation with educational level (r=0.18642), More educated farmer generates more annual income by 65.86 (SDG.), TB patient farmer is less educated and the chance of supplemented his annual income is low compared to the healthy farmer, this can be seemed obvious from the distribution of the off-farm income, table (15) and fig. (3), moreover their productivity is low which result in low annual farm income. 4-External Marketing: Healthy farmer will market his crop externally, if the crop market price in the local market declines due to high crop supply. The infected farmer due to TB morbidity cannot do so, since TB increases fatigability. 5-Labour Cost: The mean labour cost among the infected farmers was found to be 135.5 SDG. Compare to 201.3 SDG. This indicates that healthy farmer hires labour for the intensive labour work operations. In some cases infected farmer hires labour to perform the field work when he was ill, most infected farmers cannot afford to hire labour to carry the agricultural activities due to income constraints. The results in usual cases they neglected the agricultural duties. 6- Total Cultivated Area: The total area owned by the farmer in the Gash area is controlled by the Gash agricultural scheme management, depending on the total annual flooded area and the ability of the farmer to utilize it. The study found that TB decreases area under cultivation by 2.96 feddan. The mean cultivated area among the infected farmers was found to be 2.8 feddans, compared to 5.76 feddans among the healthy farmers. This is due to TB disease weakened farmers ability to work. According to WHO, a sick worker means disrupted workflow, TB results in reduced farmer's annual income due to chronic illnesses which leads to poor crop yields due to reduction of the area under cultivation, Haddad and Gillespie, (2001). 7-Age: Older farmer has a large family size with employer members that supplement his income, moreover, due to his agricultural experiments his crop yield become high which increases income. Age is a very important risk factor for tuberculosis, as it plays a role in all stages from exposure to mortality. Tuberculosis infection prevalence, i.e. the probability of being infected at some time during one’s life, increases with age . As a result, the risk of reactivation disease increases with age, and the risk of primary tuberculosis declines, (other things being equal), (Styblo K. (KNCV), (1991). Progression from tuberculosis infection to pulmonary tuberculosis disease is also strongly age dependent. Smear- positive pulmonary tuberculosis usually occurs among patients aged 15 years and over. 8-Cultivation Cost: As has been discussed above increasing cultivation cost means proper and timely agricultural operation, high farmer's productivity hence high farmer's annual income. TB restricts all these factors thus restrict farmer's annual income. 9- Family Size: The study found that there is a positive correlation between farmer's annual income and the number of his family members (r=0.22314), The negative impact of TB on annual income through family size may be due to TB mortality by causing individual death or morbidity by weakened their ability to work. Fig. (3) Percentage of the farm and off - farm income with respect to total income for the tow farmers samples 0 20 40 60 80 100 120 PatientHealthy Farmers sample Percentage Annual farm income% Annual off-farm income%
  • 13. ISSN 2349-7831 International Journal of Recent Research in Social Sciences and Humanities (IJRRSSH) Vol. 1, Issue 3, pp: (16-30), Month: October - December 2014, Available at: www.paperpublications.org Page | 28 Paper Publications 10-Harvesting Time: Due to TB morbidity the infected farmer delay harvesting of the crop which from the agronomic point of view, results in low crop yield that generates low annual income. 11-Sowing Date: Due to TB morbidity the infected farmer delay sowing of the crop which from the agronomic point of view results in low crop yield thus generates low annual income. 12-Local Marketing: Local marketing reduces cost of transportation of the crop to the external market. 13- Number Of Working Daily Hours: Farmer's annual income has a significant and strong positive correlations with the number of working daily hours (r=0.33274), TB reduces number of working daily hours by 7.53 hours/day which reduces farmer's productivity by 4.29 sacks/feddan, that result in low annual income. international NGOs. ACKNOWLEDGEMENTS First of all, I render my prayers and thanks to the most Gracious and Merciful for carrying out this study successfully. My great thanks to the University of Kassala for providing me with a generous scholarship to prepare studies, and my great thanks extend to LHL for providing me with the financial support during data collection. I have gained much knowledge and insight during the research period. I could not have reached my goals without the assistance and support of several individuals. In great indebtedness and gratitude, I would like to express my deepest appreciation to my main supervisor, Dr. Kamil Ibrahim Hassan for his generous assistance, keen interest, useful and patience guidance and unlimited help. And to my co-supervisor Dr. Asma Elsony for her valuable advice and help. I gratefully acknowledge the help rendered by Dr. Ali Abdelaziz Salih, Department of Agricultural economics, faculty of Agriculture, University of Khartoum for his assistance and valuable advice, Dr. Shakir Farah, Gash delta agricultural scheme, for his assistance during the primary visits to the study area, Dr. Babikir Elkhwaja, TB control programme, Kassala State, Dr. Mawya, Institute of Endemic Diseases, University of Khartoum, Mr. Ata, Gash delta agricultural scheme, Aroma Hospital staff worker, Regional Ministry of Health, staff worker. I gratefully thank Dr. Adam Ali Ishag and Dr. Abdelmoneim Hussien Hassan, Faculty of agriculture and National resources, University of Kassala, for their assistance. My deepest thanks to my husband Hatim Mohammed Yousif for helping me during data collection and thesis typing, without his assistance, this project could not have been possible and all of my family members. I extend my thanks to my family, Colleagues and friends for their continuous encouragement and kind understanding during the preparation of this work. Thanks for my students Taha Yousif and Khidir Hassan Omer, Faculty of agriculture and National resources, University of Kassala, Fifth class, for their assistance during data collection, and thanks for all farmers in the Gash delta agricultural scheme, for their help and cooperation. Finally, but by no means minimally, I owe much gratitude to every one who contributed in the preparation of this study. REFERENCES [1] Barr, R.G. and Menzies, R. (1994). The effect of war on Tuberculosis. Results of a tuberculin survey among displaced persons in ELSalvador and a review of the literature. Tubercle and Lung Disease 75 pp.251-259. [2] Bergen. (1967). Human Resources Social and Cultural feature of the Jabel Mara Project area. P-130. [3] Bernhard, H.Lies (1991). "Economic development of malaria". World Health Organization. [4] Bruce (1993). "Essential Malariology". (3rd ed). [5] Collins, S. (1996) “Using Middle Upper Arm Circumference to Assess Severe Adult Malnutrition During Famine,” Journal of the American Medical Association 276 (5): 391-395. [6] Dhesi, A.S. Dhariwal. M.S. (1989). "Health labour supply and productivity of agricultural workers". A case study of Amrissar. Indian Journal of Industerial.2, 225-240
  • 14. ISSN 2349-7831 International Journal of Recent Research in Social Sciences and Humanities (IJRRSSH) Vol. 1, Issue 3, pp: (16-30), Month: October - December 2014, Available at: www.paperpublications.org Page | 29 Paper Publications [7] Haddad L, Gillespie S and Jackson M (2001). Effective Food and Nutrition Pole Responses to HIV/AIDS: what we know and what we need to know.. [8] Rieder HL. Socialization patterns are key to the transmission dynamics of tuberculosis. Int J Tuberc Lung Dis 1994;3:177-8. [9] Regional Ministry of Health, (2000-2003). Annual reports. [10] Styblo K. (KNCV), (1991). Epidemiology of tuberculosis. The Hague: Royal Netherlands Tuberculosis Association. APPENDIX (A1) Matrix inter-correlation of the variables for all sample of farmers Local marketing Cultivation cost Harvesting time Sowing date Total cultivated area Family size Marital status Educational level Secondary occupation Variables 1.0000 Secondary occupation 1.0000.24761 Educational level 1.0000-.21894-.00058 Marital status 1.0000.16436-.08023-.12378 Family size 1.0000.07618.01980.17327.09660 Total cultivated area 1.0000.17000.09468-.04803.14086-.03174 Sowing date 1.0000.83173.17817.08733-.05775.09997.00123 Harvesting time 1.0000.23948.25649.15099.22415-.02395.19318-.12070 Cultivation cost 1.0000-.02837.14980.06045.02643-.00622.03451-.05438.03724 Local marketing APPENDIX (A2) Continue, Matrix inter-correlation of the variables for all sample of farmers Local marketing Cultivation cost Harvesting time Sowing date Total cultivated area Family size Marital status Educational level Secondary occupation Variables -.03920.39302.25938.27112.25884.27615-.11862.35998.08790 Working hours .03243.03079.10291.10825.52058.04568.02500.18713-.0538 Labour cost .03521.06379.08645.09846.12624.22314-.03985.18641.33043 Annual income -.08198-.06896-.03633.03283.05047.10902.14916-.11015.10894 Annual expenditure -.09821.33266.57832.68701.15489.02866-.03775.14838-.01678 Price per unit of output -.10308.17694.04647.04087.03287.52419.18947-.18532-.26827Age -.33109.14069-.06601-.09192-.02356-.00039-.11088-.01055.10247 External marketing .02419.36886.35346.34119.26255.32594-.12539.32818.7910 Farmer's productivity
  • 15. ISSN 2349-7831 International Journal of Recent Research in Social Sciences and Humanities (IJRRSSH) Vol. 1, Issue 3, pp: (16-30), Month: October - December 2014, Available at: www.paperpublications.org Page | 30 Paper Publications APPENDIX (A3) Continue, Matrix inter-correlation of the variables for all sample of farmers. Farmer's productivity External marketing Age Price per unit of output Annual expenditure Annual income Labour cost Working hours Variables 1.0000 Working hours 1.0000.16181 Labour cost 1.0000.13439.33274 Annual income 1.0000.19273.02704-.11243 Annual expenditure 1.0000.05542.14559.09713.29182 Price per unit of output 1.0000.07237.11613.11934-.03088.07504Age 1.0000.05870.06441.03137.09054-.01284.06764 External marketing 1.0000.01474.11347.35135-.06015.38089.15792.85575 Farmer's productivity CRITICAL VALUE (1-tail, .05) = + or - .11668 CRITICAL VALUE (2-tail, .05) = +/- .13877 Source:( Data from field survey).