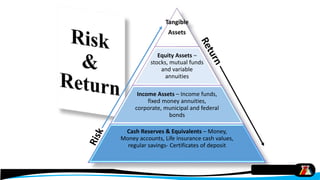
Tangible
Assets
Equity Assets –
stocks, mutual funds
and variable
annuities
Income Assets – Income funds,
fixed money annuities,
corporate, municipal and federal
bonds
Cash Reserves & Equivalents – Money,
Money accounts, Life insurance cash values,
regular savings- Certificates of deposit
Risk
In a statistical sense, RISK - defined as the likelihood that the actual return will
be different from expected return.
The greater the variability or number of possible outcomes, the greater the risk.
E.g., If an investor purchases a N500 FGN bond and cashes the bond one year
later, the investor will receive exactly N500 (plus any accrued interest).
However, suppose the same investor purchased N500 worth of common stock at
N25 per share in the expectation that the price would rise from N25 per share to
N40 in one year’s time. The investor may receive much more than N40 per share
or much less than the original N25 per share.
Risk & Return
It is every investor’s dream to be able to get a very high return without any risk
but risk and return are interrelated.
To earn higher returns investors must usually choose investments with higher
risk.
The “Holy Grail” of investing is to choose investments that maximize returns
whilst, minimizing risk.
Thus, Given a choice between two investments with the same amount of risk, a
rational investor would always take the security with the higher return.
Given two investments with the same expected return, the investor would always
choose the security with the lower risk.
Investors are risk averse, but not all to the same degree for each investor has a
different risk profile.
Some investors are willing to take on more risk than others are, if they believe
there is a higher potential for returns.
Risk can have several different meanings to different people:
• To some, risk is losing money on an investment.
• To others, it may be the prospect of losing purchasing power, if the return on
the investments does not keep up with inflation.
• Risk could also refer to not meeting return objectives.
Risk And Return
Few individuals would invest all of their funds in a
single security.
Thus, a portfolio is designed around an asset
allocation based upon the client’s propensity for risk.
The creation of a portfolio, or an asset allocation
approach, allows the investor to diversify and reduce
risk to a suitable level.
This necessitates the need to understand how risk
and return are related so that the client’s questions
can be answered intelligently.
Risk And Return
Consider the following possible investments and the types of return generated:
• An investor who buys Government of Canada bonds expects to earn interest
income (cash flow).
• An investor in common shares expects to see the stock grow in value (capital
growth) and may also be rewarded with dividends (cash flow).
• An investor who invests in physical gold bars hopes the price of gold will rise
(capital growth).
• An investor who purchases a rental property expects to receive rental income
(cash flow) and an increase in the value of the rental property (capital growth).
Risk And Return
Though investments may be purchased in anticipation of a rise in value, the
reality is that values can decline (referred to as capital loss). Below formula
defines the Expected Return of a single security.
Where:
Cash Flow = Dividends, Interest or any other type of income
Capital Gain/Loss = Ending Value – Beginning Value
Beginning Value = Initial amount invested by the investor
Ending Value = Amount investment was sold for
Expected Return = Capital Flow + Capital Gain (or – Capital Loss)
Risk And Return
Risk And Return
Returns from an investment can be measured in absolute dollars but common
practice is to express returns as a percentage or as a rate of return or yield.
To convert a dollar amount to a percentage, the usual practice is to divide the
total dollar returns by the amount invested.
%Ret = Cash Flow (Ending Value - Beginning Value)X 100
Beginning Value
Rate Of Return On An Individual Stock
A., If a stock is purchased for N10 and sold a year later for N12, the rate of
return would be:
(Zero Cash flow + (12-10)) (100) = 20%
N10
B., If a stock is purchased for N20 and sold a year later for N22 but a dividend of
N1 is received, rate of return is:
(1+(22-20)) (100) = 15%
N20
Rates of return can be ex-ante, a projection of expected returns, or ex-post,
meaning looking back at the actual returns previously earned (historical returns).
Risk Return Relationship
Treasury Bills
Bonds
Preferred Shares
Debentures
Derivatives
Common Shares
ExpectedReturn
RiskLow
High
High
History reveals that the highest rates of return were achieved by securities that
had the greatest variability or risk as measured by standard deviation
Nominal & Real Rates Of Return
Investors are more concerned with the real rate of return – the return adjusted
for the effects of inflation.
Inflation affects the value of money by reducing spending power. Thus:
Assume the return is 100% taxable, an investor with a return of 10%, having a
tax rate of 30%, would have an after tax return of 7%, calculated as 10% X
(100% – 30%).
Taking inflation into account (at 2%), the investor’s approximate real return
would be 5% (7% – 2%).
Real Return = Nominal Rate – Annual calculated Rate of Return
Risk Free Rate of Return
T-bills are the shortest-term marketable
debt security issued by governments.
T-bills often represent the risk-free
rate of return as there is essentially
zero risk associated with this type of
investment.
T-bills are considered essentially risk-
free, as all other securities must at least
pay the T-bill rate plus a risk premium
in order to entice clients into investing.
Common stocks are perceived as higher risk instruments in comparison to FGN
Bonds since the future outcomes are much less certain.
Types of risk - some include:
Inflation rate risk: inflation reduces future purchasing power and the return on
investments.
Business Risk: associated with the variability of a company’s earnings due to
such things as the possibility of a labor strike, introduction of new products, the
state of the economy, and the performance of competing firms, among others.
Risk - Types
Political risk: associated with un-favourable changes in government policies.
E.g., a government may decide to raise taxes on foreign investing, making it less
attractive to invest in the country.
Also refers to the general instability associated with investing in a particular
country.
Liquidity risk: A security that is difficult to sell suffers from liquidity risk, which
is the risk that an investor will not be able to buy or sell a security at a fair price
quickly enough due to limited buying or selling opportunities.
E.g., more than a few Nigerian bonds suffer from such risk.
Risk - Types
Interest rate risk: Risk due to changing interest rates. If interest rates rise, the
investment will fall in value; on the other hand, it will rise in value if rates fall.
Foreign exchange risk: the risk of incurring losses resulting from an
unfavorable change in exchange rates.
Investors who invest abroad or businesses that buy and sell products in foreign
markets run the risk of a loss, whenever the exchange rate changes against
foreign currencies.
Default risk: risk associated with a company being unable to make timely
interest payments or repay the principal amount of a loan when due
Risk - Types
Systematic & Non Systematic Risk
Systematic risks stem from factors like
inflation, the business cycle and high interest
rates. It is the risk associated with investing in
the capital market.
It cannot be eliminated, as these risks affect all
assets within certain classes - also referred to as
market risk.
Systematic risk cannot be diversified away; in
fact, the more a portfolio becomes diversified
within a certain asset class, the more it ends up
mirroring that market.
Non-systematic risk, or specific risk:
- the risk that the price of a specific
security or a specific group of
securities will change in price to a
different degree or in a different
direction from the market as a whole.
Specific risk can be reduced by
diversifying among a number of
securities.
Systematic & Non Systematic Risk
Measuring Risk
The three common measures of risk are Variance, Standard Deviation and Beta.
• Variance measures the extent to which the possible realized returns differ
from the expected return or the mean.
The more likely it is that the return will not be the same as the expected
return, the more risky the security.
The greater the number of possible outcomes, the greater the risk that the
outcome will not be favorable.
The greater the distance estimated between the expected return and the
possible returns, the greater the variance.
The risk of a portfolio is determined by the risk of the various securities
within that portfolio.
• Standard deviation is the measure of risk commonly applied to portfolios
and to individual securities within that portfolio. Standard deviation is the
square root of the variance.
The past performance or historical returns of securities is used to determine a
range of possible future outcomes.
The more volatile the price of a security has been in the past, the larger the
range of possible future outcomes.
The standard deviation, expressed as a percentage, gives the investor an
indication of the risk associated with an individual security or a portfolio.
The greater the standard deviation, the greater the risk.
Measuring Risk
Beta is another statistical measure that links the risk of individual equity
securities to the market as a whole.
It measures the degree to which individual stocks tend to move up and down
with the market. Again, the higher the beta, the greater the risk.
Measuring Risk
**In-depth risk management tools treated in more advanced modules.
:118 Old Ewu Road, Aviation Estate, Lagos,
:07032530965 | www.ffavifortus.com | info@ffavifortus.com

Risk Return Basics for Investing

  • 1.
    Tangible Assets Equity Assets – stocks,mutual funds and variable annuities Income Assets – Income funds, fixed money annuities, corporate, municipal and federal bonds Cash Reserves & Equivalents – Money, Money accounts, Life insurance cash values, regular savings- Certificates of deposit
  • 2.
    Risk In a statisticalsense, RISK - defined as the likelihood that the actual return will be different from expected return. The greater the variability or number of possible outcomes, the greater the risk. E.g., If an investor purchases a N500 FGN bond and cashes the bond one year later, the investor will receive exactly N500 (plus any accrued interest). However, suppose the same investor purchased N500 worth of common stock at N25 per share in the expectation that the price would rise from N25 per share to N40 in one year’s time. The investor may receive much more than N40 per share or much less than the original N25 per share.
  • 3.
    Risk & Return Itis every investor’s dream to be able to get a very high return without any risk but risk and return are interrelated. To earn higher returns investors must usually choose investments with higher risk. The “Holy Grail” of investing is to choose investments that maximize returns whilst, minimizing risk. Thus, Given a choice between two investments with the same amount of risk, a rational investor would always take the security with the higher return. Given two investments with the same expected return, the investor would always choose the security with the lower risk.
  • 4.
    Investors are riskaverse, but not all to the same degree for each investor has a different risk profile. Some investors are willing to take on more risk than others are, if they believe there is a higher potential for returns. Risk can have several different meanings to different people: • To some, risk is losing money on an investment. • To others, it may be the prospect of losing purchasing power, if the return on the investments does not keep up with inflation. • Risk could also refer to not meeting return objectives. Risk And Return
  • 5.
    Few individuals wouldinvest all of their funds in a single security. Thus, a portfolio is designed around an asset allocation based upon the client’s propensity for risk. The creation of a portfolio, or an asset allocation approach, allows the investor to diversify and reduce risk to a suitable level. This necessitates the need to understand how risk and return are related so that the client’s questions can be answered intelligently. Risk And Return
  • 6.
    Consider the followingpossible investments and the types of return generated: • An investor who buys Government of Canada bonds expects to earn interest income (cash flow). • An investor in common shares expects to see the stock grow in value (capital growth) and may also be rewarded with dividends (cash flow). • An investor who invests in physical gold bars hopes the price of gold will rise (capital growth). • An investor who purchases a rental property expects to receive rental income (cash flow) and an increase in the value of the rental property (capital growth). Risk And Return
  • 7.
    Though investments maybe purchased in anticipation of a rise in value, the reality is that values can decline (referred to as capital loss). Below formula defines the Expected Return of a single security. Where: Cash Flow = Dividends, Interest or any other type of income Capital Gain/Loss = Ending Value – Beginning Value Beginning Value = Initial amount invested by the investor Ending Value = Amount investment was sold for Expected Return = Capital Flow + Capital Gain (or – Capital Loss) Risk And Return
  • 8.
    Risk And Return Returnsfrom an investment can be measured in absolute dollars but common practice is to express returns as a percentage or as a rate of return or yield. To convert a dollar amount to a percentage, the usual practice is to divide the total dollar returns by the amount invested. %Ret = Cash Flow (Ending Value - Beginning Value)X 100 Beginning Value
  • 9.
    Rate Of ReturnOn An Individual Stock A., If a stock is purchased for N10 and sold a year later for N12, the rate of return would be: (Zero Cash flow + (12-10)) (100) = 20% N10 B., If a stock is purchased for N20 and sold a year later for N22 but a dividend of N1 is received, rate of return is: (1+(22-20)) (100) = 15% N20 Rates of return can be ex-ante, a projection of expected returns, or ex-post, meaning looking back at the actual returns previously earned (historical returns).
  • 10.
    Risk Return Relationship TreasuryBills Bonds Preferred Shares Debentures Derivatives Common Shares ExpectedReturn RiskLow High High History reveals that the highest rates of return were achieved by securities that had the greatest variability or risk as measured by standard deviation
  • 11.
    Nominal & RealRates Of Return Investors are more concerned with the real rate of return – the return adjusted for the effects of inflation. Inflation affects the value of money by reducing spending power. Thus: Assume the return is 100% taxable, an investor with a return of 10%, having a tax rate of 30%, would have an after tax return of 7%, calculated as 10% X (100% – 30%). Taking inflation into account (at 2%), the investor’s approximate real return would be 5% (7% – 2%). Real Return = Nominal Rate – Annual calculated Rate of Return
  • 12.
    Risk Free Rateof Return T-bills are the shortest-term marketable debt security issued by governments. T-bills often represent the risk-free rate of return as there is essentially zero risk associated with this type of investment. T-bills are considered essentially risk- free, as all other securities must at least pay the T-bill rate plus a risk premium in order to entice clients into investing.
  • 13.
    Common stocks areperceived as higher risk instruments in comparison to FGN Bonds since the future outcomes are much less certain. Types of risk - some include: Inflation rate risk: inflation reduces future purchasing power and the return on investments. Business Risk: associated with the variability of a company’s earnings due to such things as the possibility of a labor strike, introduction of new products, the state of the economy, and the performance of competing firms, among others. Risk - Types
  • 14.
    Political risk: associatedwith un-favourable changes in government policies. E.g., a government may decide to raise taxes on foreign investing, making it less attractive to invest in the country. Also refers to the general instability associated with investing in a particular country. Liquidity risk: A security that is difficult to sell suffers from liquidity risk, which is the risk that an investor will not be able to buy or sell a security at a fair price quickly enough due to limited buying or selling opportunities. E.g., more than a few Nigerian bonds suffer from such risk. Risk - Types
  • 15.
    Interest rate risk:Risk due to changing interest rates. If interest rates rise, the investment will fall in value; on the other hand, it will rise in value if rates fall. Foreign exchange risk: the risk of incurring losses resulting from an unfavorable change in exchange rates. Investors who invest abroad or businesses that buy and sell products in foreign markets run the risk of a loss, whenever the exchange rate changes against foreign currencies. Default risk: risk associated with a company being unable to make timely interest payments or repay the principal amount of a loan when due Risk - Types
  • 16.
    Systematic & NonSystematic Risk Systematic risks stem from factors like inflation, the business cycle and high interest rates. It is the risk associated with investing in the capital market. It cannot be eliminated, as these risks affect all assets within certain classes - also referred to as market risk. Systematic risk cannot be diversified away; in fact, the more a portfolio becomes diversified within a certain asset class, the more it ends up mirroring that market.
  • 17.
    Non-systematic risk, orspecific risk: - the risk that the price of a specific security or a specific group of securities will change in price to a different degree or in a different direction from the market as a whole. Specific risk can be reduced by diversifying among a number of securities. Systematic & Non Systematic Risk
  • 18.
    Measuring Risk The threecommon measures of risk are Variance, Standard Deviation and Beta. • Variance measures the extent to which the possible realized returns differ from the expected return or the mean. The more likely it is that the return will not be the same as the expected return, the more risky the security. The greater the number of possible outcomes, the greater the risk that the outcome will not be favorable. The greater the distance estimated between the expected return and the possible returns, the greater the variance. The risk of a portfolio is determined by the risk of the various securities within that portfolio.
  • 19.
    • Standard deviationis the measure of risk commonly applied to portfolios and to individual securities within that portfolio. Standard deviation is the square root of the variance. The past performance or historical returns of securities is used to determine a range of possible future outcomes. The more volatile the price of a security has been in the past, the larger the range of possible future outcomes. The standard deviation, expressed as a percentage, gives the investor an indication of the risk associated with an individual security or a portfolio. The greater the standard deviation, the greater the risk. Measuring Risk
  • 20.
    Beta is anotherstatistical measure that links the risk of individual equity securities to the market as a whole. It measures the degree to which individual stocks tend to move up and down with the market. Again, the higher the beta, the greater the risk. Measuring Risk **In-depth risk management tools treated in more advanced modules.
  • 21.
    :118 Old EwuRoad, Aviation Estate, Lagos, :07032530965 | www.ffavifortus.com | info@ffavifortus.com