SlideShare a Scribd company logo
1 of 5
Download to read offline
An Overview of the Electrogram Analyzer
The Electrogram Analyzer includes several data analysis features for evaluating and displaying detailed Signal, FFT,
Continuous wavelet (CWT) and CWT ISI graphs. This analyzed FFT or Continuous Wavelet value can then be
transferred to the DF column of the Results Data Grid for the selected data point. The Electrogram Analyzer is
displayed by right-clicking any cell in a row of the Results Data Grid that is populated with Data Point information, and
then clicking Display Signal. The Electrogram Analyzer can display the following data:
n Signal — The signal for the selected data point
n FFT — Fast Fourier Transformation Frequency Spectrum
n CWT — Continuous Wavelet Transform Analysis
n CWT ISI — Continuous Wavelet Transform with Inter-spike Interval Analysis
n RI — Regularity Index
n OI — Organizational Index
Back to Top
Note:  Toolbars, Dialog Boxes and Drop down menus may differ for Review Workstation as not all options / features are available
on the Review Workstation. All references to CLEARSIGN Amplifier throughout this Help System refers to both the original
CLEARSIGN Amplifier and CLEARSIGN II Amplifier.
Menus
The following menus are provided in the Electrogram Analyzer:
Options — Provides the following commands: Signal Preconditioning Filtration Options, CWT Options.
Tools — Provides the following commands: Generate Signal Preconditioning Filtration, Generate FFT,
Generate Wavelet Transformation.
Signal Graph
When the Electrogram Analyzer window is opened, a graph appears in the upper region of the Electrogram
Analyzer window. This graph represents the signal (waveform data) associated with Mapping channel for the data
point currently selected in the Results Data Grid.
Back to Top
FFT/Continuous Wavelet (CWT)/CWT ISI graph area (see Lab Note below)
The lower region of the Electrogram Analyzer contains an area for displaying several additional graphs. Each graph is
displayed by clicking the button (Calculated FFT, Continuous Wavelet (CWT) or CWT ISI) associated with the
graph you want to display.
Clicking the Calculated FFT button displays a graph of the frequency spectrum derived by use of a Fast Fourier
Transform algorithm. An example is shown below.
Back to Top
Clicking the Continuous Wavelet (CWT) button opens an area for displaying a graph of the continuous wavelet
analysis. An example is shown below.
Back to Top
Continuous Wavelet Transformation (CWT) analysis is
currently available in research mode only.
CWT capabilities - Detection of local activation times using wavelet spectrum and analysis of the set of intervals (ISI).
Clicking the CWT ISI button provides an area for displaying two graphs, one of which displays Inter Spike Interval
(ISI) from CWT values and another that displays ISH Histogram values. A small area between these two graphs is
also provided for displaying a list of calculated values (results of the Inter spike analysis) These results include the
following:
n Min ISI (ms) - minimum interval between detected activations (green squares) in CWT graph
n Max ISI (ms) - maximum interval between detected activations
n Mean ISI (ms) - average interval between detected activations
n SD of ISI (ms) - standard deviation between detected activations
n DF from mean ISI - 1000 divided by the mean ISI. In case of regular activity, this value is equal to "DF from FFT"
n DF from most frequent ISI - another measure of frequency from set of ISI intervals (1000/(most freq ISI)). In
case of non-stationary frequency, this value is equal to the dominant component.
An example is shown below.
Any area of interest in the graphs generated by the Electrogram Analyzer can be zoomed into by left clicking and
dragging the pointer down and to the right to select a portion of the graph.
The default view is easily displayed by clicking and dragging the pointer down and to the left.
Back to Top
Controls
Sends the FFT value to the DF column for the current data point.
Sends the Wavelet value to the DF column of the Results data Grid for the current data point.
Closes the Electrogram Analyzer.
Back to Top
References
Several papers are listed below that contain additional information about signal analysis methodologies:
n T. Everett, J. Moorman, L. Kok, J. Akar, and D. Haines, “Assessment of Global Atrial Fibrillation Organization to
Optimize Timing of Atrial Defibrillation”, Circulation, vol. 103, pp 2857-2861, 2001.
n M. Hayes, Statistical Digital Processing and Modeling: John Wiley & Sons, 1996.
n P. Stoica and R.L. Moses, Introduction to Spectral Analysis, Englewood Cliffs, NJ, 1997.
n P. D. Welch, “The Use of Fast Fourier Transform for Estimation of Power Spectra: A Method Based on Time
Averaging Over Short Modified Periodograms”, IEEE Transaction on Audio Electroacoustics, vol. AU-15, pp. 70-73,
1967.
n Jason NG, PH.D. and Jeffrey J. Goldberger, M.D., Understanding and Interpreting Dominant Frequency Analysis of
AF Electrograms, J Cardiovasc Electrophysiol, Vol. 18, pp. 680-685, June 2007
n Yoshihide Takahashi, M.D.; Prashanthan Sanders, M.B.B.S., PH.D.; Pierre Jais, M.D.; Meleze Hocini, M.D.; Remi
Dubois, PH.D.; Martin Rotter, M.D.; Thomas Rostock, M.D.; Chrishan J. Nalliah, BS.C.; Frederic Sacher, M.D.;
Jacques Clementy, M.D.; and Michel Haissaguerre, M.D., "Organization of Frequency Spectra of Atrial Fibrillation:
Relevance to Radiofrequency Catheter Ablation", Circulation, J Cardiovasc Electrophysiol, Vol. 17, pp. 1-7, April
2006

More Related Content

Similar to Asd

Conference Full Paper template
Conference Full Paper templateConference Full Paper template
Conference Full Paper template
Najad kk
 
Image quality in nuclear medicine
Image quality in nuclear medicineImage quality in nuclear medicine
Image quality in nuclear medicine
Rad Tech
 
spectrum analyzers ppt
spectrum analyzers pptspectrum analyzers ppt
spectrum analyzers ppt
Avinash Jadhav
 

Similar to Asd (20)

Vibration Analysis of a Frame
Vibration Analysis of a FrameVibration Analysis of a Frame
Vibration Analysis of a Frame
 
FPGA IMPLEMENTATION OF HUANG HILBERT TRANSFORM FOR CLASSIFICATION OF EPILEPTI...
FPGA IMPLEMENTATION OF HUANG HILBERT TRANSFORM FOR CLASSIFICATION OF EPILEPTI...FPGA IMPLEMENTATION OF HUANG HILBERT TRANSFORM FOR CLASSIFICATION OF EPILEPTI...
FPGA IMPLEMENTATION OF HUANG HILBERT TRANSFORM FOR CLASSIFICATION OF EPILEPTI...
 
DE-NOISING OF ECG USING WAVELETS AND MULTIWAVELETS
DE-NOISING OF ECG  USING WAVELETS  AND MULTIWAVELETS     DE-NOISING OF ECG  USING WAVELETS  AND MULTIWAVELETS
DE-NOISING OF ECG USING WAVELETS AND MULTIWAVELETS
 
Emi fifth-sem-spectrum-analyzer
Emi fifth-sem-spectrum-analyzerEmi fifth-sem-spectrum-analyzer
Emi fifth-sem-spectrum-analyzer
 
The application wavelet transform algorithm in testing adc effective number o...
The application wavelet transform algorithm in testing adc effective number o...The application wavelet transform algorithm in testing adc effective number o...
The application wavelet transform algorithm in testing adc effective number o...
 
Electrocardiogram Denoised Signal by Discrete Wavelet Transform and Continuou...
Electrocardiogram Denoised Signal by Discrete Wavelet Transform and Continuou...Electrocardiogram Denoised Signal by Discrete Wavelet Transform and Continuou...
Electrocardiogram Denoised Signal by Discrete Wavelet Transform and Continuou...
 
FPGA IMPLEMENTATION OF HUANG HILBERT TRANSFORM FOR CLASSIFICATION OF EPILEPTI...
FPGA IMPLEMENTATION OF HUANG HILBERT TRANSFORM FOR CLASSIFICATION OF EPILEPTI...FPGA IMPLEMENTATION OF HUANG HILBERT TRANSFORM FOR CLASSIFICATION OF EPILEPTI...
FPGA IMPLEMENTATION OF HUANG HILBERT TRANSFORM FOR CLASSIFICATION OF EPILEPTI...
 
Multidimensional Approaches for Noise Cancellation of ECG signal
Multidimensional Approaches for Noise Cancellation of ECG signalMultidimensional Approaches for Noise Cancellation of ECG signal
Multidimensional Approaches for Noise Cancellation of ECG signal
 
Conference Full Paper template
Conference Full Paper templateConference Full Paper template
Conference Full Paper template
 
A Utilisation of Improved Gabor Transform for Harmonic Signals Detection and ...
A Utilisation of Improved Gabor Transform for Harmonic Signals Detection and ...A Utilisation of Improved Gabor Transform for Harmonic Signals Detection and ...
A Utilisation of Improved Gabor Transform for Harmonic Signals Detection and ...
 
A Utilisation of Improved Gabor Transform for Harmonic Signals Detection and ...
A Utilisation of Improved Gabor Transform for Harmonic Signals Detection and ...A Utilisation of Improved Gabor Transform for Harmonic Signals Detection and ...
A Utilisation of Improved Gabor Transform for Harmonic Signals Detection and ...
 
I027050057
I027050057I027050057
I027050057
 
Load Frequency Control, Integral control, Fuzzy Logic.
Load Frequency Control, Integral control, Fuzzy Logic.Load Frequency Control, Integral control, Fuzzy Logic.
Load Frequency Control, Integral control, Fuzzy Logic.
 
A Systematic Approach to Improve BOC Power Spectrum for GNSS
A Systematic Approach to Improve BOC Power Spectrum for GNSSA Systematic Approach to Improve BOC Power Spectrum for GNSS
A Systematic Approach to Improve BOC Power Spectrum for GNSS
 
Implementation of adaptive stft algorithm for lfm signals
Implementation of adaptive stft algorithm for lfm signalsImplementation of adaptive stft algorithm for lfm signals
Implementation of adaptive stft algorithm for lfm signals
 
Ac lab final_report
Ac lab final_reportAc lab final_report
Ac lab final_report
 
Wavelet Multi-resolution Analysis of High Frequency FX Rates
Wavelet Multi-resolution Analysis of High Frequency FX RatesWavelet Multi-resolution Analysis of High Frequency FX Rates
Wavelet Multi-resolution Analysis of High Frequency FX Rates
 
Image quality in nuclear medicine
Image quality in nuclear medicineImage quality in nuclear medicine
Image quality in nuclear medicine
 
spectrum analyzers ppt
spectrum analyzers pptspectrum analyzers ppt
spectrum analyzers ppt
 
Error entropy minimization for brain image registration using hilbert huang t...
Error entropy minimization for brain image registration using hilbert huang t...Error entropy minimization for brain image registration using hilbert huang t...
Error entropy minimization for brain image registration using hilbert huang t...
 

Recently uploaded

Battery Management System Functions (Flowchart of BMS Operations)
Battery Management System Functions (Flowchart of BMS Operations)Battery Management System Functions (Flowchart of BMS Operations)
Battery Management System Functions (Flowchart of BMS Operations)
Electric Vehicle Geek
 
Solar Photovoltaic Plant Project Proposal by Slidesgo.pptx
Solar Photovoltaic Plant Project Proposal by Slidesgo.pptxSolar Photovoltaic Plant Project Proposal by Slidesgo.pptx
Solar Photovoltaic Plant Project Proposal by Slidesgo.pptx
AmarHaddad
 
Car Seat Covers and Seat Protection Guide
Car Seat Covers and Seat Protection GuideCar Seat Covers and Seat Protection Guide
Car Seat Covers and Seat Protection Guide
AskXX.com
 
Vina Score and Vin Min for almost all the models 2024
Vina Score and Vin Min for almost all the models 2024Vina Score and Vin Min for almost all the models 2024
Vina Score and Vin Min for almost all the models 2024
jipohal318
 

Recently uploaded (20)

Introduction to Automotive Bootloader | Programming Sequence
Introduction to Automotive Bootloader | Programming SequenceIntroduction to Automotive Bootloader | Programming Sequence
Introduction to Automotive Bootloader | Programming Sequence
 
Basic of Firmware & Embedded Software Programming in C
Basic of Firmware & Embedded Software Programming in CBasic of Firmware & Embedded Software Programming in C
Basic of Firmware & Embedded Software Programming in C
 
Automotive Bootloader Complete Guide with UDS Frame Format
Automotive Bootloader Complete Guide with UDS Frame FormatAutomotive Bootloader Complete Guide with UDS Frame Format
Automotive Bootloader Complete Guide with UDS Frame Format
 
Battery Management System Functions (Flowchart of BMS Operations)
Battery Management System Functions (Flowchart of BMS Operations)Battery Management System Functions (Flowchart of BMS Operations)
Battery Management System Functions (Flowchart of BMS Operations)
 
What Should BMW Owners Know About Steptronic Transmission Problems
What Should BMW Owners Know About Steptronic Transmission ProblemsWhat Should BMW Owners Know About Steptronic Transmission Problems
What Should BMW Owners Know About Steptronic Transmission Problems
 
technical report on EV. EVs can offer benefitssuch as lower operating costs a...
technical report on EV. EVs can offer benefitssuch as lower operating costs a...technical report on EV. EVs can offer benefitssuch as lower operating costs a...
technical report on EV. EVs can offer benefitssuch as lower operating costs a...
 
Solar Photovoltaic Plant Project Proposal by Slidesgo.pptx
Solar Photovoltaic Plant Project Proposal by Slidesgo.pptxSolar Photovoltaic Plant Project Proposal by Slidesgo.pptx
Solar Photovoltaic Plant Project Proposal by Slidesgo.pptx
 
Introduction to UDS over CAN | UDS Service
Introduction to UDS over CAN | UDS ServiceIntroduction to UDS over CAN | UDS Service
Introduction to UDS over CAN | UDS Service
 
Car Audio Systems Enhancing Your Driving Experience
Car Audio Systems Enhancing Your Driving ExperienceCar Audio Systems Enhancing Your Driving Experience
Car Audio Systems Enhancing Your Driving Experience
 
Torque converter In automobile engineering
Torque converter In automobile engineeringTorque converter In automobile engineering
Torque converter In automobile engineering
 
Car Seat Covers and Seat Protection Guide
Car Seat Covers and Seat Protection GuideCar Seat Covers and Seat Protection Guide
Car Seat Covers and Seat Protection Guide
 
Toyota Yaris service manual Free.pdf Toyota Yaris Service manual
Toyota Yaris service manual Free.pdf  Toyota Yaris Service manualToyota Yaris service manual Free.pdf  Toyota Yaris Service manual
Toyota Yaris service manual Free.pdf Toyota Yaris Service manual
 
-VDA-Special-Characteristics Special characteristics.pdf
-VDA-Special-Characteristics Special characteristics.pdf-VDA-Special-Characteristics Special characteristics.pdf
-VDA-Special-Characteristics Special characteristics.pdf
 
Vina Score and Vin Min for almost all the models 2024
Vina Score and Vin Min for almost all the models 2024Vina Score and Vin Min for almost all the models 2024
Vina Score and Vin Min for almost all the models 2024
 
Quicker and better: South Korea’s new high-speed train 'EMU-320'
Quicker and better: South Korea’s new high-speed train 'EMU-320'Quicker and better: South Korea’s new high-speed train 'EMU-320'
Quicker and better: South Korea’s new high-speed train 'EMU-320'
 
CAMIONES TOYOTA N04C- Engine y HINO 300.
CAMIONES TOYOTA N04C- Engine y HINO 300.CAMIONES TOYOTA N04C- Engine y HINO 300.
CAMIONES TOYOTA N04C- Engine y HINO 300.
 
Is Your Porsche Cayenne Radio On The Fritz Here's What It Could Mean
Is Your Porsche Cayenne Radio On The Fritz Here's What It Could MeanIs Your Porsche Cayenne Radio On The Fritz Here's What It Could Mean
Is Your Porsche Cayenne Radio On The Fritz Here's What It Could Mean
 
Battery Management System Circuit Diagram.pdf
Battery Management System Circuit Diagram.pdfBattery Management System Circuit Diagram.pdf
Battery Management System Circuit Diagram.pdf
 
Why Won't Your Audi A3 Shift Into Reverse Gear Let's Investigate
Why Won't Your Audi A3 Shift Into Reverse Gear Let's InvestigateWhy Won't Your Audi A3 Shift Into Reverse Gear Let's Investigate
Why Won't Your Audi A3 Shift Into Reverse Gear Let's Investigate
 
Timer Handling in UDS | S3 Server Timer | P2 and P2 Start Timer
Timer Handling in UDS | S3 Server Timer | P2 and P2 Start TimerTimer Handling in UDS | S3 Server Timer | P2 and P2 Start Timer
Timer Handling in UDS | S3 Server Timer | P2 and P2 Start Timer
 

Asd

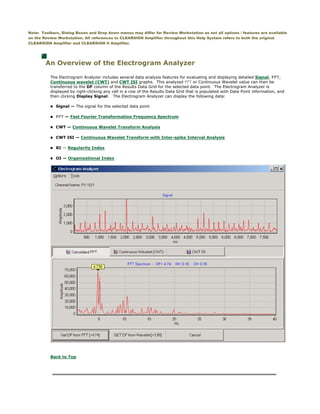
  • 1. An Overview of the Electrogram Analyzer The Electrogram Analyzer includes several data analysis features for evaluating and displaying detailed Signal, FFT, Continuous wavelet (CWT) and CWT ISI graphs. This analyzed FFT or Continuous Wavelet value can then be transferred to the DF column of the Results Data Grid for the selected data point. The Electrogram Analyzer is displayed by right-clicking any cell in a row of the Results Data Grid that is populated with Data Point information, and then clicking Display Signal. The Electrogram Analyzer can display the following data: n Signal — The signal for the selected data point n FFT — Fast Fourier Transformation Frequency Spectrum n CWT — Continuous Wavelet Transform Analysis n CWT ISI — Continuous Wavelet Transform with Inter-spike Interval Analysis n RI — Regularity Index n OI — Organizational Index Back to Top Note:  Toolbars, Dialog Boxes and Drop down menus may differ for Review Workstation as not all options / features are available on the Review Workstation. All references to CLEARSIGN Amplifier throughout this Help System refers to both the original CLEARSIGN Amplifier and CLEARSIGN II Amplifier.
  • 2. Menus The following menus are provided in the Electrogram Analyzer: Options — Provides the following commands: Signal Preconditioning Filtration Options, CWT Options. Tools — Provides the following commands: Generate Signal Preconditioning Filtration, Generate FFT, Generate Wavelet Transformation. Signal Graph When the Electrogram Analyzer window is opened, a graph appears in the upper region of the Electrogram Analyzer window. This graph represents the signal (waveform data) associated with Mapping channel for the data point currently selected in the Results Data Grid. Back to Top FFT/Continuous Wavelet (CWT)/CWT ISI graph area (see Lab Note below) The lower region of the Electrogram Analyzer contains an area for displaying several additional graphs. Each graph is displayed by clicking the button (Calculated FFT, Continuous Wavelet (CWT) or CWT ISI) associated with the graph you want to display. Clicking the Calculated FFT button displays a graph of the frequency spectrum derived by use of a Fast Fourier Transform algorithm. An example is shown below.
  • 3. Back to Top Clicking the Continuous Wavelet (CWT) button opens an area for displaying a graph of the continuous wavelet analysis. An example is shown below. Back to Top Continuous Wavelet Transformation (CWT) analysis is currently available in research mode only.
  • 4. CWT capabilities - Detection of local activation times using wavelet spectrum and analysis of the set of intervals (ISI). Clicking the CWT ISI button provides an area for displaying two graphs, one of which displays Inter Spike Interval (ISI) from CWT values and another that displays ISH Histogram values. A small area between these two graphs is also provided for displaying a list of calculated values (results of the Inter spike analysis) These results include the following: n Min ISI (ms) - minimum interval between detected activations (green squares) in CWT graph n Max ISI (ms) - maximum interval between detected activations n Mean ISI (ms) - average interval between detected activations n SD of ISI (ms) - standard deviation between detected activations n DF from mean ISI - 1000 divided by the mean ISI. In case of regular activity, this value is equal to "DF from FFT" n DF from most frequent ISI - another measure of frequency from set of ISI intervals (1000/(most freq ISI)). In case of non-stationary frequency, this value is equal to the dominant component. An example is shown below. Any area of interest in the graphs generated by the Electrogram Analyzer can be zoomed into by left clicking and dragging the pointer down and to the right to select a portion of the graph. The default view is easily displayed by clicking and dragging the pointer down and to the left. Back to Top Controls Sends the FFT value to the DF column for the current data point.
  • 5. Sends the Wavelet value to the DF column of the Results data Grid for the current data point. Closes the Electrogram Analyzer. Back to Top References Several papers are listed below that contain additional information about signal analysis methodologies: n T. Everett, J. Moorman, L. Kok, J. Akar, and D. Haines, “Assessment of Global Atrial Fibrillation Organization to Optimize Timing of Atrial Defibrillation”, Circulation, vol. 103, pp 2857-2861, 2001. n M. Hayes, Statistical Digital Processing and Modeling: John Wiley & Sons, 1996. n P. Stoica and R.L. Moses, Introduction to Spectral Analysis, Englewood Cliffs, NJ, 1997. n P. D. Welch, “The Use of Fast Fourier Transform for Estimation of Power Spectra: A Method Based on Time Averaging Over Short Modified Periodograms”, IEEE Transaction on Audio Electroacoustics, vol. AU-15, pp. 70-73, 1967. n Jason NG, PH.D. and Jeffrey J. Goldberger, M.D., Understanding and Interpreting Dominant Frequency Analysis of AF Electrograms, J Cardiovasc Electrophysiol, Vol. 18, pp. 680-685, June 2007 n Yoshihide Takahashi, M.D.; Prashanthan Sanders, M.B.B.S., PH.D.; Pierre Jais, M.D.; Meleze Hocini, M.D.; Remi Dubois, PH.D.; Martin Rotter, M.D.; Thomas Rostock, M.D.; Chrishan J. Nalliah, BS.C.; Frederic Sacher, M.D.; Jacques Clementy, M.D.; and Michel Haissaguerre, M.D., "Organization of Frequency Spectra of Atrial Fibrillation: Relevance to Radiofrequency Catheter Ablation", Circulation, J Cardiovasc Electrophysiol, Vol. 17, pp. 1-7, April 2006