SlideShare a Scribd company logo
1 of 4
1
Statistics, Practice Test 5B (Part Two)
Multinomial Experiments & Contingency Tables
Name: ______________________________ Student ID: _______________________
Instructions: Read this Mini Lecture or your text, or study the tutorials online
thoroughly to be able to handle this last Sample Test.
Mini Lecture:
Multinomial Experiments & ContingencyTables
Definition:
A Multinomial Experiment is an experiment that meets the following conditions:
1. The number of trials is fixed.
2. The trials are independent.
3. All outcomes of each trial must be classified into exactly one of several
different categories.
4. The probabilities for the different categories remain constant for each trial.
Goodness-of-fit Test in Multinomial Experiments:
Definition
A goodness-of-fit test is used to test the hypothesis that an observed frequency
distribution fits (or conforms to) some claimed distribution.
0 represents the observed frequency of an outcome
E represents the expected frequency of an outcome
k represents the number of different categories or outcomes
n represents the total number of trials
If all expected frequencies are equal, then
n
E
k
 , the sum of all observed frequencies divided by the number of categories.
If the expected frequencies are not all equal:
E np , each expected frequency is found by multiplying the sum of all observed
frequencies by the probability for the category.
2
Test Statistic:
 
2
2 O E
E


 
Critical Values
 Found in Table A-4 using k – 1 degrees of freedom where k = number of
categories
 Goodness-of-fit hypothesis tests are always right-tailed.
Contingency Tables: Independence and Homogeneity
ContingencyTable (or two-wayfrequency table)
Definition
A contingency table is a table in which frequencies correspond to two variables.
(One variable is used to categorize rows, and a second variable is used to categorize
columns.) Contingency tables have at least two rows and at least two columns.
Test of Independence
This method tests the null hypothesis that the row variable and column variable in a
contingency table are not related. (The null hypothesis is the statement that the row and
column variables are independent.)
Assumptions
 The sample data are randomly selected.
 The null hypothesis H0 is the statement that the row and column variables are
independent; the alternative hypothesis H1 is the statement that the row and
column variables are dependent.
 For every cell in the contingency table, the expected frequency E is at least 5.
(There is no requirement that every observed frequency must be at least 5.)
Test of Independence
Test Statistic:
 
2
2 O E
E


 
Critical Values
1. Found in Table A-4 using: degrees of freedom = (r – 1)(c – 1)
r is the number of rows and c is the number of columns
2. Tests of Independence are always right-tailed.
3
Expected Frequency for Contingency Tables
 
 
 
 
Rowtotal Columntotal
E np Grandtotal
Grandtotal Grandtotal
   
  
 
rowtotal columntotal
E
Grandtotal

Grand Total = Total number of all observed frequencies in the table
Test of Homogeneity
In a test of homogeneity, we test the claim that different populations have the
same proportions of some characteristics.
How to distinguish between a test of homogeneity and a test for independence:
Were predetermined sample sizes used for different populations (are they similar in
nature?) (test of homogeneity,), or was one big sample drawn so both row and column
totals were determined randomly (test of independence)?
Statistics, Practice Test 5B
Multinomial Experiments & Contingency Tables
Name: ______________________________ Student ID: _______________________
Instructions: Print out the following pages that contain the Sample Test, solve all
problems, show your work completely, and bring it on the day of the Final on campus
exam. Show all your work for full credit.
1) Goodness-of-fit Test in Multinomial Experiments
Here are the observed frequencies from four categories: 5, 6, 8, and 13. At 0.05
significance level, test the claim that the four categories are all equally likely.
A. State the null and alternative hypothesis.
B. What is the expected frequency for each of the four categories?
C. What is the value of the test statistic?
D. Find the critical value(s).
E. Make a decision
4
2) Goodness-of-fit Test in Multinomial Experiments: A professor
asked 40 of his students to identify the tire they would select as a flat tire of a car
carrying 4 students who misses a test (an excuse). The following table summarizes the
result, Use a 0.05 significance level to test the claim that all 4 tires have equal
proportions of being claimed as flat.
Tire Left Front Right Front Left Rear Right Rear
Number selected 11 15 8 6
3) Test of Independence Using a 0.05 significance level, test the claim that
when the Titanic sank, whether someone survived or died is independent of whether
that person is a man, woman, boy, or girl.
4) Test of Homogeneity) Using the following table, with a 0.05 significance
level, test the effect of pollster gender on survey responses by men.

More Related Content

What's hot

Wilcoxon signed rank test
Wilcoxon signed rank testWilcoxon signed rank test
Wilcoxon signed rank testBiswash Sapkota
 
Significance Tests
Significance TestsSignificance Tests
Significance TestsNandithaPJ
 
Anova in easyest way
Anova in easyest wayAnova in easyest way
Anova in easyest wayBidyut Ghosh
 
QNT 275 Inspiring Innovation / tutorialrank.com
QNT 275 Inspiring Innovation / tutorialrank.comQNT 275 Inspiring Innovation / tutorialrank.com
QNT 275 Inspiring Innovation / tutorialrank.comBromleyz33
 
T-test in statistics for data science
T-test in statistics for data science T-test in statistics for data science
T-test in statistics for data science Learnbay Datascience
 
Discriminant analysis
Discriminant analysisDiscriminant analysis
Discriminant analysisWansuklangk
 
Chi square test presentation
Chi square test presentationChi square test presentation
Chi square test presentationMD ASADUZZAMAN
 
Item Response Theory in Constructing Measures
Item Response Theory in Constructing MeasuresItem Response Theory in Constructing Measures
Item Response Theory in Constructing MeasuresCarlo Magno
 
Studentt test2-120315062933-phpapp02
Studentt test2-120315062933-phpapp02Studentt test2-120315062933-phpapp02
Studentt test2-120315062933-phpapp02Tamash Majumdar
 
Completely randomized-design
Completely randomized-designCompletely randomized-design
Completely randomized-designRiza Joy Palomar
 

What's hot (19)

Wilcoxon signed rank test
Wilcoxon signed rank testWilcoxon signed rank test
Wilcoxon signed rank test
 
Significance Tests
Significance TestsSignificance Tests
Significance Tests
 
The t test
The t testThe t test
The t test
 
Fufal bhavin
Fufal bhavinFufal bhavin
Fufal bhavin
 
Anova in easyest way
Anova in easyest wayAnova in easyest way
Anova in easyest way
 
QNT 275 Inspiring Innovation / tutorialrank.com
QNT 275 Inspiring Innovation / tutorialrank.comQNT 275 Inspiring Innovation / tutorialrank.com
QNT 275 Inspiring Innovation / tutorialrank.com
 
Contingency tables
Contingency tables  Contingency tables
Contingency tables
 
T-test in statistics for data science
T-test in statistics for data science T-test in statistics for data science
T-test in statistics for data science
 
Two variances or standard deviations
Two variances or standard deviations  Two variances or standard deviations
Two variances or standard deviations
 
Discriminant analysis
Discriminant analysisDiscriminant analysis
Discriminant analysis
 
Chi square test presentation
Chi square test presentationChi square test presentation
Chi square test presentation
 
Item Response Theory in Constructing Measures
Item Response Theory in Constructing MeasuresItem Response Theory in Constructing Measures
Item Response Theory in Constructing Measures
 
Analyzing Results
Analyzing ResultsAnalyzing Results
Analyzing Results
 
Student T - test
Student T -  testStudent T -  test
Student T - test
 
Discriminant analysis
Discriminant analysisDiscriminant analysis
Discriminant analysis
 
Studentt test2-120315062933-phpapp02
Studentt test2-120315062933-phpapp02Studentt test2-120315062933-phpapp02
Studentt test2-120315062933-phpapp02
 
Completely randomized-design
Completely randomized-designCompletely randomized-design
Completely randomized-design
 
Irt assessment
Irt assessmentIrt assessment
Irt assessment
 
B.9 chi square
B.9 chi squareB.9 chi square
B.9 chi square
 

Similar to Practice Test 5B Multinomial Experiments and Contingency Tables

Categorical Data and Statistical Analysis
Categorical Data and Statistical AnalysisCategorical Data and Statistical Analysis
Categorical Data and Statistical AnalysisMichael770443
 
Practice test ch 10 correlation reg ch 11 gof ch12 anova
Practice test ch 10 correlation reg ch 11 gof ch12 anovaPractice test ch 10 correlation reg ch 11 gof ch12 anova
Practice test ch 10 correlation reg ch 11 gof ch12 anovaLong Beach City College
 
Assessment 3 – Hypothesis, Effect Size, Power, and t Tests.docx
Assessment 3 – Hypothesis, Effect Size, Power, and t Tests.docxAssessment 3 – Hypothesis, Effect Size, Power, and t Tests.docx
Assessment 3 – Hypothesis, Effect Size, Power, and t Tests.docxcargillfilberto
 
Aron chpt 11 ed (2)
Aron chpt 11 ed (2)Aron chpt 11 ed (2)
Aron chpt 11 ed (2)Sandra Nicks
 
Day 11 t test for independent samples
Day 11 t test for independent samplesDay 11 t test for independent samples
Day 11 t test for independent samplesElih Sutisna Yanto
 
Chi square test
Chi square testChi square test
Chi square testNayna Azad
 
Directions The purpose of Project 8 is to prepare you for the final.docx
Directions The purpose of Project 8 is to prepare you for the final.docxDirections The purpose of Project 8 is to prepare you for the final.docx
Directions The purpose of Project 8 is to prepare you for the final.docxeve2xjazwa
 
Testing a claim about a standard deviation or variance
Testing a claim about a standard deviation or variance  Testing a claim about a standard deviation or variance
Testing a claim about a standard deviation or variance Long Beach City College
 
Week 2 Assignment1. A. What is the probability of rolling a four.docx
Week 2 Assignment1. A. What is the probability of rolling a four.docxWeek 2 Assignment1. A. What is the probability of rolling a four.docx
Week 2 Assignment1. A. What is the probability of rolling a four.docxmelbruce90096
 
Name________________________________PSU ID______________________.docx
Name________________________________PSU ID______________________.docxName________________________________PSU ID______________________.docx
Name________________________________PSU ID______________________.docxrosemarybdodson23141
 

Similar to Practice Test 5B Multinomial Experiments and Contingency Tables (20)

Stat sample test ch 11
Stat sample test ch 11Stat sample test ch 11
Stat sample test ch 11
 
Categorical Data and Statistical Analysis
Categorical Data and Statistical AnalysisCategorical Data and Statistical Analysis
Categorical Data and Statistical Analysis
 
Practice test ch 10 correlation reg ch 11 gof ch12 anova
Practice test ch 10 correlation reg ch 11 gof ch12 anovaPractice test ch 10 correlation reg ch 11 gof ch12 anova
Practice test ch 10 correlation reg ch 11 gof ch12 anova
 
Ad test
Ad testAd test
Ad test
 
Contingency Tables
Contingency TablesContingency Tables
Contingency Tables
 
Chi square mahmoud
Chi square mahmoudChi square mahmoud
Chi square mahmoud
 
Goodness of Fit Notation
Goodness of Fit NotationGoodness of Fit Notation
Goodness of Fit Notation
 
Assessment 3 – Hypothesis, Effect Size, Power, and t Tests.docx
Assessment 3 – Hypothesis, Effect Size, Power, and t Tests.docxAssessment 3 – Hypothesis, Effect Size, Power, and t Tests.docx
Assessment 3 – Hypothesis, Effect Size, Power, and t Tests.docx
 
Chi square
Chi squareChi square
Chi square
 
Aron chpt 11 ed (2)
Aron chpt 11 ed (2)Aron chpt 11 ed (2)
Aron chpt 11 ed (2)
 
Day 11 t test for independent samples
Day 11 t test for independent samplesDay 11 t test for independent samples
Day 11 t test for independent samples
 
Chi square test
Chi square testChi square test
Chi square test
 
Directions The purpose of Project 8 is to prepare you for the final.docx
Directions The purpose of Project 8 is to prepare you for the final.docxDirections The purpose of Project 8 is to prepare you for the final.docx
Directions The purpose of Project 8 is to prepare you for the final.docx
 
Testing a claim about a standard deviation or variance
Testing a claim about a standard deviation or variance  Testing a claim about a standard deviation or variance
Testing a claim about a standard deviation or variance
 
Week 2 Assignment1. A. What is the probability of rolling a four.docx
Week 2 Assignment1. A. What is the probability of rolling a four.docxWeek 2 Assignment1. A. What is the probability of rolling a four.docx
Week 2 Assignment1. A. What is the probability of rolling a four.docx
 
chapter18.ppt
chapter18.pptchapter18.ppt
chapter18.ppt
 
chapter18.ppt
chapter18.pptchapter18.ppt
chapter18.ppt
 
chi sqare test.ppt
chi sqare test.pptchi sqare test.ppt
chi sqare test.ppt
 
chapter18.ppt
chapter18.pptchapter18.ppt
chapter18.ppt
 
Name________________________________PSU ID______________________.docx
Name________________________________PSU ID______________________.docxName________________________________PSU ID______________________.docx
Name________________________________PSU ID______________________.docx
 

More from Long Beach City College

Practice test ch 9 inferences from two samples
Practice test ch 9 inferences from two samplesPractice test ch 9 inferences from two samples
Practice test ch 9 inferences from two samplesLong Beach City College
 
Solution to the practice test ch 10 correlation reg ch 11 gof ch12 anova
Solution to the practice test ch 10 correlation reg ch 11 gof ch12 anovaSolution to the practice test ch 10 correlation reg ch 11 gof ch12 anova
Solution to the practice test ch 10 correlation reg ch 11 gof ch12 anovaLong Beach City College
 
Practice test ch 8 hypothesis testing ch 9 two populations
Practice test ch 8 hypothesis testing ch 9 two populationsPractice test ch 8 hypothesis testing ch 9 two populations
Practice test ch 8 hypothesis testing ch 9 two populationsLong Beach City College
 
Solution to the practice test ch 8 hypothesis testing ch 9 two populations
Solution to the practice test ch 8 hypothesis testing ch 9 two populationsSolution to the practice test ch 8 hypothesis testing ch 9 two populations
Solution to the practice test ch 8 hypothesis testing ch 9 two populationsLong Beach City College
 
Solution to the Practice Test 3A, Chapter 6 Normal Probability Distribution
Solution to the Practice Test 3A, Chapter 6 Normal Probability DistributionSolution to the Practice Test 3A, Chapter 6 Normal Probability Distribution
Solution to the Practice Test 3A, Chapter 6 Normal Probability DistributionLong Beach City College
 
Practice Test Chapter 6 (Normal Probability Distributions)
Practice Test Chapter 6 (Normal Probability Distributions)Practice Test Chapter 6 (Normal Probability Distributions)
Practice Test Chapter 6 (Normal Probability Distributions)Long Beach City College
 
Two Means, Two Dependent Samples, Matched Pairs
Two Means, Two Dependent Samples, Matched PairsTwo Means, Two Dependent Samples, Matched Pairs
Two Means, Two Dependent Samples, Matched PairsLong Beach City College
 

More from Long Beach City College (20)

Practice test ch 9 inferences from two samples
Practice test ch 9 inferences from two samplesPractice test ch 9 inferences from two samples
Practice test ch 9 inferences from two samples
 
Practice Test Ch 8 Hypothesis Testing
Practice Test Ch 8 Hypothesis TestingPractice Test Ch 8 Hypothesis Testing
Practice Test Ch 8 Hypothesis Testing
 
Solution to the practice test ch 10 correlation reg ch 11 gof ch12 anova
Solution to the practice test ch 10 correlation reg ch 11 gof ch12 anovaSolution to the practice test ch 10 correlation reg ch 11 gof ch12 anova
Solution to the practice test ch 10 correlation reg ch 11 gof ch12 anova
 
Practice test ch 8 hypothesis testing ch 9 two populations
Practice test ch 8 hypothesis testing ch 9 two populationsPractice test ch 8 hypothesis testing ch 9 two populations
Practice test ch 8 hypothesis testing ch 9 two populations
 
Solution to the practice test ch 8 hypothesis testing ch 9 two populations
Solution to the practice test ch 8 hypothesis testing ch 9 two populationsSolution to the practice test ch 8 hypothesis testing ch 9 two populations
Solution to the practice test ch 8 hypothesis testing ch 9 two populations
 
Solution to the Practice Test 3A, Chapter 6 Normal Probability Distribution
Solution to the Practice Test 3A, Chapter 6 Normal Probability DistributionSolution to the Practice Test 3A, Chapter 6 Normal Probability Distribution
Solution to the Practice Test 3A, Chapter 6 Normal Probability Distribution
 
Practice Test Chapter 6 (Normal Probability Distributions)
Practice Test Chapter 6 (Normal Probability Distributions)Practice Test Chapter 6 (Normal Probability Distributions)
Practice Test Chapter 6 (Normal Probability Distributions)
 
Practice Test 2 Solutions
Practice Test 2  SolutionsPractice Test 2  Solutions
Practice Test 2 Solutions
 
Practice Test 2 Probability
Practice Test 2 ProbabilityPractice Test 2 Probability
Practice Test 2 Probability
 
Practice Test 1 solutions
Practice Test 1 solutions  Practice Test 1 solutions
Practice Test 1 solutions
 
Practice Test 1
Practice Test 1Practice Test 1
Practice Test 1
 
Stat sample test ch 12 solution
Stat sample test ch 12 solutionStat sample test ch 12 solution
Stat sample test ch 12 solution
 
Stat sample test ch 12
Stat sample test ch 12Stat sample test ch 12
Stat sample test ch 12
 
Stat sample test ch 10
Stat sample test ch 10Stat sample test ch 10
Stat sample test ch 10
 
Two-Way ANOVA
Two-Way ANOVATwo-Way ANOVA
Two-Way ANOVA
 
One-Way ANOVA
One-Way ANOVAOne-Way ANOVA
One-Way ANOVA
 
Regression
RegressionRegression
Regression
 
Correlation
CorrelationCorrelation
Correlation
 
Two Variances or Standard Deviations
Two Variances or Standard DeviationsTwo Variances or Standard Deviations
Two Variances or Standard Deviations
 
Two Means, Two Dependent Samples, Matched Pairs
Two Means, Two Dependent Samples, Matched PairsTwo Means, Two Dependent Samples, Matched Pairs
Two Means, Two Dependent Samples, Matched Pairs
 

Recently uploaded

Paris 2024 Olympic Geographies - an activity
Paris 2024 Olympic Geographies - an activityParis 2024 Olympic Geographies - an activity
Paris 2024 Olympic Geographies - an activityGeoBlogs
 
A Critique of the Proposed National Education Policy Reform
A Critique of the Proposed National Education Policy ReformA Critique of the Proposed National Education Policy Reform
A Critique of the Proposed National Education Policy ReformChameera Dedduwage
 
Measures of Dispersion and Variability: Range, QD, AD and SD
Measures of Dispersion and Variability: Range, QD, AD and SDMeasures of Dispersion and Variability: Range, QD, AD and SD
Measures of Dispersion and Variability: Range, QD, AD and SDThiyagu K
 
microwave assisted reaction. General introduction
microwave assisted reaction. General introductionmicrowave assisted reaction. General introduction
microwave assisted reaction. General introductionMaksud Ahmed
 
1029-Danh muc Sach Giao Khoa khoi 6.pdf
1029-Danh muc Sach Giao Khoa khoi  6.pdf1029-Danh muc Sach Giao Khoa khoi  6.pdf
1029-Danh muc Sach Giao Khoa khoi 6.pdfQucHHunhnh
 
Organic Name Reactions for the students and aspirants of Chemistry12th.pptx
Organic Name Reactions  for the students and aspirants of Chemistry12th.pptxOrganic Name Reactions  for the students and aspirants of Chemistry12th.pptx
Organic Name Reactions for the students and aspirants of Chemistry12th.pptxVS Mahajan Coaching Centre
 
Call Girls in Dwarka Mor Delhi Contact Us 9654467111
Call Girls in Dwarka Mor Delhi Contact Us 9654467111Call Girls in Dwarka Mor Delhi Contact Us 9654467111
Call Girls in Dwarka Mor Delhi Contact Us 9654467111Sapana Sha
 
9548086042 for call girls in Indira Nagar with room service
9548086042  for call girls in Indira Nagar  with room service9548086042  for call girls in Indira Nagar  with room service
9548086042 for call girls in Indira Nagar with room servicediscovermytutordmt
 
Sports & Fitness Value Added Course FY..
Sports & Fitness Value Added Course FY..Sports & Fitness Value Added Course FY..
Sports & Fitness Value Added Course FY..Disha Kariya
 
The basics of sentences session 2pptx copy.pptx
The basics of sentences session 2pptx copy.pptxThe basics of sentences session 2pptx copy.pptx
The basics of sentences session 2pptx copy.pptxheathfieldcps1
 
Beyond the EU: DORA and NIS 2 Directive's Global Impact
Beyond the EU: DORA and NIS 2 Directive's Global ImpactBeyond the EU: DORA and NIS 2 Directive's Global Impact
Beyond the EU: DORA and NIS 2 Directive's Global ImpactPECB
 
CARE OF CHILD IN INCUBATOR..........pptx
CARE OF CHILD IN INCUBATOR..........pptxCARE OF CHILD IN INCUBATOR..........pptx
CARE OF CHILD IN INCUBATOR..........pptxGaneshChakor2
 
Ecosystem Interactions Class Discussion Presentation in Blue Green Lined Styl...
Ecosystem Interactions Class Discussion Presentation in Blue Green Lined Styl...Ecosystem Interactions Class Discussion Presentation in Blue Green Lined Styl...
Ecosystem Interactions Class Discussion Presentation in Blue Green Lined Styl...fonyou31
 
The byproduct of sericulture in different industries.pptx
The byproduct of sericulture in different industries.pptxThe byproduct of sericulture in different industries.pptx
The byproduct of sericulture in different industries.pptxShobhayan Kirtania
 
Measures of Central Tendency: Mean, Median and Mode
Measures of Central Tendency: Mean, Median and ModeMeasures of Central Tendency: Mean, Median and Mode
Measures of Central Tendency: Mean, Median and ModeThiyagu K
 
Accessible design: Minimum effort, maximum impact
Accessible design: Minimum effort, maximum impactAccessible design: Minimum effort, maximum impact
Accessible design: Minimum effort, maximum impactdawncurless
 
BAG TECHNIQUE Bag technique-a tool making use of public health bag through wh...
BAG TECHNIQUE Bag technique-a tool making use of public health bag through wh...BAG TECHNIQUE Bag technique-a tool making use of public health bag through wh...
BAG TECHNIQUE Bag technique-a tool making use of public health bag through wh...Sapna Thakur
 

Recently uploaded (20)

Código Creativo y Arte de Software | Unidad 1
Código Creativo y Arte de Software | Unidad 1Código Creativo y Arte de Software | Unidad 1
Código Creativo y Arte de Software | Unidad 1
 
Paris 2024 Olympic Geographies - an activity
Paris 2024 Olympic Geographies - an activityParis 2024 Olympic Geographies - an activity
Paris 2024 Olympic Geographies - an activity
 
Mattingly "AI & Prompt Design: Structured Data, Assistants, & RAG"
Mattingly "AI & Prompt Design: Structured Data, Assistants, & RAG"Mattingly "AI & Prompt Design: Structured Data, Assistants, & RAG"
Mattingly "AI & Prompt Design: Structured Data, Assistants, & RAG"
 
A Critique of the Proposed National Education Policy Reform
A Critique of the Proposed National Education Policy ReformA Critique of the Proposed National Education Policy Reform
A Critique of the Proposed National Education Policy Reform
 
Measures of Dispersion and Variability: Range, QD, AD and SD
Measures of Dispersion and Variability: Range, QD, AD and SDMeasures of Dispersion and Variability: Range, QD, AD and SD
Measures of Dispersion and Variability: Range, QD, AD and SD
 
microwave assisted reaction. General introduction
microwave assisted reaction. General introductionmicrowave assisted reaction. General introduction
microwave assisted reaction. General introduction
 
1029-Danh muc Sach Giao Khoa khoi 6.pdf
1029-Danh muc Sach Giao Khoa khoi  6.pdf1029-Danh muc Sach Giao Khoa khoi  6.pdf
1029-Danh muc Sach Giao Khoa khoi 6.pdf
 
Organic Name Reactions for the students and aspirants of Chemistry12th.pptx
Organic Name Reactions  for the students and aspirants of Chemistry12th.pptxOrganic Name Reactions  for the students and aspirants of Chemistry12th.pptx
Organic Name Reactions for the students and aspirants of Chemistry12th.pptx
 
Call Girls in Dwarka Mor Delhi Contact Us 9654467111
Call Girls in Dwarka Mor Delhi Contact Us 9654467111Call Girls in Dwarka Mor Delhi Contact Us 9654467111
Call Girls in Dwarka Mor Delhi Contact Us 9654467111
 
9548086042 for call girls in Indira Nagar with room service
9548086042  for call girls in Indira Nagar  with room service9548086042  for call girls in Indira Nagar  with room service
9548086042 for call girls in Indira Nagar with room service
 
Sports & Fitness Value Added Course FY..
Sports & Fitness Value Added Course FY..Sports & Fitness Value Added Course FY..
Sports & Fitness Value Added Course FY..
 
The basics of sentences session 2pptx copy.pptx
The basics of sentences session 2pptx copy.pptxThe basics of sentences session 2pptx copy.pptx
The basics of sentences session 2pptx copy.pptx
 
Beyond the EU: DORA and NIS 2 Directive's Global Impact
Beyond the EU: DORA and NIS 2 Directive's Global ImpactBeyond the EU: DORA and NIS 2 Directive's Global Impact
Beyond the EU: DORA and NIS 2 Directive's Global Impact
 
CARE OF CHILD IN INCUBATOR..........pptx
CARE OF CHILD IN INCUBATOR..........pptxCARE OF CHILD IN INCUBATOR..........pptx
CARE OF CHILD IN INCUBATOR..........pptx
 
Ecosystem Interactions Class Discussion Presentation in Blue Green Lined Styl...
Ecosystem Interactions Class Discussion Presentation in Blue Green Lined Styl...Ecosystem Interactions Class Discussion Presentation in Blue Green Lined Styl...
Ecosystem Interactions Class Discussion Presentation in Blue Green Lined Styl...
 
The byproduct of sericulture in different industries.pptx
The byproduct of sericulture in different industries.pptxThe byproduct of sericulture in different industries.pptx
The byproduct of sericulture in different industries.pptx
 
Measures of Central Tendency: Mean, Median and Mode
Measures of Central Tendency: Mean, Median and ModeMeasures of Central Tendency: Mean, Median and Mode
Measures of Central Tendency: Mean, Median and Mode
 
Accessible design: Minimum effort, maximum impact
Accessible design: Minimum effort, maximum impactAccessible design: Minimum effort, maximum impact
Accessible design: Minimum effort, maximum impact
 
INDIA QUIZ 2024 RLAC DELHI UNIVERSITY.pptx
INDIA QUIZ 2024 RLAC DELHI UNIVERSITY.pptxINDIA QUIZ 2024 RLAC DELHI UNIVERSITY.pptx
INDIA QUIZ 2024 RLAC DELHI UNIVERSITY.pptx
 
BAG TECHNIQUE Bag technique-a tool making use of public health bag through wh...
BAG TECHNIQUE Bag technique-a tool making use of public health bag through wh...BAG TECHNIQUE Bag technique-a tool making use of public health bag through wh...
BAG TECHNIQUE Bag technique-a tool making use of public health bag through wh...
 

Practice Test 5B Multinomial Experiments and Contingency Tables

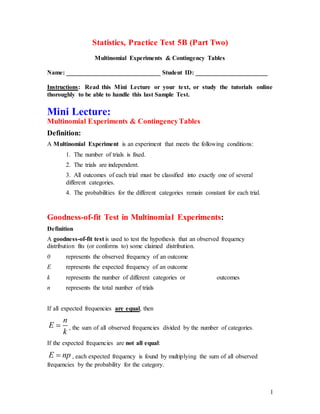
  • 1. 1 Statistics, Practice Test 5B (Part Two) Multinomial Experiments & Contingency Tables Name: ______________________________ Student ID: _______________________ Instructions: Read this Mini Lecture or your text, or study the tutorials online thoroughly to be able to handle this last Sample Test. Mini Lecture: Multinomial Experiments & ContingencyTables Definition: A Multinomial Experiment is an experiment that meets the following conditions: 1. The number of trials is fixed. 2. The trials are independent. 3. All outcomes of each trial must be classified into exactly one of several different categories. 4. The probabilities for the different categories remain constant for each trial. Goodness-of-fit Test in Multinomial Experiments: Definition A goodness-of-fit test is used to test the hypothesis that an observed frequency distribution fits (or conforms to) some claimed distribution. 0 represents the observed frequency of an outcome E represents the expected frequency of an outcome k represents the number of different categories or outcomes n represents the total number of trials If all expected frequencies are equal, then n E k  , the sum of all observed frequencies divided by the number of categories. If the expected frequencies are not all equal: E np , each expected frequency is found by multiplying the sum of all observed frequencies by the probability for the category.
  • 2. 2 Test Statistic:   2 2 O E E     Critical Values  Found in Table A-4 using k – 1 degrees of freedom where k = number of categories  Goodness-of-fit hypothesis tests are always right-tailed. Contingency Tables: Independence and Homogeneity ContingencyTable (or two-wayfrequency table) Definition A contingency table is a table in which frequencies correspond to two variables. (One variable is used to categorize rows, and a second variable is used to categorize columns.) Contingency tables have at least two rows and at least two columns. Test of Independence This method tests the null hypothesis that the row variable and column variable in a contingency table are not related. (The null hypothesis is the statement that the row and column variables are independent.) Assumptions  The sample data are randomly selected.  The null hypothesis H0 is the statement that the row and column variables are independent; the alternative hypothesis H1 is the statement that the row and column variables are dependent.  For every cell in the contingency table, the expected frequency E is at least 5. (There is no requirement that every observed frequency must be at least 5.) Test of Independence Test Statistic:   2 2 O E E     Critical Values 1. Found in Table A-4 using: degrees of freedom = (r – 1)(c – 1) r is the number of rows and c is the number of columns 2. Tests of Independence are always right-tailed.
  • 3. 3 Expected Frequency for Contingency Tables         Rowtotal Columntotal E np Grandtotal Grandtotal Grandtotal          rowtotal columntotal E Grandtotal  Grand Total = Total number of all observed frequencies in the table Test of Homogeneity In a test of homogeneity, we test the claim that different populations have the same proportions of some characteristics. How to distinguish between a test of homogeneity and a test for independence: Were predetermined sample sizes used for different populations (are they similar in nature?) (test of homogeneity,), or was one big sample drawn so both row and column totals were determined randomly (test of independence)? Statistics, Practice Test 5B Multinomial Experiments & Contingency Tables Name: ______________________________ Student ID: _______________________ Instructions: Print out the following pages that contain the Sample Test, solve all problems, show your work completely, and bring it on the day of the Final on campus exam. Show all your work for full credit. 1) Goodness-of-fit Test in Multinomial Experiments Here are the observed frequencies from four categories: 5, 6, 8, and 13. At 0.05 significance level, test the claim that the four categories are all equally likely. A. State the null and alternative hypothesis. B. What is the expected frequency for each of the four categories? C. What is the value of the test statistic? D. Find the critical value(s). E. Make a decision
  • 4. 4 2) Goodness-of-fit Test in Multinomial Experiments: A professor asked 40 of his students to identify the tire they would select as a flat tire of a car carrying 4 students who misses a test (an excuse). The following table summarizes the result, Use a 0.05 significance level to test the claim that all 4 tires have equal proportions of being claimed as flat. Tire Left Front Right Front Left Rear Right Rear Number selected 11 15 8 6 3) Test of Independence Using a 0.05 significance level, test the claim that when the Titanic sank, whether someone survived or died is independent of whether that person is a man, woman, boy, or girl. 4) Test of Homogeneity) Using the following table, with a 0.05 significance level, test the effect of pollster gender on survey responses by men.