
Recommended
Recommended
More Related Content
Similar to Counselor Dispositional Expectations Dispositions are the .docx
Similar to Counselor Dispositional Expectations Dispositions are the .docx (19)
More from melvinjrobinson2199
More from melvinjrobinson2199 (20)
Recently uploaded
Recently uploaded (20)
Counselor Dispositional Expectations Dispositions are the .docx
- 1. Counselor Dispositional Expectations Dispositions are the values, commitments, and professional ethics that influence behaviors toward others, and, if sincerely held, dispositions lead to actions and patterns of professional conduct. The Grand Canyon University Counseling Program’s dispositions adhere to the University’s mission statement, as well as to the established counseling profession codes of ethics. The Grand Canyon University Counseling Program have adopted the following dispositions for its students derived from the American Counseling Association (ACA) Code of Ethics. Although these dispositions are not all inclusive, they do represent values and qualities that are warranted by counseling students. Students who fail to adhere to or demonstrate such dispositions may be subject to disciplinary actions. · Psychological Fitness: Counselors* are aware and assess their motives for pursuing the counseling profession. They are aware of their unfinished emotional and/or mental health issues, and resolve them before starting to provide counseling services to others. Counselors engage in self-care and seek resolutions to issues that arise during their practice. Counselors adhere to the American Counseling Association (ACA) Code of Ethics and/or the NAADAC, the Association for Addiction Professionals Code of Ethics. · Self-Awareness: Counselors are aware of their personal moral, ethical, and value systems and provide counseling services with objectivity, justice, fidelity, veracity, and benevolence. Counselors are acutely aware of their personal limitations in providing services, and are willing to refer clients to another provider when necessary. · Cultural Diversity: Counselors respect, engage, honor, and embrace diversity and a multicultural approach that supports the
- 2. worth, dignity, potential, and uniqueness of people within their social and cultural context. Counselors promote self-advocacy and assist clients in advocating for empowerment within their cultural context. · Acceptance: Counselors foster a healthy climate of change by providing and promoting acceptance, and a nonjudgmental environment during the therapeutic process. They understand their personal value system and do not impose their values, attitudes, beliefs, and behaviors on their clients. · Empathy: Counselors foster understanding, compassion, and avoid any actions that can cause harm to a client. Counselors treat others with dignity and respect. · Genuineness: Counselors deal truthfully with themselves and their clients, in order to avoid harming their clients. · Flexibility: Counselors practice a client-centered approach, and align treatment to the client’s goals for therapy. · Patience: Counselors understand the therapeutic process and respect client’s efforts to gain control over their lives. Counselors encourage an environment that promotes self- empowerment and allows client’s voice in the therapeutic process. · Amiability: Counselors do not support or engage in any act of discrimination against a prospective, current, or former client. Counselors promote and practice social justice and do not exploit others in their professional relationships. · Professional Identity: Counselors adhere to regulatory state boards and nationally recognized codes of ethics. Counselors practice only within their scope and competencies. They seek to utilize best practices and empirically supported treatments. Counselors stay current with the counseling profession through seeking continuing education, and by supporting counseling associations. * The term counselor is used to refer to counselors in training at the graduate level. American Counseling Association (2014). ACA Code of Ethics. Alexandria, VA: Author.
- 3. Walz, G. R., & Bleuer, J. C. (2010). Counselor dispositions: An added dimension for admission decisions. Vistas Online publication, 1, 11-11. © 2015. Grand Canyon University. All Rights Reserved. •••••i A National Profile of the Real Estate Industry and the Appraisal Profession by J. Reid Cummings and Donald R. Epley, PhD, MAI, SRA FEATURES T J- he he real estate industry has been devastated on many fronts' in the years following the Great Recession, whieh began in 2007^ due to the bursting of the housing bubble and the subsequent finaneial crisis relating to the mortgage market meltdown.' The implosion of the mortgage markets initially began when two Bear Stearns mortgage-backed securities hedge funds, holding nearly $10 billion in assets, disintegrated into nothing.* Panie quickly spread to financial institutions that could not hide the extent of their toxic, subprime exposures, and
- 4. a massive, worldwide credit squeeze ensued; outright fear soon replaced panic. Subsequent eredit tightening and substantial illiquidity in the financial markets rapidly and severely affected the housing and construction markets.' Throughout the United States, properties of all kinds saw dramatic value declines. In thousands of cases, real estate foreclosures disrupted people's lives, forced businesses to close, eaused financial institutions to falter, capsized wbole market segments, devastated entire industries, and squeezed municipal and state government budgets dependent upon use and property tax revenues.* While the effeets of property value declines and the waves of foreclosures in markets across the country captured most of the headlines, one significant impact of the upheaval in US real estate markets has gone largely unreported: its impact on employment in the real estate industry, and specifically, the real estate appraisal profession. This article presents a current employment profile of the US real estate industry, with special attention given
- 5. to appraisal profes- sionals. It serves as an informative picture of the appraisal profession for use as a benchmark for future assessment of growth. As a component of the real estate industry, the appraisal profession ranks as the smallest in employment, is highly correlated to movements in empioy- ment of brokers and agents, and relies on commerciai banking, credit, and real estate
- 6. lessors and managers to deliver its products. 1. James R. DeLisle, "At the Crossroads of Expansion and Recession," TheAppraisalJournal 75, no. 4 (Fall 2007): 314-322; James R. DeLisle, "The Perfect Storm Rippiing Over to Reai Estate," The Appraisal Journal 76, no, 3 (Summer 2008): 200-210. 2. Randaii W. Eberts, "When Wiii US Empioyment Recover from tiie Great Recession?" International Labor Brief 9, no. 2 (2011): 4-12 (W. E. Upjohn Institute for Employment Research): Chad R. Wilkerson, "Recession and Recovery Across the Nation: Lessons from History," Economic Review 94, no. 2 (2009): 5-24. 3. Kataiina M. Bianco, The Subprime Lending Crisis: Causes and Effects of the Mortgage Meltdown (New York: CCH, inc., 2008): Lawrence H. White, "Fédérai Reserve Policy and the Housing Bubbie," in Lessons From the Financial Crisis: Causes, Consequences, and Our Economic Future, ed. Robert W. Koib (Hoboken, NJ: John Wiley & Sons, Inc., 2010), 453-460. 4. John Bellamy Foster, "The Financialization of Capital and the Crisis," Monthiy Review 59, no. 11 (Aprii 2008): 1-19. 5. Major Coleman iV, Michael LaCour-Littie, and Kerry D. Vandeii, "Subprime Lending and the Housing Bubbie: Taii Wags Dog?" Journai of Housing Economics 17, no. 4 (2008): 272-290. 6. Dean Baker, "The Housing Bubbie and the Financiai Crisis," Rea/-Wor/d Economics Review no. 46 (2008): 7 3 - 8 1 .
- 7. ANationaLRrMlejlîheBeaLIstatdflctustry^ancIth&Apprms.aJ.Er ofessLaa. _IJhe Appraisal Journal, Spring 2013 Hundreds of thousands of professionals are involved in brokering, leasing, managing, appraising, and developing all property types. Service professionals include residential sales agents, multifamily-property managers, commercial investment advisors, industrial property brokers, land developers, property appraisers, and many others.^ Their professional education and training includes academic work performed in colleges and universities; industry-specific education and training programs; advanced professional association development and designation certifications; company and franchise training; pre- and post-licensing continuing education requirements; and many years of on-the-job training and experience. The disintegration of the housing and financial markets has affected all professionals in the real estate industry and its employment components. This article shows professional real estate appraisers have been particularly hard hit. Before the recession, as property values and sales grew, and as demand for loans increased, appraisers' workloads did as well. When the bubble burst, appraisers felt its impact and experienced significant declines in their businesses. As a result, the real estate appraisal industry experienced a significant loss in jobs. Recent growth in employment within the appraisal profession has neither mirrored other sectors in the real estate industry, nor that of the US economy.
- 8. The purpose of this article is to provide a cross- sectional view of the national real estate industry with special attention given to employment in the appraisal profession. Nothing in the professional literature attempts to establish a data-driven profile of the appraisal business, or compares and contrasts it to other real estate-related professions. This article is not a survey, but rather an effort to establish a basic real estate appraisal employment baseline that will serve as a benchmark for future trend comparisons. This profile uses the latest data estimates from private, state, and federal sources in support of regional input-output tables used for the estimation of economic impacts from events in a region.^ The results indicate that overall real estate industry employment at the end of 2011 was higher than at the beginning of 2001. However, the trend of annual increases in the number employed evident in the early years of the 2001—2011 study period reversed itself during the recession. Declines in employment appear to coincide with concurrent declines in the economy during the latter years of the same period. The results further show a significant correlation between employment in the real estate appraisal profession and production measures of the national economy, but not with national employment This research is not only very timely, it also is extremely important because changes in the employment trends in the real estate industry since the financial crisis began have been substantial. The information and analysis presented offer unique insights into understanding the current state of the real estate industry, and in particular, the real estate appraisal profession.
- 9. Employment Profile and Trends This article examines national employment trends in five real estate-related categories: • Agents and Brokers • Appraisers • Lessors and Lessors' Agents • Property Managers • Other Services (i.e.. Escrow Agents, Consultants, Fiduciaries, Asset Managers, and Listing Services) It extracts the data according to the North American Industry Classification System (NAICS) at the six-digit code level across all real estate-related cat- egories for the period 2001—2011.'' Each category draws from information provided by the US Census Bureau NAICS category definitions. Agents and Brokers The industry classification Offices of Real Estate Agents and Brokers (NAICS Code 531210) includes people primarily engaged in acting as agents and/or brokers in one or more of the following: (1) selling real estate for others, (2) buying real estate for others. 7. Association of Real Estate License Law Officiais, Digest of Real Estate License Laws and Current Issues (Chicago: Association of Reai Estate License Law Officiais, 2011). 8. Proprietary data obtained by paid license from Economic Modeiing Speciaiists. Intl. For information on purchasing licenses enabling information access, see http://www.economicmodelihg.com.
- 10. 9. NAICS codes adopted by several government agencies such as the US Bureau of Ecohomic Analysis and the US Bureau of Labor Statistics for the standardization and reporting of data such as employmeht ahd income. Further expianation of the accounts used ahd specialties covered is shown in the Appendix at the end of this articie. appraisai Journal, Spring 2 0 1 3 , ^ -EcoJile Qflhe and (3) renting real estate for others. Figure 1 shows that at the end of 2001,1,061,482 people in the United States worked in Offices of Real Estate Agents and Brokers. At the end of 2011,1,717,627 people worked in this classification, or 61.8% more than in 2001. The annual employment number increased each year in 2001-2007, peaking in 2007 at 1,857,576. However, coinciding with the beginning of the recession, the number of people in this classification began to decline, and the annual decreases continued until a slight increase occurred in 2011 over 2010. Two caveats are noteworthy. First, substantial increases in employment during the early years of the period may be due to entry of new licensees hoping to capitalize on the potential income opportunities provided by Üie booming, pre-financial crisis real estate markets. Therefore, tbe sharp growth trend may have been an unsustainable anomaly. Second, the data does not differentiate between those licensed professionals who work full-time versus those who only work part- time. Therefore, some portions of categorical declines in the post-flnancial crisis economy may be due to part-üme licensees choosing not to renew their licenses
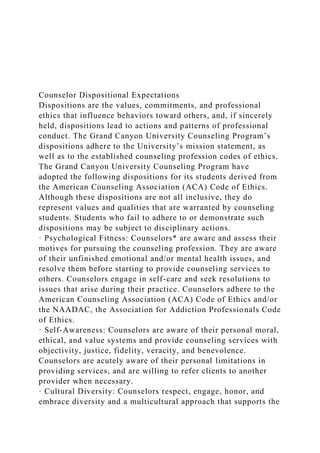
- 11. during the economic downturn. Appraisers The industry classification Ofiices of Real Estate Appraisers (NAICS Code 531320) includes people primarily engaged in estimating the fair market value of real estate. Figure 2 shows that at the end of 2001,80,724 people in the United States worked in this classification. At year-end 2011,111,253 people worked in this classificaüon, or 37.8% more than in 2001. The annual employment number increased each year in 2001-2007, peaking in 2007 at 118,657. In addition, again coinciding with the beginning of the recession, the number of people in this classifica- tion began to decline, and the decreases confinued through 2011. Although the percentages of growth in this category are different from those of the category Offices of Real Estate Agents and Brokers, it is possible the explanafions are similar. The booming real estate markets prior to the financial crisis increased demand for appraisals, and therefore, more people entered the profession. Likewise, as the markets slowed after the crisis began and appraisal demand declined, so did the demand for appraisers. Due to the reduced demand, some licensed appraisers may have sought other types of employment, or suspended or terminated their licenses. Further, some lenders, especially those focusing on the residential mortgage sector, increased use of alternafive valuation products or turned to using broker price opinions (BPOs).'" Figure 1 US Offices of Real Estate Agents and Brokers (NAICS
- 12. Code 531210) a. S0. 'S be r 1 2,000,000 -| 1,800,000 - 1,600,000 - 1,400,000 - 1,200,000 - 1,000,000 - 800,000 - 600,000 - 400,000 - 200,000 - 0 - o 48
- 13. 2 ,6 7( ,3 7 W H ^ , 1 1 1 2001 2002 2003 2004 M H (0 rT -- 2005 (0 1 i 2006 2007 Year o" 00 2008 t m
- 14. H 2009 ,6 9: 71 4 2010 M 71 7 H 2011 10. So many real estate brokers began performing BPOs after the financial crisis that in IVlay 2011, the National Association of Realtors (NAR) introduced a new BPO training and certification program. Information obtained from the Nationai Association of Reaitors available at http://www.realtororg/rmodaiiy. nsf/pages/News2011051306. aJMonal2rMkoíJlifiJüaL£síalfiJndiJ.stryjDd the AppraisalJr l i i e Appraisal Journal, Spring20; Figure 2 US Offices of Real Estate Appraisers (NAICS Code 5 3 1 3 2 0 )
- 15. 'S. o 'S 140,000 120,000 100,000 80,000 60,000 40,000 -h- 20,000 -— ,̂.,- 2001 2002 2003 2004 2005 2006 2007 Year 2008 2009 2010 2011 Lessors and Lessors' Agents The industry classification Lessors of Residential Buildings and Dwellings (NAICS Code 531110) includes people primarily engaged in acting as les- sors of buildings used as residences or dwellings, such as single-family homes, apartment buildings, and townhomes. Included in this classification are owner-lessors of residential buildings and dwellings or people employed by them. Figure 3 shows that at the end of 2001, 683,905 people in the United States worked as Lessors of
- 16. Residential Buildings and Dwellings. At year-end 2011,1,057,764 people worked in this classification. or 54.7% more than in 2001. The annual employment number increased each year in 2001—2007, peaking in 2007 at 1,083,847. However, coinciding with the beginning of the recession, the number of people employed in this classification began to decline, dipping slighüy in 2008 and 2009. The trend reversed in 2010 and 2011. The industry classification Lessors of Non- Residential Buildings (NAICS Code 531120) includes people primarily engaged in acting as lessors of huildings (except mini-warehouses and self- storage units) that are not residences or dwellings. Included in this industry sector are owner-lessors Figure 3 Offices of US Lessors of Residentiai Buildings and Dwellings (NAICS Code 5 3 1 1 1 0 ) 4) e o p Q. •S be r h
- 17. 1,200,000 -1 1,000,000 - 800,000 - 600,000 - 400,000 - 200,000 - 0 - m(-» 3, 9( 00 CO 2001 S 2002 S 76 4 2003 S
- 20. H 2010 CO 05 7 11 2011 ! Appraisal Journal, Spring 2O13L lPröfile of th&RftaiXslatalcuksítyjnd the AppraisalÄ of non-residential buildings and people employed by tbem. Figure 4 shows that at the end of 2001, 369,301 people in the United States worked in the Lessors of Non-Residential Buildings classification. At year- end 2011, 493,600 people worked in this industry classification, or 33.7% more than in 2001. The annual number of people increased each year in 2001—2005, decreased slightly in 2006, and increased in 2007 and 2008, when it peaked at 510,576. Thereafter, the annual number of people employed in this classification decreased each year in 2009—2011. The industry classification Lessors of Mini- Warehouses and Self-Storage Units (NAICS Code 531130) includes people primarily engaged in renting or leasing self-storage space (e.g., rooms, compartments, lockers, containers, or outdoor space)
- 21. where clients can store and retrieve their goods. Figure 5 shows that at the end of 2001, 132,064 people in the United States worked as Lessors of Mini-Warehouses and Self-Storage Units. At the end of 2011, 280,702, or 112.6% more than in 2001, worked in this classification. The annual number of people in this classification increased each year in the study period except for 2009, when it decreased shghtiy by -2,393, or -0.86% less than 2008. A possible explanation for the strong growth performance could be a combination of Americans continuing to accumulate more material possessions and the downsizing of residences, increasing the need for storage of their possessions. Another explanation might be that foreclosures forced people to place their possessions in storage as they transitioned to other residences. The industry classification Lessors of Other Real Estate Property (NAICS Code 531190) includes people primarily engaged in acting as lessors of real estate (except buildings), such as manufactured- home sites, vacant lots, and grazing land. Figure 6 shows that at the end of 2001,125,915 people in the United States worked as Lessors of Other Real Estate Property. At the end of 2011,146,858 people, or 16.6% Figure 4 Offices of US Lessors of Non-Residential Buildings (NAICS Code 5 3 1 1 2 0 ) of P eo
- 22. p b er z 600,000 - 500,000 - 400,000 - 300,000 - 200,000 - 100,000 - 0 - CO q CO CO 2001 Figure 5 Offices of US of P eo p N um be
- 23. r 300,000 -1 250,000 - 200,000 - 150,000 - 100,000 - 50,000 - 0 - rt 2001 ,^ in in" . CO CO I 2002 Lessors CO H 2002 S -•-
- 24. 2003 CO H 2004 ,1 5: O) CO 2005 of Mini-Warehouse and i n iO ,6 r l 2003 ,7 7Î H H 2004 m
- 26. in 1 2009 Self-Storage Units (NAICS Code in H O) CM 2006 Year CO a> in CM Í r 2007 CO CO CM -•-
- 28. CM O r» 28 0 1 2011 JThe Appraisal Journal, Spring 20: Figure 6 Offices of US Lessors of Other Real Property (NAICS Code 531190) pi e Pe o ro f N u m b e 1 ön onn -
- 29. 160,000 - 140,000 - 120,000 - 100,000 - 80,000 ^ 60,000 - 40,000 - 20,000 - r U Figure 7 Offices io p le je r o f P t 3 Z 250,000 - 200,000 - 150,000 - 100,000 - 50,000 -
- 34. 00 CM 1 2009 O m 2010 CO _. u> 0 0 CM i: 2010 00 CD" r i 1 2011 CO of
- 35. 00 CM s 1 2011 more than in 2001, worked in this classification. The increases and decreases in the number of people in this classification are inconsistent, showing increases in 2001-2005,2007, and 2010, but decreases in 2006, 2008-2009, and 2011. Property Managers The industry classification Residential Property Managers includes people primarily engaged in managing residential real estate for others. Figure 7 shows that at the end of 2001, 178,244 people in the United States worked in this industry classification, and atthe end of 2011,289,706 people, or 62.5% more than in 2001, worked in this classification. During 2001—2011, the number of people in tbis classification increased each year, with the highest annual increase (10.7%) occurring in 2007, which coincided with the beginning of the recession. The 10.7% increase in 2007 was the only double-digit increase during the study period. One possible explanation for this is that 2007 was the first year people began losing their homes to foreclosure hecause of the recession. As the demand for rental units increased due to increased home foreclosures, there may have been a eommensurate inerease in tbe need for residential
- 36. managers. Anotber explanation could be that more apartment eomplexes came on line in 2007 due to the rapid expansion of eonstrucüon of multifamily units in the middle part of the decade, resulting in employment of more residential property managers. The industry classification Non-Residential Property Managers (NAICS Code 531312) includes people primarily engaged in managing non- residential real estate for others. Figure 8 shows at the end of 2001, 83,213 people in the United States were employed as Non-Residenüal Property Managers. At the end of 2011,130,346 people, or 56.6% more than in 2001 worked in this classification. ppraisal Journal, Spring 2013. A National Profile of tlie^R&aJ £state.iDáiistry,.aad the Appraisal Profession Figure 8 Offices of US Non-Residential Property IVIanagers (NAICS Code 5 3 1 3 1 2 ) P e o p ie N um be r 140,000
- 37. 120,000 100,000 t 80,000 — 60,000 40,000 20,000 O H CO H N oi CO ( 0 QQ to n N «t o" 3 " œ en If)o H
- 38. 5 7 3 t t s ?.-—3.-.. îj en tn o H 2001 2002 2003 2004 2005 2006 Year i i i i 2007 2008 2009 2010 2011 With the exception of 2009-2010, when growth was relatively flat, the number of people working in the Non-Residential Property Managers classification increased during the study period, with the highest annual increase (9.4%) occurring in 2008. A possible explanation for the significantly higher increase in 2008 is that demand for asset managers increased due to the increased foreclosures of non-residential properties. Another possible explanation is that demand for commercial real estate was increasing in the years prior to the financial crisis—peaking in 2008—and thus, more real estate firms employed
- 39. more non-residential property managers to service the industry. It is important to note that because this NAICS industry classification includes only those managing non-residential real estate for others, property management services for owner-occupied properties are not included. Other Real Estate Activities The industry classification Other Activities Related to Real Estate (NAICS Code 531390) includes people primarily engaged in performing real estate-related services (except lessors of real estate, olfices of real estate agents and brokers, real estate property man- agers, and offices of real estate appraisers). Figure 9 shows that at the end of 2001, 592,155 people in the United States worked in Other Activities Related to Real Estate. At the end of 2011, 852,824 people, or 44% more than in 2001, worked in this classification. The e m p l o y m e n t growth t r e n d of this classification is similar to the growth trend in the classification Offices of Real Estate Appraisers. The annual number increased each year in 2001—2005, and peaked in 2007 at 890,100. Coinciding with the beginning of the recession, the number of people employed in this classification then began to decline and the decreases continued through 2011. Correlations and Summary The analysis in this article compares employment categories of the appraisal profession to other seg- ments of the real estate industry and various national economic indicators. The statistical test used is a simple correlation analysis utilizing the Pearson" method to produce correlation eoefiicients between
- 40. the appraisal profession and other segments of the real estate industry. The purpose of performing this statistical test was to uneover strong and weak relationships with other parts of the eeonomy that could serve as future indieators of the welfare of the appraisal profession. Correlation analysis examines the degree to which relationships exist between variables. Correlations, labeled as eoefiicients, are numbers between -1 and +1. A coefficient between 0 and +1 suggests a positive relationship between the variables, whereas a coefficient between -1 and 0 suggests a negafive one. Correlation analysis helps reduce the range of uncertainty about the relaüonships between the variables. Hence, correlation analysis produces greater variance of the predieted outcomes—how much movement of one variable is related to movement of another variable—that are eloser to 1 1 . Joseph F. Hair Jr., Mary Wolfinbarger Ceisi, Arthur Money, Phillip Samouel, and Michael J. Page, Essentials of Business Research Methods, 2nd ed. (Armonk, New York: M. E. Sharpe, inc., 2011). ^ ^ The Appraisai Journai, Spring 20: Figure 9 US Offices of Other Activities Related to Real Estate (NAICS Code 531390) P e o
- 42. 0) CM O — 00 r- - o os- 00 CO CO 00 o S o O) 00 — " in CM 00 - 00 - ¿^ LO m — 00 CO
- 43. _._ CM d — 00 CM 00 ci 10 00 2001 2002 2003 2004 2005 2006 2007 2008 2009 2010 2011 Year reality. A simple correlation is between two variables. Perfect correlation exists between two variables when the correlation coefficient is either +1 or - 1 . Table 1 shows the correlation analysis results for the study.'̂ They reveal a posifive relationship between the appraisal profession and the other sectors. The highest correlafion of+0.998 was with the classification Offices of Real Estate Agents and Brokers, which was statistically significant at the 0.01 level (this means that 99.8 times out of 100, this relationship will exist and will be highly, posifively correlated). Also, a strong, positive relationship of +0.997 was revealed with the classification Residential Property Managers, which was highly significant at the 0.01 level. The interpretation is that as employment in the sectors identified goes up or down, employment in the appraisal profession will do likewise.
- 44. The analysis leads to the following conclusions related to the Real Estate Appraisers classificafion: 1. The industry classification Real Estate Appraisers is the smallest among all real estate sectors examined, with 111,233 johs in 2011. 2. Employment increased annually from 80,724 in 2001 to a high of 118,657 in 2007, for a total increase of 37,933, or 46.99%. 3. Employment decreased annually from 118,657 in 2007 to a low of 111,233 in 2011, for a total decrease of-7,424, or -6.3%. 4. During the study period, the largest annual decrease was from 118,657 in 2007 to 114,397 in 2008, a decrease of-4,260 or -3.6%. 5. The smallest decrease, between 2009 and 2010, was -271 or -0.24%. 6. The most recent decrease, between 2010 and 2011, was-1,705 or-1.51%. Total Requirements Needed to Operate The Bureau of Economic Analysis prepares and publishes a variety of economic statistics on indus- tries. Its data on total requirements represent the total demand for goods or services that an industry needs to produce its particular goods or services.'^ While other industries or resources operafing or existing within the region saüsfy some of the demand, in many instances not all of the requirements
- 45. are satisfied from within the same region. This unsatisfied or leftover demand is satisfied through imports into the region. Thus, the total requirements equal the amount safisfied within the region plus the amount of imports into the region. Figure 10 displays the US 2010 total requirements for real estate-related industries. Because this data is for the entire United States, the region is the entire country as well. The 2010 total requirements for all real estate-related sectors totaled over $1.09 12. The correlations shown in Table 1 are between people working in the appraisai profession and other real estate-reiated sectors. 13. The totai requirements (TR) technique does not derive estimates based on empioyment but instead focuses on the totai demand for goods or services that an industry needs in order to produce its particular goods or services. In the United States, the Department of Commerce's Bureau of Economic Anaiysis (BEA) produces two types of TR tables, in coefficient form, using benchmark input-output information drawn from make and use tables. The tables present input values of goods or services purchased directiy in order to produce one dollar of output. The coefficients of the TR tables provide the totai sum of direct and indirect inputs necessary to produce output. For example, the direct purchases (inputs) necessary to produce an airplane wouid inciude the steel and aiuminum used in the construction of the aircraft fuselage, and the indirect purchases wouid include the energy resources necessary to produce the steel and the aluminum. The different types of direct and totai requirements information produced by the BEA
- 46. depend on whether the defined goods and services are industries or commodities. For a comprehensive explanation of the BEA's methodology and data- derivation techniques, refer to the BEA's Methodology Paper Series and other methodoiogies oh the nationai, industry, international, and regional accounts avaiiable at http://www.bea.gov/ methodoiogies/index.htm and articies pubiished in the Survey of Current Business avaiiable at http://www.bea.gov/scb/index.htm. a M d i J a ^ ê i oc 1 ta o o o •3 a -3 ' - sjossan 'S - sjossan
- 47. 3 (s.OOO) dNOSn O O O • í o 00 00 ó ó H < í Ĉ J q q en ó ó ó Ö o o q o 8 q •H * LO O <j> o en q d d
- 48. c D L O C D e n c D e n o o c o r ^ t ^ L o c M - H o O v H ^ C D O O O O ^ ^ C N O ^ r ^ ^ O O l O O O " s f c N - ^ v - j L o q q q o í ^ c D O c D O ó ó ó ó ó ó ó ó ó ó ó ó ó ó i * * « * * # * * * * * * * O O C N O h - O O O O O C N O O O L O O ^ O C D O ' Í O C O O C N ^ C O O C X J O C 7 ) q c ñ C I ) C 7 ) O C 7 ) O C D O C J ) O C 7 ) O ó ó ó ó ó ó ó ó ó ó ó ó ó ó o o o * • * o r— o cq q d d CN • H CD o cq q d d o CD 00 o LO o CJ) LO o LO o o LO q q q q q Ö ó ó ó ó ó LO q
- 49. d d d d d d d d en en o o o LO en en o o o CO o o o o o •H O 8 H * * 00 CJ) CJ)
- 55. … CNL-509 Counseling Disposition Reflection Worksheet Directions: Review the dispositions document and select three dispositions that you currently meet and that have helped you to be culturally competent. Complete the chart by listing the dispositions met as well as a description of how the disposition is met. Each description response should be 75-100 words in length. Dispositions Related to Cultural Competence Description of How the Disposition is Met 1. 2. 3. Directions: Now that you have identified dispositions that you currently meet, review the disposition document again and select two dispositions related to cultural competence that may be areas of improvement. Complete the chart below by adding the two dispositions you do not meet as well as a preliminary plan in regards to how you plan to improve the identified dispositions. Each description response should be 75-100 words in length. Disposition Description of How you plan to Improve the Disposition 1.
- 56. 2. © 2016. Grand Canyon University. All Rights Reserved. © 2014. Grand Canyon University. All Rights Reserved.