This document summarizes a study that investigated nutrient resorption efficiency in tree species across different forest stands. The study found that:
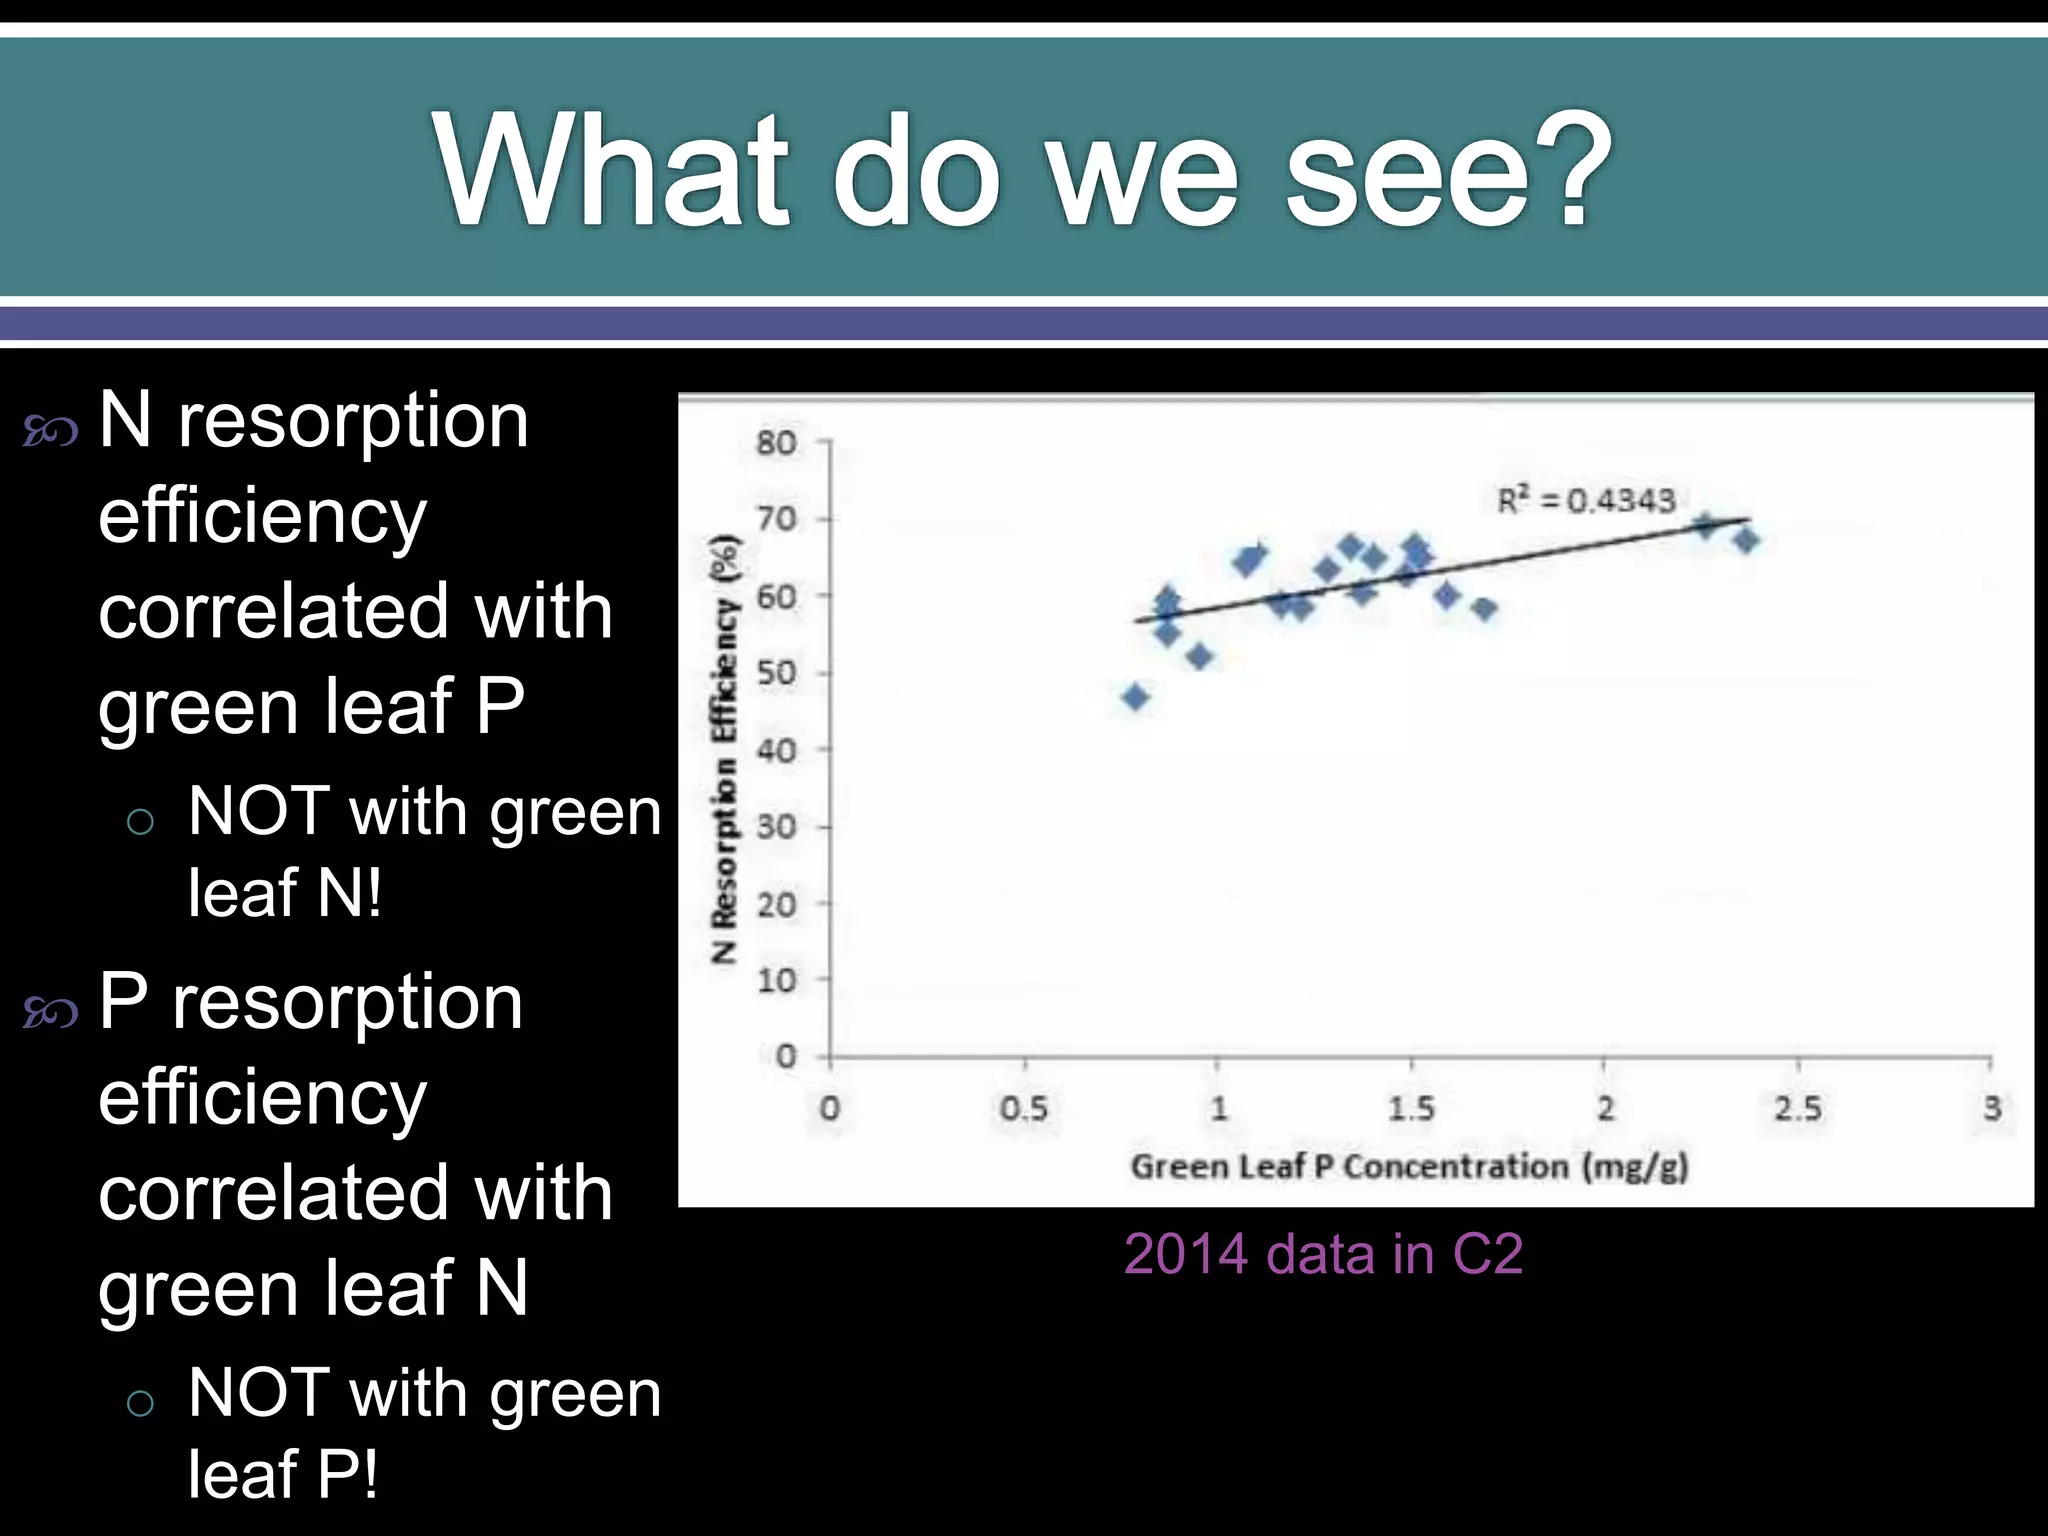
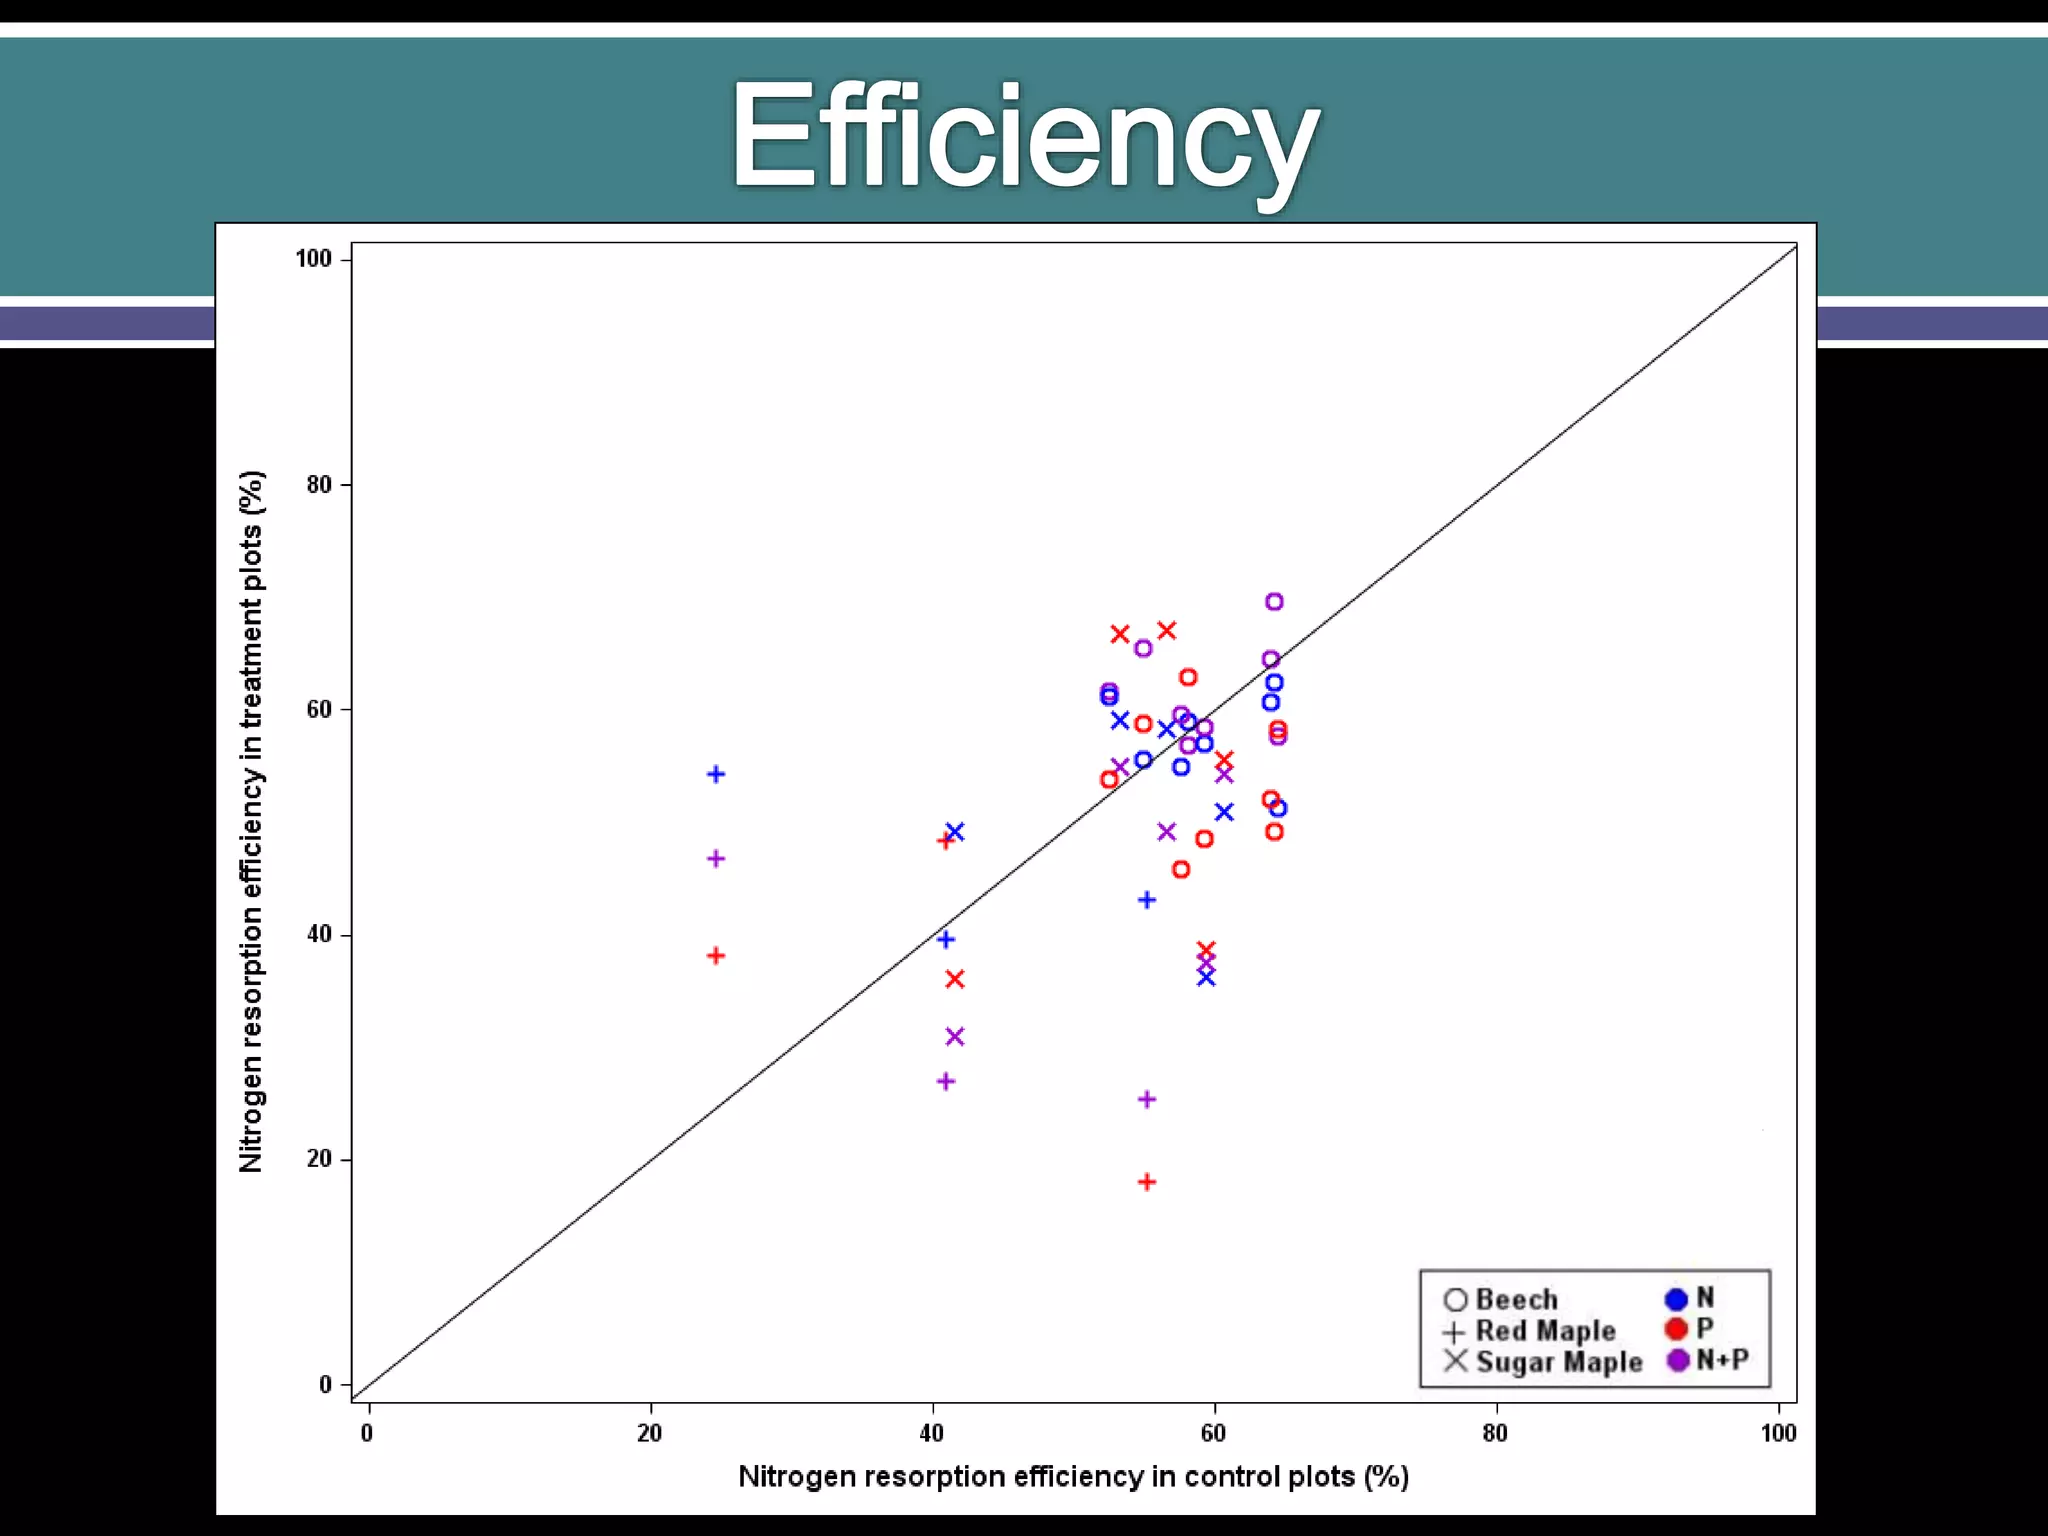
1) Nitrogen resorption efficiency in senescing leaves was correlated with higher phosphorus concentrations in green leaves, not nitrogen concentrations.
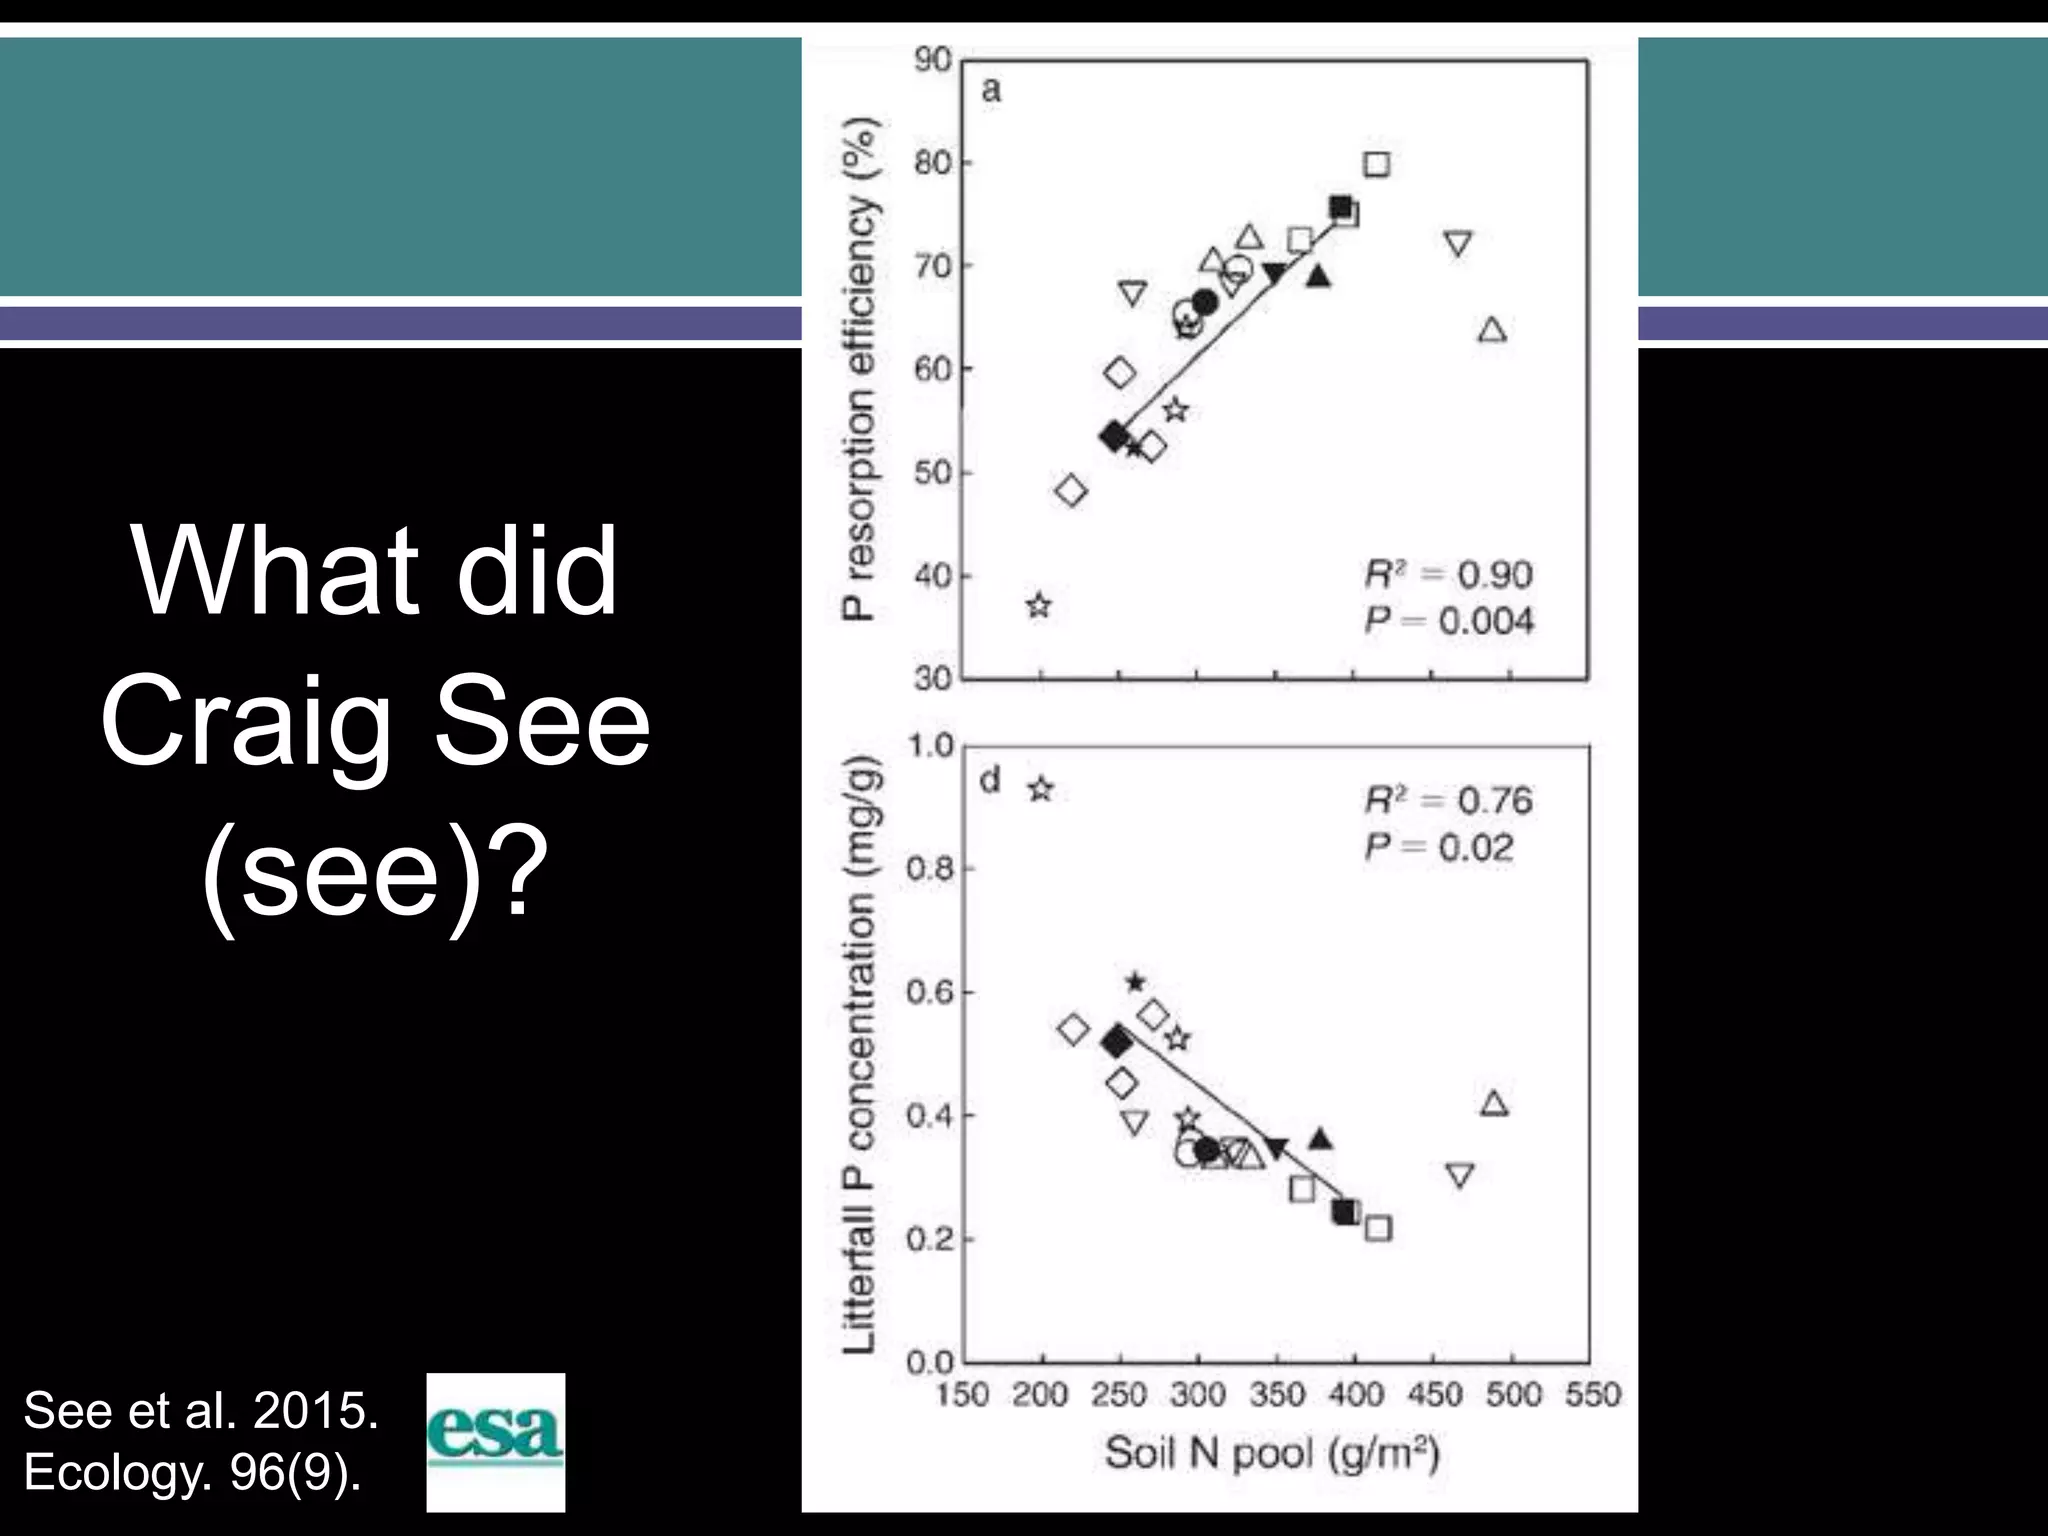
2) Phosphorus resorption efficiency was correlated with higher nitrogen concentrations in green leaves, not phosphorus concentrations.
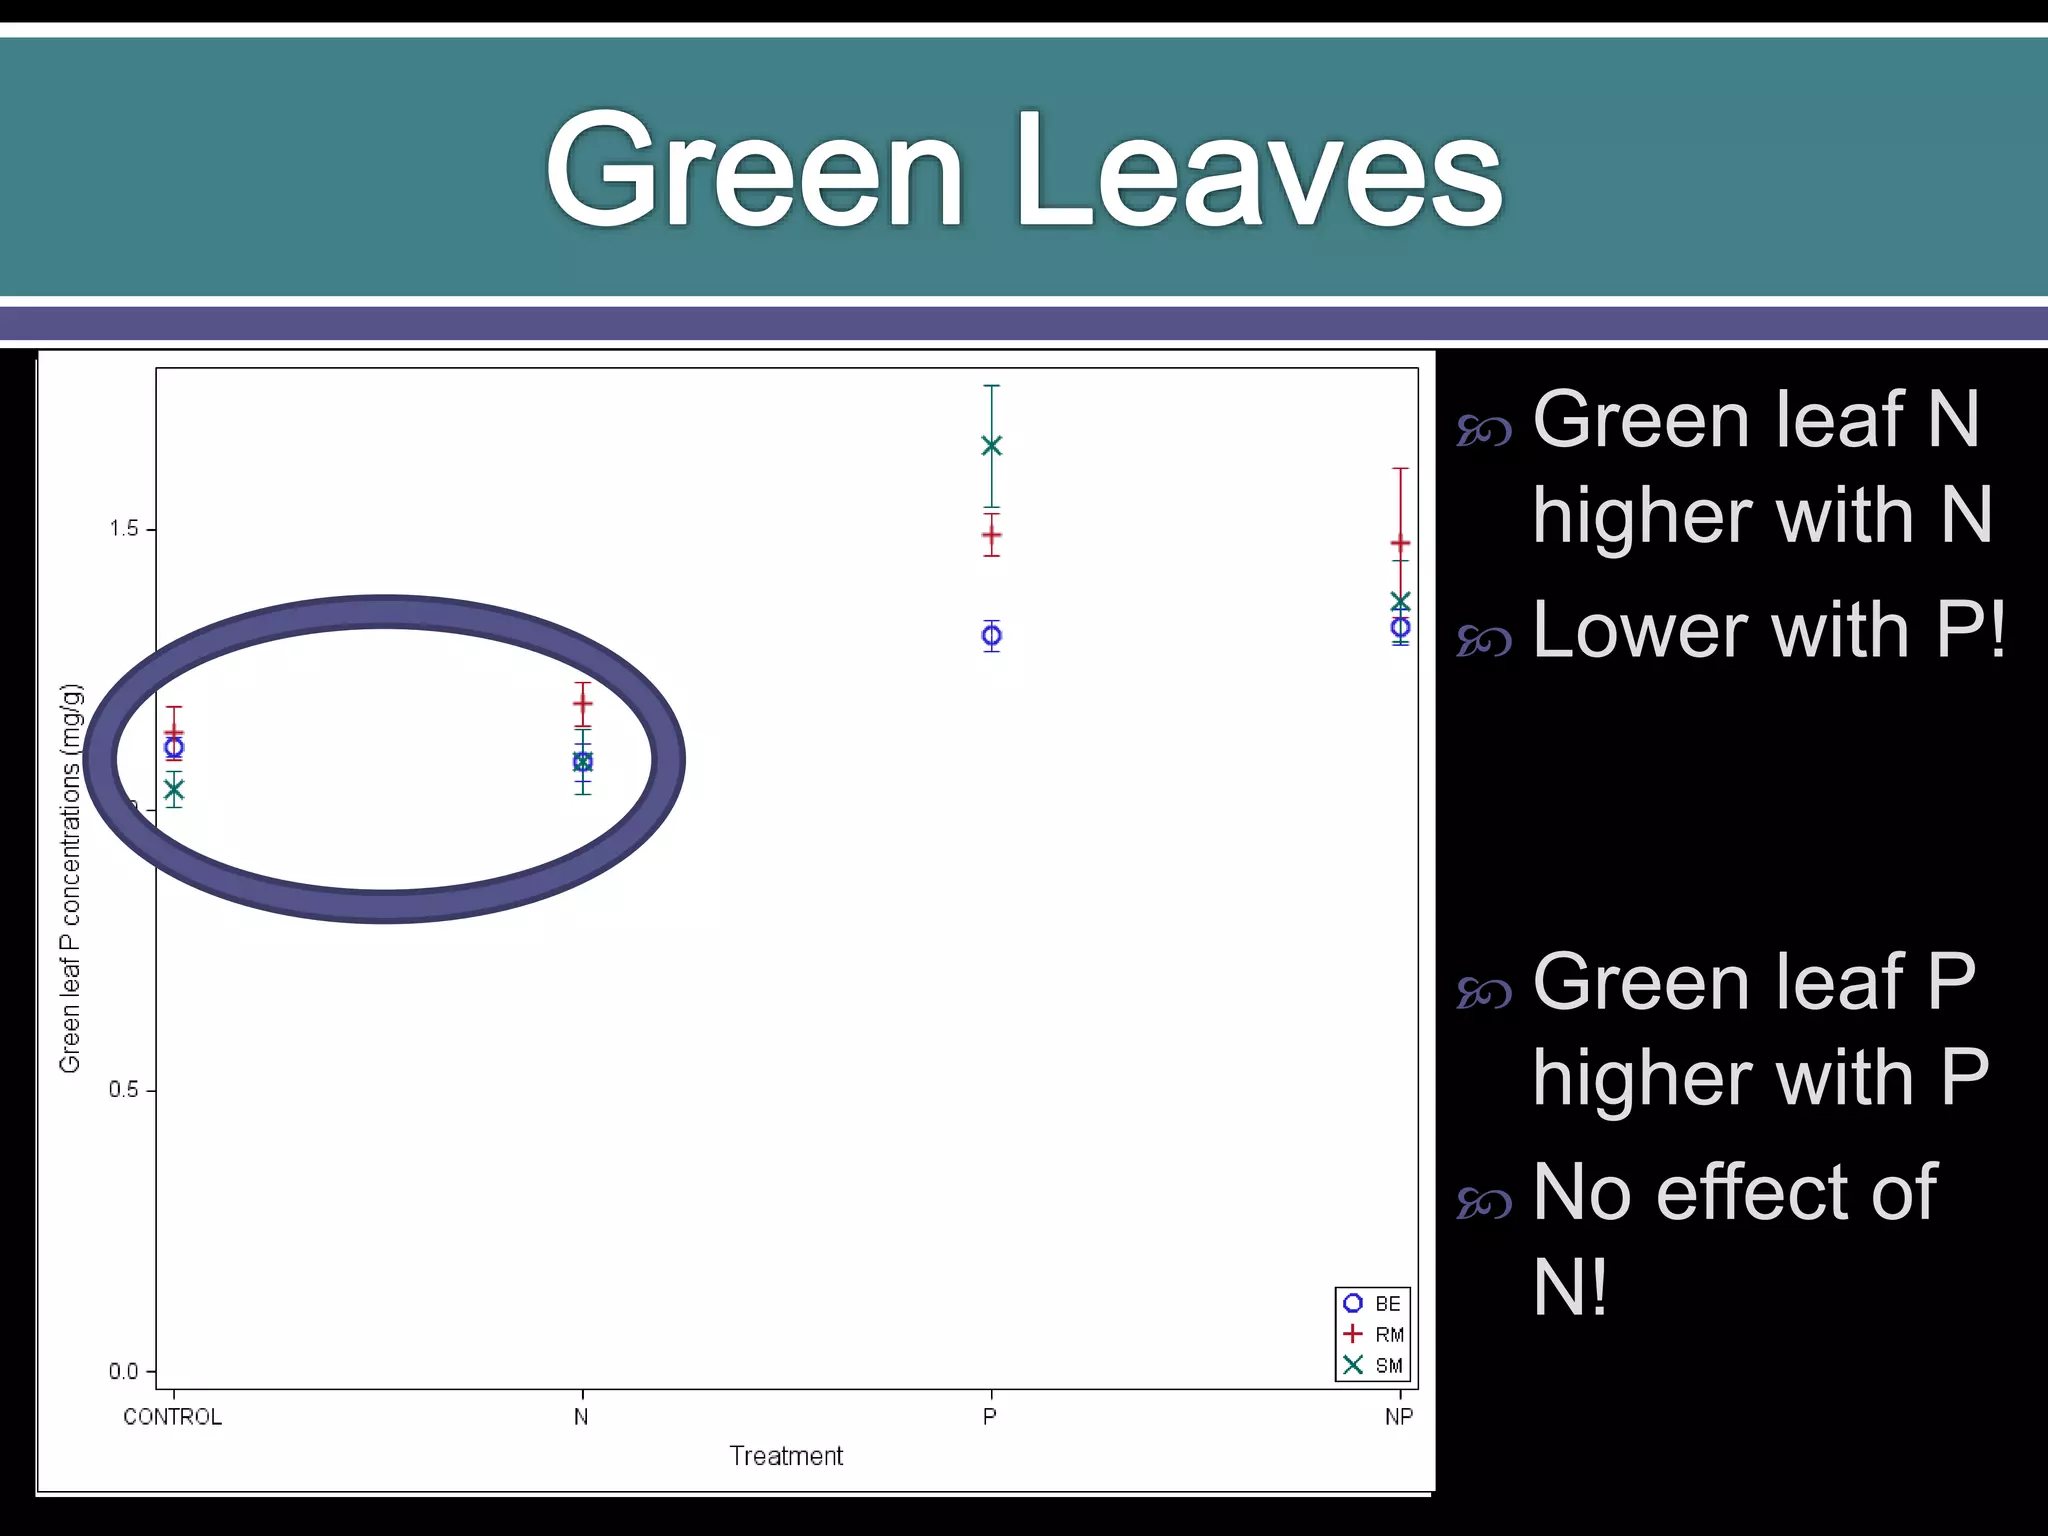
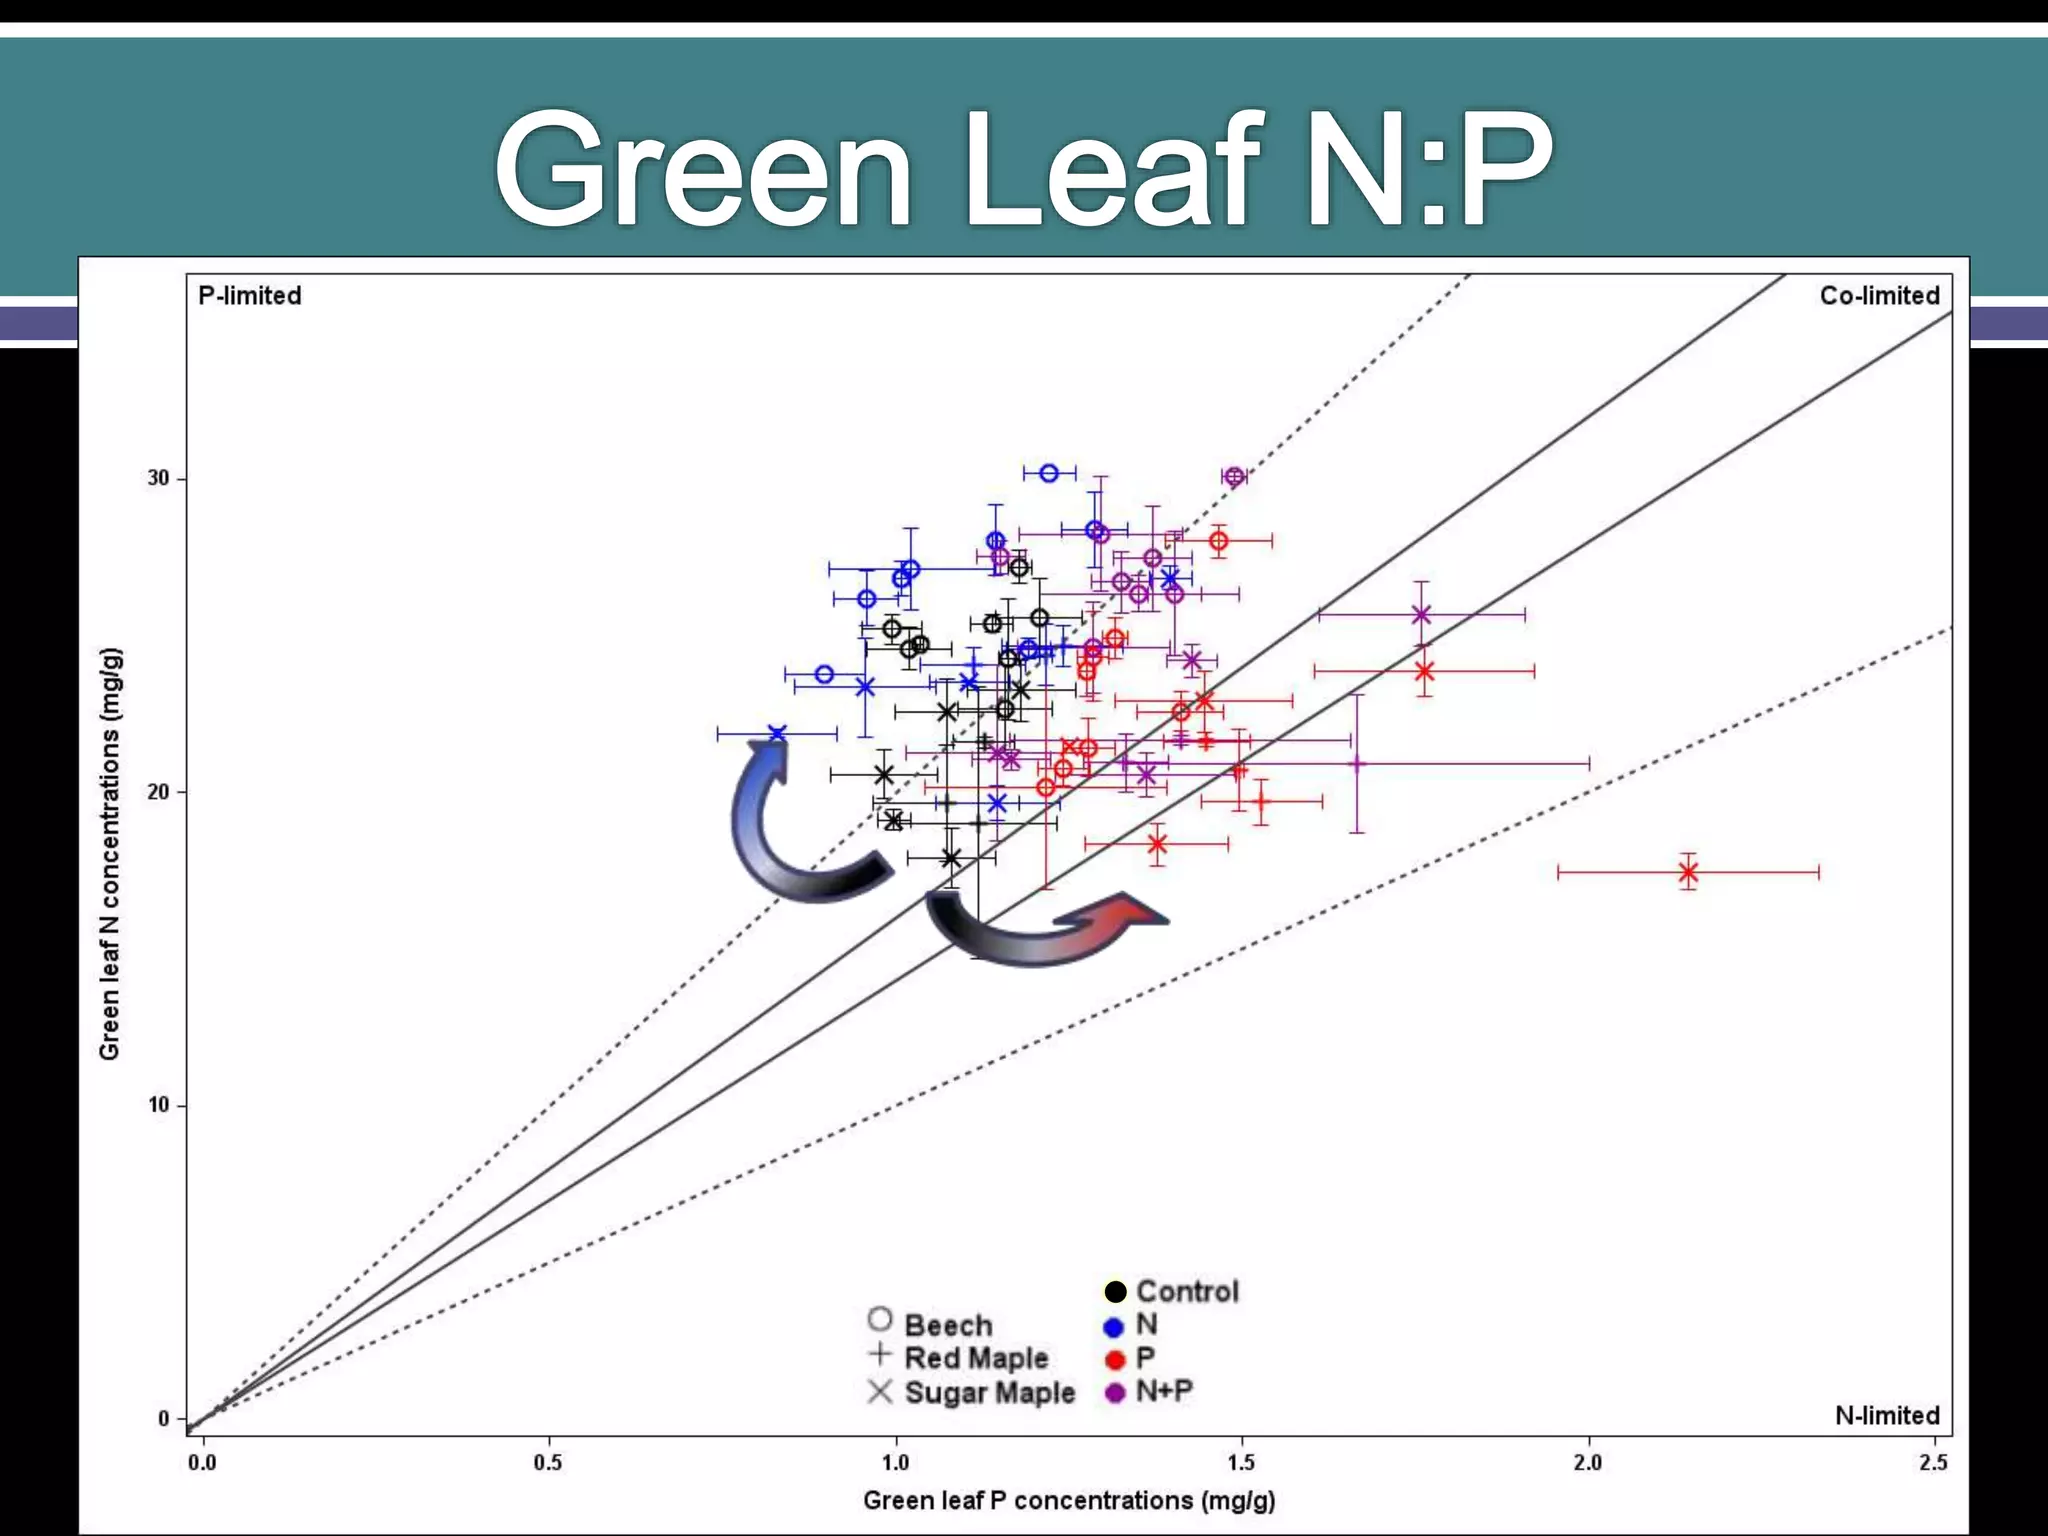
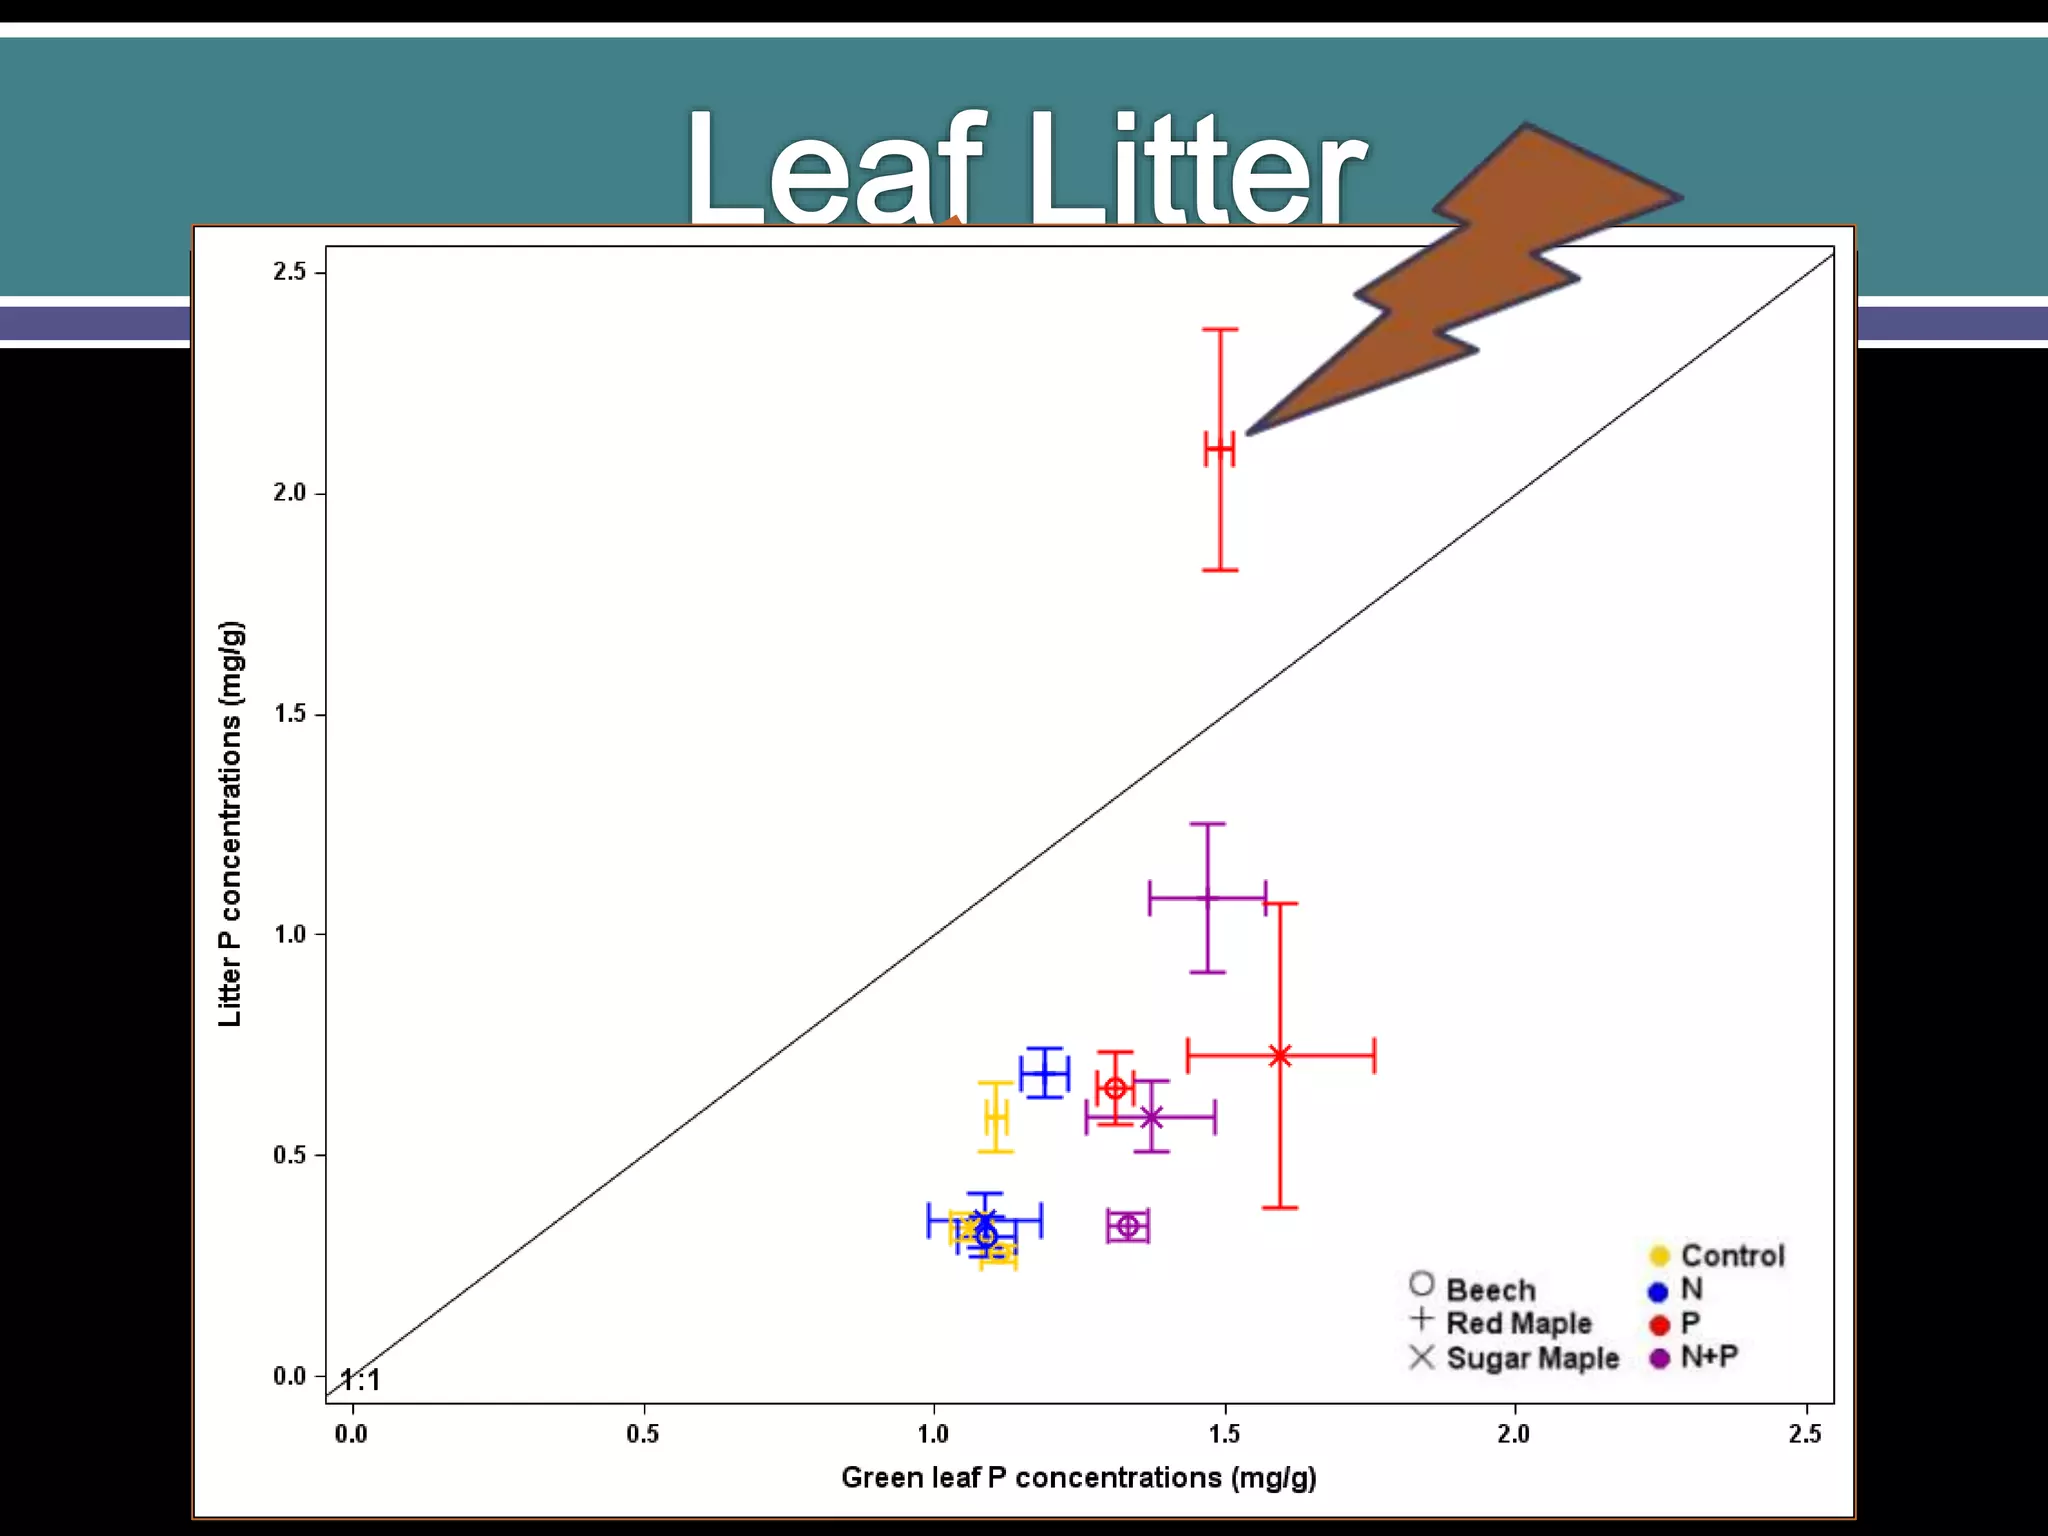
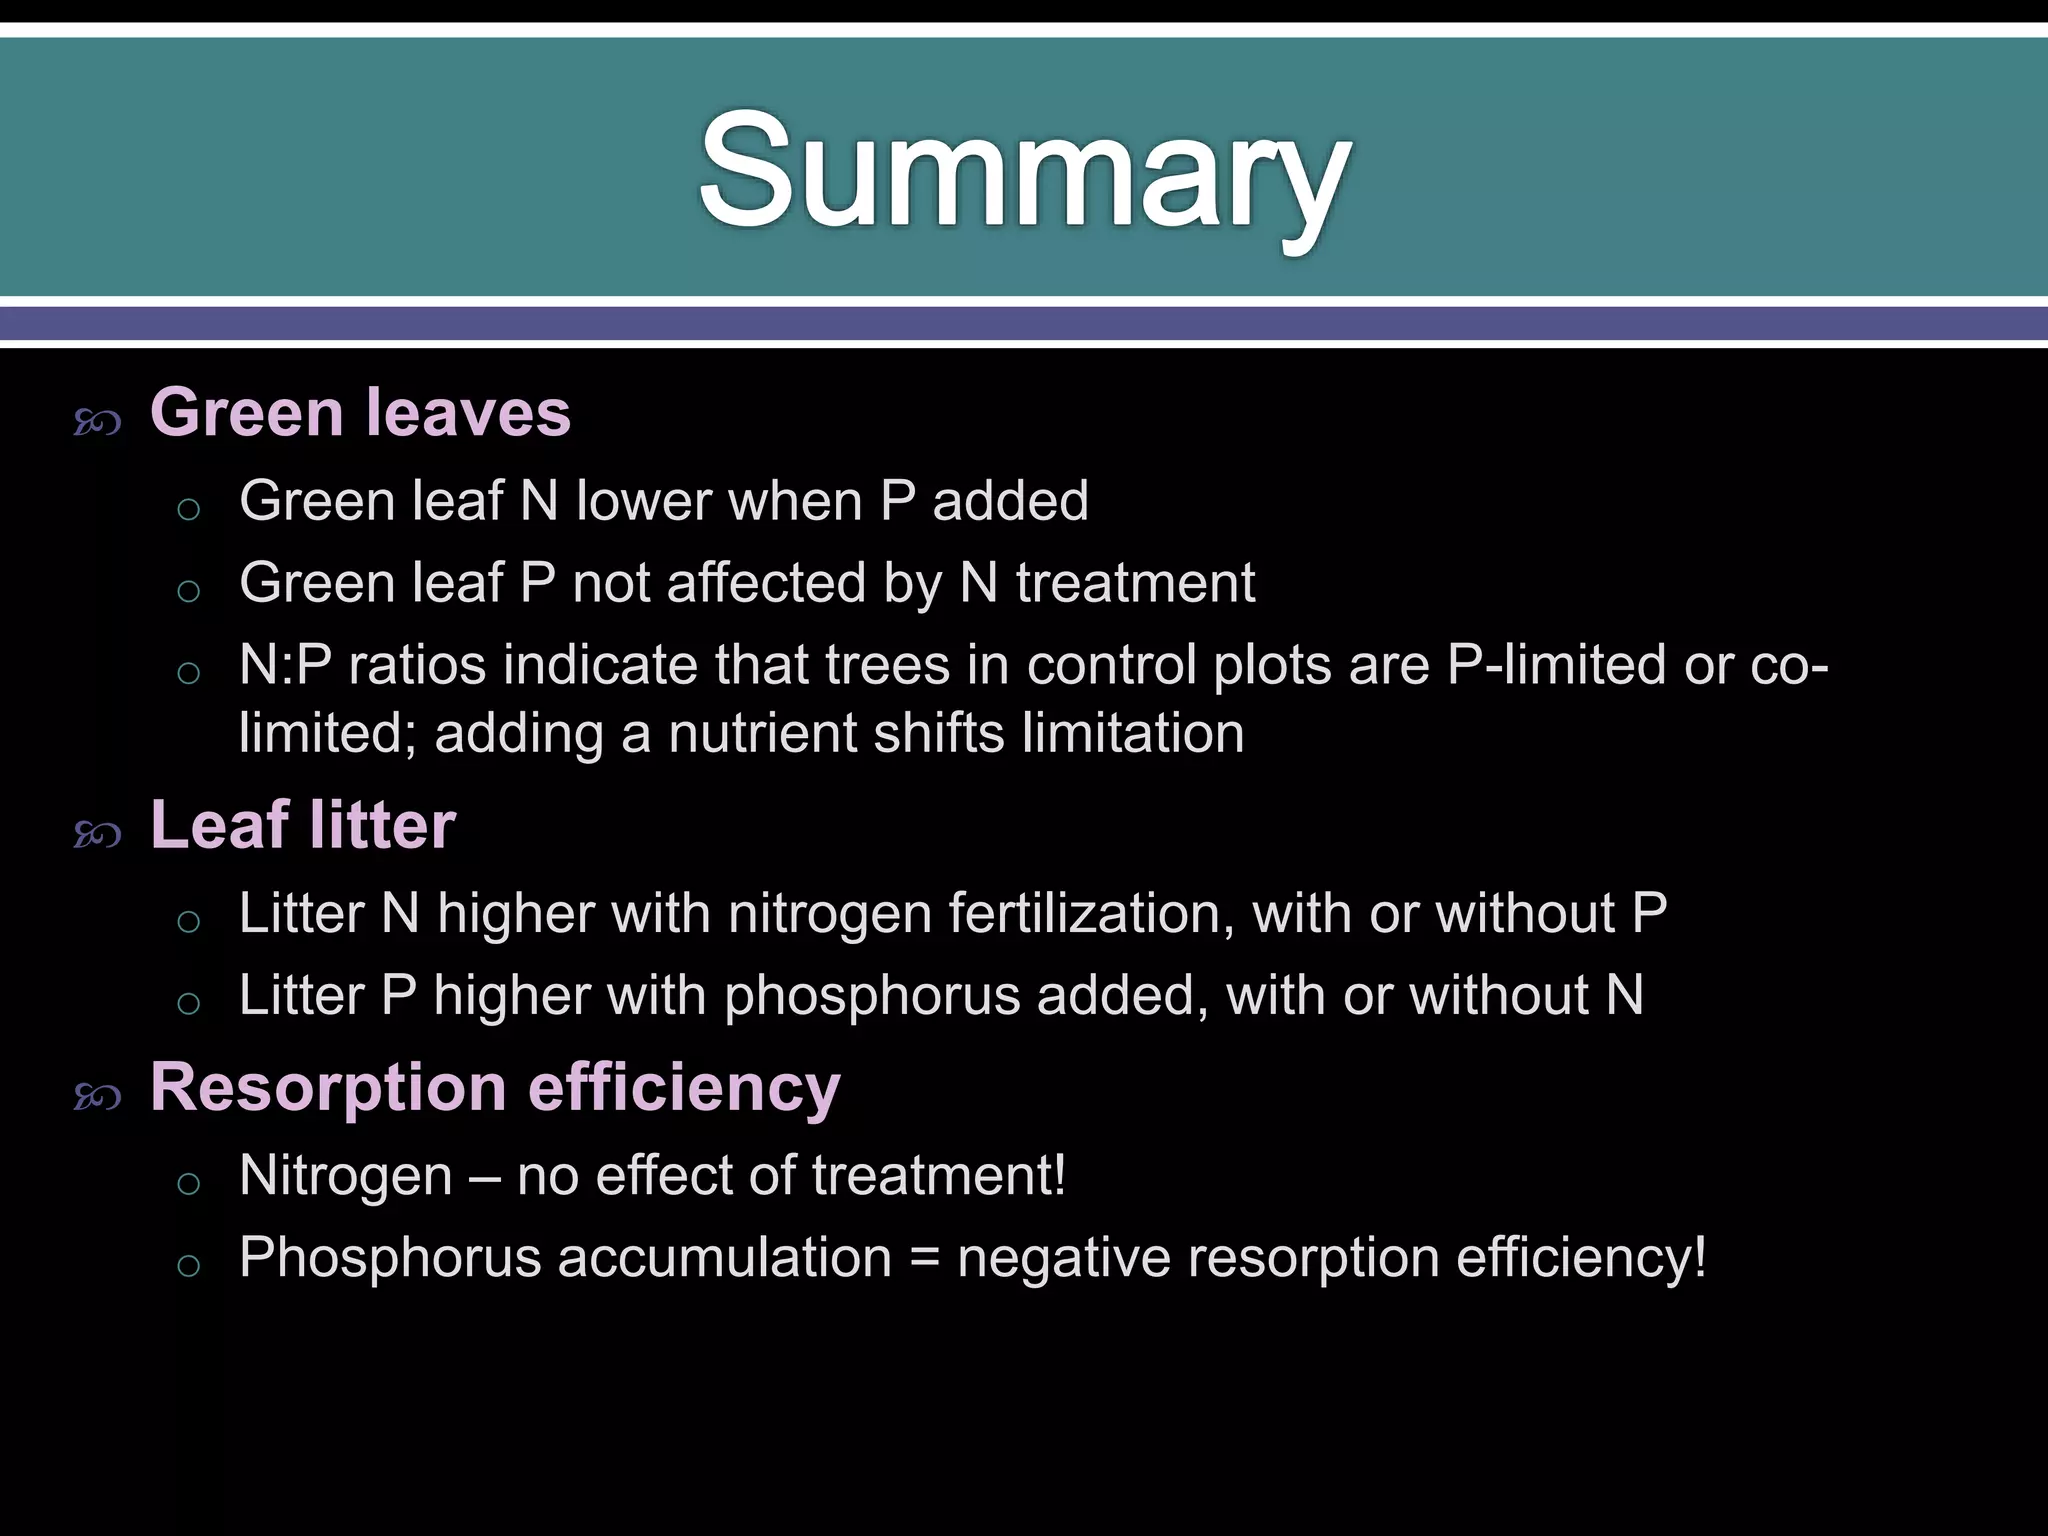
3) Experimental fertilization showed that green leaf nitrogen was lower with phosphorus addition, while green leaf phosphorus was unaffected by nitrogen addition. This suggests trees were phosphorus-limited or co-limited in control plots.