
Recommended
More Related Content
Similar to Sheet1resistance of resistorTime Constant = 5.3s10v from power sup.docx
Similar to Sheet1resistance of resistorTime Constant = 5.3s10v from power sup.docx (20)
More from maoanderton
More from maoanderton (20)
Recently uploaded
Recently uploaded (20)
Sheet1resistance of resistorTime Constant = 5.3s10v from power sup.docx
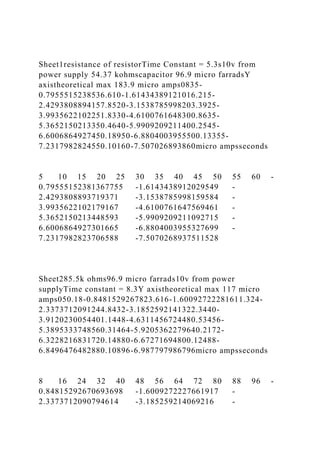
- 1. Sheet1resistance of resistorTime Constant = 5.3s10v from power supply 54.37 kohmscapacitor 96.9 micro farradsY axistheoretical max 183.9 micro amps0835- 0.7955515238536.610-1.61434389121016.215- 2.4293808894157.8520-3.1538785998203.3925- 3.9935622102251.8330-4.6100761648300.8635- 5.3652150213350.4640-5.9909209211400.2545- 6.6006864927450.18950-6.8804003955500.13355- 7.2317982824550.10160-7.507026893860micro ampsseconds 5 10 15 20 25 30 35 40 45 50 55 60 - 0.79555152381367755 -1.6143438912029549 - 2.4293808893719371 -3.1538785998159584 - 3.9935622102179167 -4.6100761647569461 - 5.3652150213448593 -5.9909209211092715 - 6.6006864927301665 -6.8804003955327699 - 7.2317982823706588 -7.5070268937511528 Sheet285.5k ohms96.9 micro farrads10v from power supplyTime constant = 8.3Y axistheoretical max 117 micro amps050.18-0.8481529267823.616-1.60092722281611.324- 2.3373712091244.8432-3.1852592141322.3440- 3.9120230054401.1448-4.6311456724480.53456- 5.3895333748560.31464-5.9205362279640.2172- 6.3228216831720.14880-6.67271694800.12488- 6.8496476482880.10896-6.987797986796micro ampsseconds 8 16 24 32 40 48 56 64 72 80 88 96 - 0.84815292670693698 -1.6009272227661917 - 2.3373712090794614 -3.185259214069216 -
- 2. 3.912023005428146 -4.6311456723913524 - 5.3895333748196981 -5.92053622787164 - 6.3228216830624246 -6.6727169400157784 - 6.8496476481748561 -6.9877979866556732 Sheet384.37k ohms96.9 micro farradstime constant 5.310vx axisy axis4.855-0.66358837837.7410-1.48722027978.9815- 2.28278246579.520-2.99573227369.7625- 3.7297014486voltsseconds 5 10 15 20 25 -0.6635883783184009 - 1.4872202797098513 -2.2827824656978661 - 2.99573227355399 -3.7297014486341906 Sheet4resistance 85.5k ohm96.9 micro farradtime constant = 8.3s10vx axisy axis5.348-0.76356964497.8916- 1.55589714559.0624-2.36446049679.5432- 3.07911388259.7640-3.7297014486voltsseconds 8 16 24 32 40 seconds -0.76356964485649126 - 1.5558971455060702 -2.3644604967121334 - 3.0791138824930413 -3.7297014486341906 R-C Circuits Purpose: This lab will consider another electrical component with unique characteristics, the capacitor. The lab will also
- 3. provide practice constructing and interpreting graphs for the purpose of circuit analysis. Introduction: As you have learned, a capacitor in its simplest form is two parallel plates of conductive material, separated by a non-conductive material that prevents the plates from touching. Capacitance, “C”, is measured in Farads (F), with typical values of capacitors being measured in μF. Capacitor labeling sometimes deviates from standard metric prefixes in that an upper case “M” is often used in place of the μ symbol for micro- (x 10-6). Do not confuse it with mega- (x 10+6). A mega-Farad capacitor would be enormous, if one could even be built! As an electrical potential (voltage) is placed across the capacitor, electrical charge flows (current) from the voltage source and builds up on the plates of the capacitor. If connected to a DC source, the current will continue to flow until the charge built up across the capacitor reaches the maximum level of the capacitor for the source voltage. This charge will remain until a pathway is provided between the two plates for the charge to dissipate. A capacitor’s value is determined by the amount of charge (Q) it will hold when charged to a particular voltage: There are two commonly used symbols for capacitors: and When connected to an AC source, the capacitor will likely never reach a full charge in one direction before the source polarity is reversed, and in this way, current flows more or less continuously through a capacitor in an AC circuit, depending on the value of the capacitor and the frequency of the input. Additional information on this topic may be found in your text.
- 4. Procedure: In this exercise, we will investigate the properties of a relatively simple circuit involving capacitors and resistors. The circuit is important because it has numerous applications and because it illustrates various techniques used in “solving” circuits. Date Last Modified March 10, 2017 Page Number 6 C S R A capacitor, C, has been charged to a voltage, V, so there is a charge, Q = CV stored on the capacitor. C S R When the switch, S, is closed, the charge flows around the circuit as current to equalize the two plates of the capacitor. We will describe the current as a function of time mathematically, and in practice, and show that they are consistent. The voltage across the capacitor is
- 5. The voltage across the resistor is Using Kirchhoff’s 1st law…….. (read: current is the flow of charge over time) so…………………….. The mathematical solution* to this equation is: *See Appendix 1 time i
- 6. The solution is a decaying exponential as shown in the above graph. The values of R and C determine how rapidly the current decays. The greater the value of C, the more charge there is to dissipate, and the greater the value of R, the less current will flow, both of which increase the time required. RC determines the time constant, (tau) of the circuit. It has units of time: Put in the standard units for these quantities: Part 1: (Discharge) The circuit for this portion of the lab is like the drawing below: A DC Measure the voltage, V, of the power supply (or battery), the resistance, R, and the capacitance, C (capacitance meters must be shared) For a given set of values of V, R, and C: Move the switch 1st to the left to charge the capacitor (few seconds). Notice there is no resistor in the charging loop, so the capacitor will charge quickly. Then flip switch to the right and start the time. Collect a set of data (i, t) for 3 or 4 time periods, . Change the value of C and/or R and take another set of data. Do this for at least two combinations of R and C. Choose values of RC that will facilitate data collection. (A time constant of 0.1 second would make it difficult to take multiple readings within 3 - 4 time
- 7. constants.) As always, we are looking to compare our observed values with the theoretical values, in this instance we will look at times. Starting with the equation we can see that using a graph to determine the time constant (RC) can be difficult since it is part of an exponent. If we rearrange it to the general form y=mx + b, where the slope, m, is some function of the time constant, we can then solve for the observed value: >>> >>> . Now, if we graph on the “y” axis and t on the “x” axis, the slope will equal . Create the graph, find the slope and solve for RC. Compare that to the theoretical value. WARNING: Complete part 1 BEFORE moving on to part 2. Change the multimeter lead connection from the Amps to the V/Ω connection before proceding. Failure to do so may damage the meter! Part 2: (Charging) The circuit for this portion of the lab is like the drawing below: Use the same components (resistor and capacitor) that you used for part 1. DC V Note that there is no resistor in the discharge loop, so the capacitor discharges quickly. First move the switch to the right to discharge the capacitor (few seconds). Then flip the switch to the left and start the
- 8. time. Collect a set of data (VC, t) for 3 or 4 time periods, . Do this for the same combinations of R and C you used for Part 1. The mathematical solution for the current in this circuit is similar to the discharge equation from part 1. Using Kirchoff’s 1st law…….. Since the voltages across the capacitor and resistor are in opposition to the source voltage, as the capacitor charges (voltage increases) the voltage across, and current through, the resistor will drop at the same rate determined by the time constant in part 1. Since the sum of VR and VC must equal V0, the voltage across the capacitor can be expressed as: so at 1, VC will be .632V0, etc. Using a similar method to re-arrange the equation to allow us to solve for RC using a graph, we come up with: . Graphing on the “y” axis and t on the “x” axis again allows us to solve for RC using the slope of the graph. Analysis: Graphyour data from the discharging and charging circuits as described above. Compare the theoretical value of the time constant (RC) to the observed values for both the charging and discharging circuits found using the graphs. Do the observed values match the theoretical values? Do the observed values for the same combination of R and C match for both the charging circuit and the discharging circuit? Should they? Lab Evaluation – Please provide feedback on the following areas, comparing this lab to your previous labs: How much fun you had completing this lab; How well the lap prep period
- 9. explained this lab; The amount of work required compared to the time allotted; Your understanding of this lab; The difficulty of this lab; How well this lab tied in with the lecture. Please assign each of the listed categories with a value from 1-5, with 5 being the best, 1 the worst. Comments supporting or elaborating on your assessment can also be very helpful in improving the future labs. *Appendix 1: K’s 1st law: ; Integrate both sides: Raise both sides to a power of e: Since
- 10. When , but q0=CV so Now, taking the derivative of both sides wrt time: R ViR = 0 q ViR C S==+ dq i dt = 0 qdqdqdt R CdtqRC +=Þ=- 0 t RC iie -