Electric Circuits Lab
Series RC Circuits: Phase Angle, Phase Lag, and Capacitors as Integrators
I.
Objectives:
After completing this lab experiment using, you should be able to:
1. Understand the effect of frequency on capacitive reactance.
2. Measure the impedance of an RC circuit.
3. Measure the phase angle and phase lag of an RC circuit using the oscilloscope.
4. Draw the impedance and voltage phasor diagrams.
5. Understand how a capacitor integrates current.
II.
Parts List:
1. Resistor 100 Ω, 1 kΩ, 6.8 kΩ
2. Capacitors 0.1 µF, 0.01 µF
III.
Procedures:
Part I:
1.
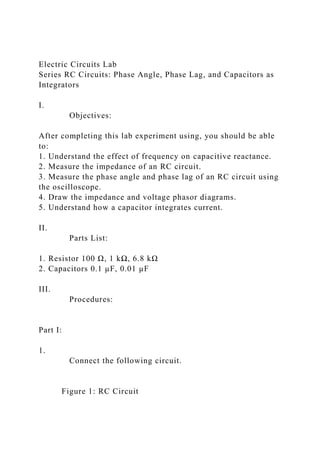
Connect the following circuit.
Figure 1: RC Circuit
2.
Connect one DMM across the resistor and one DMM across the capacitor. Set both DMMs to read AC voltage.
Measure the voltage drop across each component. Record the result in
Table 1.
3. Use Ohm’s law to
calculate the current flowing through the resistor. Since the circuit in Figure 1 is a series RC circuit, the same current will flow through the capacitor and the resistor.
Record the result in
Table 1.
Total current, I =
4.
Calculate the capacitive reactance using Ohm’s law. Record the result in
Table 2.
Capacitive Reactance, XC =
5. Now,
calculate the capacitive reactance value using the equation below.
Record the result in
Table 1 under Computed Reactance, XC.
Capacitive Reactance,
Capacitor C1
Voltage across, R
846 mV
Voltage across, C
583 mV
Total Current, I
0.846 mA
Capacitive Reactance, XC
686 Ω
Computed Reactance, XC
Table 1: Calculated and measured values
6.
Adjust the function generator frequency following the steps in
Table 2. Use the DMM to
measure the voltage across the resistor and the capacitor.
Record your measurements below.
Frequency (in Hz)
VR
(measured)
VC
(measured)
I =
(calculated)
XC =
(calculated)
XC =
(calculated)
300
983 mV
186 mV
0.983 mA
189 Ω
1k
846 mV
583 mV
0.846 mA
686 Ω
3k
884 mV
468 mV
0.884 mA
529 Ω
5k
953 mV
302 mV
0.953 mA
317 Ω
7k
975 mV
221 mV
0.975 mA
227 Ω
9k
985 mV
174 mV
0.985 mA
177 Ω
11k
990 mV
145 mV
0.990 mA
147Ω
13k
993 mV
121 mV
0.993 mA
122 Ω
15k
994 mV
105 mV
0.994 mA
106 Ω
Table 2: Calculated and measured values
7.
Plot the graph for
Frequency vs. VC.
(Use Excel or Word to Create the Plot)
Plot 1: Frequency vs. VC
Part II:
8.
Build the circuit shown in Figure 2.
Figure 2: Series RC Circuit
9.
Set the source voltage amplitude to
1.5 Vp and
frequency to
500 Hz.
10.
Connect Channel .
Electric Circuits Lab Series RC Circuits Phase Angle, Phase Lag.docx
1. Electric Circuits Lab
Series RC Circuits: Phase Angle, Phase Lag, and Capacitors as
Integrators
I.
Objectives:
After completing this lab experiment using, you should be able
to:
1. Understand the effect of frequency on capacitive reactance.
2. Measure the impedance of an RC circuit.
3. Measure the phase angle and phase lag of an RC circuit using
the oscilloscope.
4. Draw the impedance and voltage phasor diagrams.
5. Understand how a capacitor integrates current.
II.
Parts List:
1. Resistor 100 Ω, 1 kΩ, 6.8 kΩ
2. Capacitors 0.1 µF, 0.01 µF
III.
Procedures:
Part I:
1.
Connect the following circuit.
Figure 1: RC Circuit
2. 2.
Connect one DMM across the resistor and one DMM
across the capacitor. Set both DMMs to read AC voltage.
Measure the voltage drop across each component.
Record the result in
Table 1.
3. Use Ohm’s law to
calculate the current flowing through the resistor. Since
the circuit in Figure 1 is a series RC circuit, the same current
will flow through the capacitor and the resistor.
Record the result in
Table 1.
Total current, I =
4.
Calculate the capacitive reactance using Ohm’s law.
Record the result in
Table 2.
Capacitive Reactance, XC =
5. Now,
calculate the capacitive reactance value using the
equation below.
Record the result in
Table 1 under Computed Reactance, XC.
3. Capacitive Reactance,
Capacitor C1
Voltage across, R
846 mV
Voltage across, C
583 mV
Total Current, I
0.846 mA
Capacitive Reactance, XC
686 Ω
Computed Reactance, XC
Table 1: Calculated and measured values
6.
Adjust the function generator frequency following the
steps in
Table 2. Use the DMM to
measure the voltage across the resistor and the
capacitor.
Record your measurements below.
Frequency (in Hz)
VR
(measured)
5. 302 mV
0.953 mA
317 Ω
7k
975 mV
221 mV
0.975 mA
227 Ω
9k
985 mV
174 mV
0.985 mA
177 Ω
11k
990 mV
145 mV
0.990 mA
147Ω
13k
993 mV
121 mV
0.993 mA
122 Ω
15k
994 mV
105 mV
0.994 mA
106 Ω
Table 2: Calculated and measured values
6. 7.
Plot the graph for
Frequency vs. VC.
(Use Excel or Word to Create the Plot)
Plot 1: Frequency vs. VC
Part II:
8.
Build the circuit shown in Figure 2.
Figure 2: Series RC Circuit
9.
Set the source voltage amplitude to
1.5 Vp and
frequency to
500 Hz.
10.
Connect Channel A of the oscilloscope across the
resistor and measure the peak voltage drop (VR). Record the
result in
Table 3.
11. Use Ohm’s law to
calculate the peak current flowing through the resistor.
Because it is a series circuit, the same current will flow through
the capacitor.
Record the result in
Table 3.
7. Total current I =
VR
I
VC
XC
ZT
Ө
313 mV
46 mA
1.46 V
32 mΩ
32.6 mΩ
Table 3: Calculated and measured values
12.
Connect Channel B of the oscilloscope across the
capacitor and
measure the peak voltage drop (VC). Record the value
in
Table 3.
13.
Calculate the capacitive reactance using Ohm’s law.
Record the result in
Table 3.
8. Capacitive Reactance XC =
14. Now,
calculate the total impedance (ZT) value using the
equation below.
Record the result in
Table 3.
Total Impedance (ZT) =
15.
Calculate the phase angle between VR and VS using the
formula below.
Record the result in
Table 3. Also,
record this value in
Table 4 under Phase Angle calculated value.
Phase angle,
Part III: Phase Angle and Phase Lag Measurement
Phase Angle
16.
Connect Channel A of the oscilloscope across the
resistor and Channel B of the oscilloscope across the function
generator and run the simulation.
17. The waveforms should look like the ones shown in Figure 4.
9. Figure 4: VS and VR waveforms
18. Obtain a stable display showing a couple of cycles for
Channel B (which is showing VS) and disable Channel A by
setting it to 0.
19.
Measure the time period (T) of the source voltage.
Record the result in
Table 4 below. (Use the cursors to measure the period
(on the scope it will show as T2-T1). Remember that the period
is the time taken to complete one cycle). See Figure 5.
Figure 5: Measuring time period (T)
Type of Angle
Measured
Period (T)
Time difference (∆t)
Measured Angle
Calculated Angle
Phase angle θ
2 ms
432.812 us
77.9
77.9
Phase Lead Φ
Table 4: Phase angle and phase lag measurements
10. 20. Now
set the oscilloscope to view both the channels.
21.
Adjust the amplitude of the signals using Channel A
and Channel B V/Div scale until both channels appear to have
the same amplitude as seen on the scope face. (as close as
possible)
22. Spread the signals horizontally using the Timebase
(Sec/Div) control until both signals are just visible across the
screen as shown below.
23.
Measure the time duration between the two signals (∆t)
and record the result in
Table 4 above. (Use cursors as shown below in Figure
6)
Figure 6: Measuring the time difference
24.
Calculate the phase angle using the formula below and
record the result in
Table 4.
Phase angle, θ = (∆t/T) * 360°
Phase Lag
25.
Connect your circuit as shown in
Figure 7. When the output of an RC circuit is taken
across the capacitor, the circuit is called an RC lag circuit. The
output voltage in an RC lag circuit will lag the input voltage.
11. Figure 7: RC Lag Circuit
26.
Calculate the phase lag using the equation below.
Notice the similarity to the equation for the phase angle. The
phase lag angle and phase angle of an RC circuit are
complementary angles. (Their sum is 90°.) Use R and XC values
from
Table 3.
Phase Lag,
27.
Measure the time period (T) of the source voltage (as in
Step 19). Record this value in
Table 4.
28. Now
set the oscilloscope to view both the channels.
29.
Adjust the amplitude of the signals using Channel A
and Channel B V/Div scale until both channels appear to have
the same amplitude as seen on the scope face. (as close as
possible)
30. Spread the signals horizontally using the Timebase
(Sec/Div) control until both signals are just visible across the
screen as shown in Figure 6.
31.
Measure the time duration between the two signals (∆t)
and record the result in
Table 4 above.
32.
12. Calculate the phase lag using the formula below and
record the result in
Table 4.
Phase lag, ∅ = (∆t/T) * 360°
33.
Plot the Voltage and Impedance Phasor Diagrams.
Clearly indicate the phase angle and the phase lag.
Measure the peak voltages for VR and VC with the
oscilloscope.
(Use Excel or Word to create diagrams)
Plot 2(a) Impedance Phasor Plot
2(b) Voltage Phasor
Part IV: The Capacitor Integrates Current
13. 34.
Construct the following RC circuit in Multisim. Set the
clock voltage source to 10 kHz, 10V, 50% duty cycle.
Figure 9. Integrator Circuit
35.
Connect Channel A across the resistor and Channel B
across the capacitor. (Note: change one or both trace colors to
better observe the two signals)
Figure 9a. Integrator Circuit with Oscilloscope Connections
36.
Run the simulation. Your signals should look like the
example in Figure 9b.
Figure 9b: Capacitor as an integrator waveforms
37. Channel A will show the voltage across the resistor. This
signal can be used to find the circuit current using Ohm’s law.
38. Channel B shows the voltage across the capacitor.
Show that this signal satisfies the following equation.
We will do this in intervals in the following steps.
14. 39. Refer to Figure 10 to answer the following questions.
Figure 10: Integrator values, 0 to 50 µs
a. The signal has a period of 100 µs.
Write the equation for the circuit current on the interval
0 to 50 µs. On the interval of 0 to 50 µs, vR(t) is constant so the
current will be constant as well.
b.
Write the equation for the voltage across the capacitor
by solving the integral. You will need to read the value vC(0)
from Figure 10.
c.
Confirm your equation by predicting the value of vC(50
µs).
d.
Read the value of vC(50 µs) from Figure 10.
40. Refer to Figure 11 to answer the following questions.
Figure 11: Integrator values, 50 to 100 µs
a. The signal has a period of 100 µs.
Write the equation for the circuit current on the interval
50 µs to 100 µs. On the interval of 50 to 100 µs, vR(t) is
constant so the current will be constant as well.
15. b.
Write the equation for the voltage across the capacitor
by solving the integral. You will need to read the value vC(50)
from Figure 11.
c.
Confirm your equation by predicting the value of
vC(100 µs).
d.
Read the value of vC(100 µs) from Figure 11.
1
image3.wmf
oleObject2.bin
oleObject3.bin
image4.wmf
oleObject4.bin
image5.png
oleObject5.bin
image6.wmf
oleObject6.bin
image7.wmf
oleObject7.bin
image8.png
image9.png
image10.png
image11.png
image12.png
image13.png
image14.png
image15.png
image16.png
16. image1.emf
image2.wmf
oleObject1.bin
Electric Circuits Lab
Instructor: -----------
Series RC Circuits
Student Name(s): Click or tap here to enter text.
Click or tap here to enter text.
Honor Pledge:
I pledge to support the Honor System of ECPI. I will refrain
from any form of academic dishonesty or deception, such as
cheating or plagiarism. I am aware that as a member of the
academic community, it is my responsibility to turn in all
suspected violators of the honor code. I understand that any
failure on my part to support the Honor System will be turned
over to a Judicial Review Board for determination. I will report
to the Judicial Review Board hearing if summoned.
Date: 1/1/2018
Contents
17. Abstract 3
Introduction 3
Procedures 3
Data Presentation & Analysis 4
Calculations 4
Required Screenshots 4
Conclusion 4
References 5
Lab Report Instructions:
(This instruction box is to be deleted before submission of the
Lab report)
Before starting on your lab report, please follow the following
steps:
1) Follow the instructions listed provided in the lab
instructions.
2) Complete this
lab report. Upon completion, you will submit
this lab report and your working Multisim files to your
instructor.
Abstract
(This instruction box is to be deleted before submission of the
Lab report)
What is an Abstract?
This should include a brief description of all parts of the lab.
The abstract should be complete in itself. It should summarize
the entire lab; what you did, why you did it, the results, and
your conclusion. Think of it as a summary to include all work
done. It needs to be succinct yet detailed enough for a person to
know what this report deals with in its entirety.
Objectives of Week 3 Lab 2:
18. · Understand the effect of frequency on capacitive reactance.
· Measure the impedance of an RC circuit.
· Measure the phase angle and phase lag of an RC circuit using
the oscilloscope.
· Draw the impedance and voltage phasor diagrams.
· Understand how a capacitor current.
Introduction
(This instruction box is to be deleted before submission of the
Lab report)
What is an Introduction?
In your own words, explain the reason for performing the
experiment and give a concise summary of the theory involved,
including any mathematical detail relevant to later discussion in
the report. State the objectives of the lab as well as the overall
background of the relevant topic.
Address the following items in your introduction:
· What is Impedance for an RC circuit? (Give formula)
· What is phase angle for an RC circuit? How is it calculated?
· What is phase lag for an RC lag circuit? How is it calculated?
· How/why does a capacitor integrate current? Give
formula.Procedures
(This instruction box is to be deleted before submission of the
Lab report)
This section should contain the procedures as outlined in the lab
instructions.
Part I:
1.
19. Connect the following circuit.
Figure 1: RC Circuit
2.
Connect one DMM across the resistor and one DMM
across the capacitor. Set both DMMs to read AC voltage.
Measure the voltage drop across each component.
Record the result in
Table 1.
3. Use Ohm’s law to calculate the current flowing through the
resistor. Since the circuit in
Figure 1 is a series RC circuit, the same current will
flow through the capacitor and the resistor.
Record the result in
Table 1.
Total current, I =
4.
Calculate the capacitive reactance using Ohm’s law.
Record the result in
Table 2.
Capacitive Reactance, XC =
5. Now,
20. calculate the capacitive reactance value using the
equation below.
Record the result in
Table 1 under Computed Reactance, XC.
Capacitive Reactance,
6.
Adjust the function generator frequency following the
steps in
Table 2. Use the DMM to
measure the voltage across the resistor and the
capacitor.
Record your measurements below.
7.
Plot the graph for
Frequency vs. VC.
Part II:
8.
Build the circuit shown in
Figure 2.
Figure 2: Series RC Circuit
9.
Set the source voltage amplitude to
1.5 Vp and
frequency to
500 Hz.
10.
21. Connect Channel A of the oscilloscope across the
resistor and
measure the peak voltage drop (VR).
Record the result in
Table 3.
11. Use Ohm’s law to
calculate the peak current flowing through the resistor.
Because it is a series circuit, the same current will flow through
the capacitor.
Record the result in
Table 3.
Total current I =
12.
Connect Channel B of the oscilloscope across the
capacitor and
measure the peak voltage drop (VC).
Record the value in
Table 3.
13.
Calculate the capacitive reactance using Ohm’s law.
Record the result in
Table 3.
Capacitive Reactance XC =
14. Now,
calculate the total impedance (ZT) value using the
22. equation below.
Record the result in
Table 3.
Total Impedance (ZT) =
15.
Calculate the phase angle between VR and VS using the
formula below.
Record the result in
Table 3. Also,
record this value in
Table 4 under Phase Angle calculated value.
Phase angle,
Part III: Phase Angle and Phase Lag Measurement
Phase Angle
16.
Connect Channel A of the oscilloscope across the
resistor and Channel B of the oscilloscope across the function
generator and
run the simulation.
17. The waveforms should look like the ones shown in
Figure 4.
Figure 4: VS and VR waveforms
18. Obtain a stable display showing a couple of cycles for
Channel B (which is showing VS) and disable Channel A by
23. setting it to 0.
19.
Measure the time period (T) of the source voltage.
Record the result in
Table 4. (Use the cursors to measure the period (on the
scope it will show as T2-T1). Remember that the period is the
time taken to complete one cycle). See
Figure 5.
Figure 5: Measuring time period (T)
20. Now
set the oscilloscope to view both the channels.
21.
Adjust the amplitude of the signals using Channel A
and Channel B V/Div scale until both channels appear to have
the same amplitude as seen on the scope face. (as close as
possible)
22. Spread the signals horizontally using the Timebase
(Sec/Div) control until both signals are just visible across the
screen as shown below.
23.
Measure the time duration between the two signals (∆t)
and
record the result in
Table 4. (Use cursors as shown below in
Figure 6)
Figure 6: Measuring the time difference
24.
Calculate the phase angle using the formula below and
record the result in
24. Table 4.
Phase angle, θ = (∆t/T) * 360°
Phase Lag
25.
Connect your circuit as shown in
Figure 7. When the output of an RC circuit is taken
across the capacitor, the circuit is called an RC lag circuit. The
output voltage in an RC lag circuit will lag the input voltage.
Figure 7: RC Lag Circuit
26.
Calculate the phase lag using the equation below.
Notice the similarity to the equation for the phase angle. The
phase lag angle and phase angle of an RC circuit are
complementary angles. (Their sum is 90°.) Use R and XC values
from
Table 3.
Phase Lag,
27.
Measure the time period (T) of the source voltage (as in
Step 19).
Record this value in
Table 4.
28. Now
set the oscilloscope to view both the channels.
29.
Adjust the amplitude of the signals using Channel A
25. and Channel B V/Div scale until both channels appear to have
the same amplitude as seen on the scope face. (as close as
possible)
30. Spread the signals horizontally using the Timebase
(Sec/Div) control until both signals are just visible across the
screen as shown in
Figure 6.
31.
Measure the time duration between the two signals (∆t)
and
record the result in
Table 4 above.
32.
Calculate the phase lag using the formula below and
record the result in
Table 4.
Phase lag, ∅ = (∆t/T) * 360°
33.
Plot the Voltage and Impedance Phasor Diagrams.
Clearly indicate the phase angle and the phase lag.
Measure the peak voltages for VR and VC with the
oscilloscope.
Part IV: The Capacitor Integrates Current
34.
Construct the following RC circuit in Multisim. Set the
clock voltage source to 10 kHz, 10V, 50% duty cycle.
Figure 9. Integrator Circuit
35.
26. Connect Channel A across the resistor and Channel B
across the capacitor. (Note: change one or both trace colors to
better observe the two signals)
Figure 9a. Integrator Circuit with Oscilloscope Connections
36.
Run the simulation. Your signals should look like the
example in
Figure 9b.
Figure 9b: Capacitor as an integrator waveforms
37. Channel A will show the voltage across the resistor. This
signal can be used to find the circuit current using Ohm’s law.
38. Channel B shows the voltage across the capacitor. Show that
this signal satisfies the following equation. We will do this in
intervals in the following steps.
39. Refer to
Figure 10 to answer the following questions.
Figure 10: Integrator values, 0 to 50 µs
a. The signal has a period of 100 µs.
Write the equation for the circuit current on the interval
0 to 50 µs. On the interval of 0 to 50 µs, vR(t) is constant so the
current will be constant as well.
27. b.
Write the equation for the voltage across the capacitor
by solving the integral. You will need to read the value vC(0)
from
Figure 10.
c.
Confirm your equation by predicting the value of vC
(50 µs).
d.
Read the value of vC(50 µs) from
Figure 10.
40. Refer to
Figure 11 to answer the following questions.
Figure 11: Integrator values, 50 to 100 µs
a. The signal has a period of 100 µs.
Write the equation for the circuit current on the interval
50 µs to 100 µs. On the interval of 50 to 100 µs, vR(t) is
constant so the current will be constant as well.
b.
Write the equation for the voltage across the capacitor
by solving the integral. You will need to read the value vC(50)
from
28. Figure 11.
c.
Confirm your equation by predicting the value of
vC(100 µs).
d.
Read the value of vC(100 µs) from
Figure 11.
Data Presentation & Analysis
Capacitor C1
Voltage across, R
Voltage across, C
Total Current, I
Capacitive Reactance, XC
Computed Reactance, XC
29. Table 1: Calculated and measured values
Frequency (in Hz)
VR
(measured)
VC
(measured)
I =
(calculated)
XC =
(calculated)
XC =
(calculated)
300
1k
3k
31. Table 2: Calculated and measured values
(Use Excel or Word to Create the Plot)
Plot 1. Frequency vs. Voltage, VC
VR
I
VC
XC
ZT
Ө
Table 3: Calculated and measured values
Type of Angle
Measured
Period (T)
Time difference (∆t)
Measured Angle
Calculated Angle
32. Phase angle θ
Phase Lead Φ
Table 4: Phase angle and phase lag measurements
(Use Excel or Word to create diagrams)
Plot 2(a) Impedance Phasor Plot
2(b) Voltage Phasor
Calculations
Part I step 3: I =
Part I step 4: XC =
Part I step 5: Xc =
Part II step 11: I =
Part II step 13: XC =
Part II step 14: ZT =
Part II step 15:
Part III step 24:
Part III step 26:
Part III step 32:
Part IV step 39 a: i(t) =
Part IV step 39 b: vc(t) =
Part IV step 39 c: vc(50 µs) =
Part IV step 39 d: vc(50 µs) =
33. Part IV step 40 a: i(t) =
Part IV step 40 b: vC(t) =
Part IV step 40 c: vc(100 µs) =
Part IV step 40 d: vc(100 µs) =
Required Screenshots
Figure 12: Screenshot of Waveforms for Part 2 Step 10
Figure 13: Screenshot of Waveforms for Part 2 Step 12
Figure 14: Screenshot of Waveforms for Part 3 Step 19
Figure 15: Screenshot of Waveforms for Part 3 Step 23
Figure 16: Screenshot of Waveforms for Part 3 Step 27
Figure 17: Screenshot of Waveforms for Part 3 Step 31
Figure 18: Screenshot of Waveforms for Part 3 Step 33
Conclusion
(This instruction box is to be deleted before submission of the
Lab report)
What is a Conclusion?
This section should reflect your understanding of the
experiment conducted. Important points to include are a brief
discussion of your results, and an interpretation of the actual
experimental results as they apply to the objectives of the
experiment set out in the introduction should be given. Also,
discuss any problems encountered and how they were resolved.
Address the following in your conclusions:
· Were your measured and calculated capacitive reactance
34. values in agreement?
· What happened to the inductance and the capacitive reactance
as you increased the frequency of the voltage source?
· Were your measured and calculated phase angle values in
agreement?
· Which quantity leads in a series RC circuit? (Current or
voltage) How do you know?
· What happens to phase angle as the frequency increases? What
happens to phase angle as the frequency decreases?
· Were your measured and calculated phase lag values in
agreement?
· Which quantity lags in an RC lag circuit? (Source voltage or
capacitor voltage)
· What is the relationship between phase angle and phase lag?
· What happens to the phase lag as the frequency increases?
What happens to the phase lag as the frequency decreases?
References
Floyd, T. L., & Buchla, D. M. (2019).
Principles of Electric Circuits (10th Edition). Pearson
Education (US).
https://bookshelf.vitalsource.com/books/9780134880068
(2017) National Instruments Multisim (V 14.1) [Windows].
Retrieved from http://www.ni.com/multisim/
6
image3.wmf
oleObject1.bin
image4.wmf