Automation of temperature variation setup for impedance analyzer using LabVIEW
•Download as DOCX, PDF•
0 likes•69 views

The temperature is the measure of warmth or coldness of an object or substance with reference to some standard value. Temperature is most often measured with a mercury thermometer up to a particular range. But in industrial purpose, product generation requires very high temperatures. For measuring and controlling the temperature, normal thermometers are not sufficient. In such cases, temperatures of materials can be measured and controlled by using LabVIEW and temperature measuring devices. Merging of LabVIEW programming with the temperature interfacing devices provides a flexible platform for creating sophisticated measurement and control systems.

Recommended
More Related Content
What's hot
What's hot (20)
Similar to Automation of temperature variation setup for impedance analyzer using LabVIEW
Similar to Automation of temperature variation setup for impedance analyzer using LabVIEW (20)
Recently uploaded
Recently uploaded (20)
Automation of temperature variation setup for impedance analyzer using LabVIEW
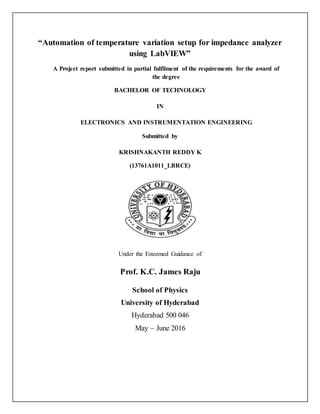
- 1. “Automation of temperature variation setup for impedance analyzer using LabVIEW” A Project report submitted in partial fulfilment of the requirements for the award of the degree BACHELOR OF TECHNOLOGY IN ELECTRONICS AND INSTRUMENTATION ENGINEERING Submitted by KRISHNAKANTH REDDY K (13761A1011_LBRCE) Under the Esteemed Guidance of Prof. K.C. James Raju School of Physics University of Hyderabad Hyderabad 500 046 May – June 2016
- 2. ACKNOWLEDGEMENT I would like to express my deep gratitude and happiness to those people who helped and supported me during the work on this project since the last six months. I am deeply indebted to my supervisor Prof. K. C. James Raju, for his valuable and expert guidance rendered to me. My sincere thanks to Mr. Rahul Gayam for his enormous support and help, whose experimental I knowledge was very helpful for me. It is my pleasure to acknowledge, Mr Rahul Gayam, for his timely help and advice during the entire span of the work. I would like to thank Mr. Mahmoud Saleh Alkathy, Mr. Andrews Joseph for their timely help and advice. KRISHNAKANTH REDDY 13761A1011
- 3. DECLERATION I hereby declare that the work titled “Automation of temperature variation setup for impedance analyzer using LabVIEW” is carried out by me during summer project (internship) in university of Hyderabad, India under the supervision of Prof. K. C. JAMES Raju, School of Physics, University of Hyderabad. And has not formed the basics for the award of any degree, associateship, fellowship or any other similar titles. Date: Signature of student Place: Hyderabad (KRISHNAKANTH)
- 4. Contents 1. INTRODUCTION 2. PRINCIPLE 3. IMPEDANCE ANALYZER 4. LIST OF FIGURES 5. CONCLUSION 6. FUTURE SCOPE 7. REFERENCES 8. ACKNOWLEDGEMENTS
- 5. 1. INTRODUCTION The temperature is the measure of warmth or coldness of an object or substance with reference to some standard value. Temperature is most often measured with a mercury thermometer up to a particular range. But in industrial purpose, product generation requires very high temperatures. For measuring and controlling the temperature, normal thermometers are not sufficient. In such cases, temperatures of materials can be measured and controlled by using LabVIEW and temperature measuring devices. Merging of LabVIEW programming with the temperature interfacing devices provides a flexible platform for creating sophisticated measurement and control systems. Basically, the temperature is measured in two ways, the contact method and the non-contact method. In contact method, the particular object for which temperature to be measured is in contact with the temperature measuring device. Thermistor, thermocouple, RTD are some of the contact type temperature measuring devices. In non-contact method, the measuring device is not in contact with the object for which temperature is measured. The present project is mainly focused to develop an experimental setup for measuring and controlling the temperature of the impedance analyzer using LabVIEW and thermocouple.
- 6. 2. PRINCIPLE Thermocouple The working principle of thermocouple is based on three effects, discovered by Seebeck, Peltier and Thomson. They are as follows: 1) Seebeck effect: The Seebeck effect states that when two different or unlike metals are joined together at two junctions, an electromotive force (Emf) is generated at the two junctions. The amount of emf generated is different for different combinations of the metals. Figure 2:petlier effect
- 7. 2) Peltier effect: As per the Peltier effect, when two dissimilar metals are joined together to form two junctions, emf is generated within the circuit due to the different temperatures of the two junctions of the circuit. Figure 3:Thomson effect 3) Thomson effect: As per the Thomson effect, when two unlike metals are joined together forming two junctions, the potential exists within the circuit due to temperature gradient along the entire length of the conductors within the circuit. In most of the cases the emf suggested by the Thomson effect is very small and it can be neglected by making proper selection of the metals. The Peltier effect plays a prominent role in the working principle of the thermocouple. 3 Apparatus i. LabVIEW software ii. Arduino Uno iii. MAX31855 iv. K-type thermocouple i. LabVIEW software LabVIEW (short for Laboratory Virtual Instrument Engineering Workbench) is a system-design platform and development environment for a visual
- 8. programming language from National Instruments. It is a graphical programming platform and provides tools to solve today’s problems, and the capacity for future innovation. LabVIEW programs are called virtual instruments, or VI. VI contains three components-the front panel, the block diagram, and the icon and connector pane. Figure 4: front panel and block diagram of LabVIEW We can use LabVIEW to communicate with hardware such as data acquisition, vision, and motion control devices, and GPIB, PXI, VXI, RS-232, and RS-484 devices. It has built-in features for connecting your application to the Web. Also we can create test and measurement, data acquisitions, instrument control, data logging, measurement analysis and report generation applications. ii. MAX31855 The MAX31855 BREAKOUT BOARD is an interface between the Arduino and the thermocouple. It acts as an amplifier and cold-junction compensation to the thermocouple.
- 9. The MAX31855 performs cold-junction compensation and digitizes the signal from a K-, J-, N-, T-, S-, R-, or E-type thermocouple. The data is output in a signed 14- bit, SPI-compatible, read-only format. This converter resolves temperatures to 0.25°C, allows readings as high as +1800°C and as low as -270°C, and exhibits thermocouple accuracy of ±2°C for temperatures ranging from -200°C to +700°C for K-type thermocouples. For full range accuracies and other thermocouple types, see the Thermal Characteristics specifications in the full data sheet. Figure 7:max31855
- 10. Figure 8: Pin connection of max31855 iii. K-type thermocouple
- 11. Figure 9:Type k thermocouple(nickel- chromium): The type k is the most common type of thermocouple. Its inexpensive, accurate, reliable. K-type thermocouple (chromel–alumel) in the standard thermocouple measurement configuration. The measured voltage can be used to calculate temperature , provided that temperature is known. The standard configuration for thermocouple usage is shown in the figure. Briefly, the desired temperature Tsense is obtained using three inputs—the characteristic function E(T) of the thermocouple, the measured voltage V, and the reference junctions' temperature Tref. The solution to the equation E(Tsense) = V + E(Tref) yields Tsense. These details are often hidden from the user since the reference junction block (with Tref thermometer), voltmeter, and equation solver are combined into a single product. 4. ARDUINO INTERFACING WITH LABVIEW Automation of high temperature setup using LabVIEW and Arduino, firstly we done an experiment by using lm35 which is a temperature sensor ,by using a lm35 we can measure more accurately than a thermistor ,it can be able to measure high output voltage than thermocouple .the circuit diagram and the LabVIEW front panel and block diagrams are shown below.
- 12. Figure 10:Circuit diagram for LM35 using Arduino In the above figure the 5v pin of analog pins is connected to positive ground and ground pin to the negative ground .a3 pin is connected to the Vout .to measure the the temperature change we placed an light dependent resistor so that if the temperature is low, moderate and high is shown by glowing different lights. Digital 8,9,10 pins are connected to the 1,3,4 pins of ldr .the 2 pin of the ldr is connected to ground.to the third pin of digital pins a fan is connected ,the fan will will rotates if the temperature is high.
- 13. Figure 11: Front panel diagram of LM35temperature sensor The above shown front panel consists of a thermometer, stop button maximum and minimum meter to maintain the temperature and temperature chart, analog pin channel to which it is connected and three bulbs are connected to indicate the low, moderate and high temperature. Error in and Error out are placed to know the error status of the program while executing.
- 14. Figure 12: Block diagram for LM35 temperature sensor After performing with the lm35 sensor we did the experiment by using the k-type thermocouple .but this k-type thermocouple is interfaced with Arduino using Arduino software and the max31855chip.
- 15. 6.Impedance analyser. An impedance analyzer is a computational device that measures opposition to current in alternating current (AC) systems. Impedance refers to how physical or chemical properties interact with current and voltage. In other words, impedance is how well a material or component passes current. This resulting ratio of voltage to current is measured in ohms (Ω). The equipment connects via input cables or uses a small handheld terminal probe for spot checking. First we observed the connections where the circuit was damaged. Bridge rectifier, IC and transistor arrays were damaged so we replaced them. The reason why these components had damaged due to high temperature that the IC and the components heat dissipation rating was inadequate due to which the wires got very hot and melted. Figure 15:Impedance analyzer By using this impedence analyzer first we have to take a sample this sample is fixed in between the two electrodes. After that we have to adjust the setting in analyzer first go to the option OPEN then select MEASURING and then click OKEY. When we completed this setting we notice that Captial gains ON highlighting so far they they were not being out there right now.
- 16. The sample wire have to place between the electrode. This circuit inside build wires in it and the perfect mixture into prepared to these worries have enough min. Some comparisons between different paul that we would see so that is why tuning actually had some circles as our circuit and have your sample eliminate this part.
- 17. The sample having nearly 160khz killer ants and probably a little bitbigger so we have to stick in it now we want to get right frequency sleepless.start at 60khz and stop at 70khz. By seeing the above figure we notice that we got the frequency in between 60khz to 70khz. The blue colour line indicates that it is a resonant frequency and yellow colour line indicates that bandwidth .so here the phase comes to 900.
- 18. 8.Conclusion Automation of various lab processes is very important, many of the older furnace models do not come with automated data acquisition for plotting temperature vs time. Generally temperature measurement using LabVIEW is done by using NI DAQcard. Although it is straightforward to connect and measure it is relatively more expensive than the setup we implemented here. In many experiments especially in rapid thermal processing of materials it is very crucial to plot temperature versus time measurement for better characterization of processing conditions. Using the setup we implemented automated data acquisition of temperature curves becomes very easy and can be used for any type of furnace using a thermocouple. Only the temperature sensing side of the project has been implemented thus far it needs to be augmented with furnace for high temperature and solenoid valves which control liquid nitrogen intake in order to fully operationalize and automate the temperature controlled impedance measurements from the Impedance analyzer.
- 19. 9. Future scope of the work • Project can be extended not only to monitor but to control the temperature over a wide range right from -200C to 1300C and augmented with an impedance measurement setup to take temperature dependent readings. • Support for infrared thermometer can also be included. • PID can be implemented in the software side with the same hardware to achieve better control of temperature. • Support for a wider variety of temperature sensors may be included like infrared thermometer using similar architecture.
- 20. 10 .References 1. www.simplelabs.co.in 2. www.adafuit.com 3. Instructables.com 4. www.mgsuperlabs.com 5. www.provotech.in 6. www.ni.com
- 21. 11.Acknowledgements We would like to express our heartfelt note of deep gratitude to Dr. K. C James Raju for his valuable discussions and advice throughout our project. We would like to thank G. Rahul for guiding us throughout the project and helping us to improve our technical knowledge for our study . Also we thank all other lab mates at high frequency lab in University of Hyderabad for their help and support.