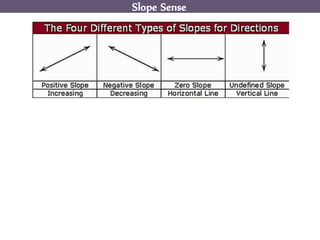
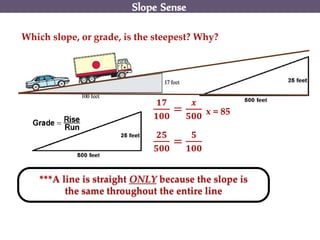
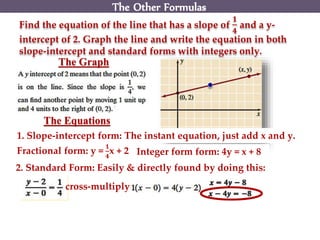
Today:
 No Warm-Up
 Review Slope & Other Formulas
 Examples & Practice
 Class Work 2.11
(Class Notes Section of Notebook)
Y is the dependent variable.
X is the independent variable.
The constant rate of change of a line is called
the slope of the line.
The rise is the difference of the y-values of two
points on a line.
The run is the difference in the x-values of
two points on a line.
The slope of a line is the ratio of rise
to run for any two points on the line.
change in y
change in x
Rise
Run
=
Slope Sense
(3, 2)
(–1, –2)
Then count horizontally to a
second point to find the run.
Count vertically from any
one point on the line to
find the rise.
Finding the Slope of a Line
slope= = 14
4
The slope of the line is 1.
–4
–4slope = = 1
It does not matter which
ordered pair you start with.
Slope Sense
Then count horizontally to a
second point to find the run.
Count vertically from any one
point on the line to find the rise.
slope = =2
4
1
2
The slope of the line is -
1
2
–2
–4
slope = = 1
2
(5, 4)
(1, 2)
Slope Sense
Slope Sense
What is the equation of this line?
The point here, is called the....
y-intercept. We know the
slope, so we can plug both into
the slope-intercept form of a
line and get.... y = 2/3x - 2
Slope Sense
What is the slope of the line?
Slope Sense
Slope Sense
Which slope, or grade, is the steepest? Why?
𝟏𝟕
𝟏𝟎𝟎
=
𝒙
𝟓𝟎𝟎 x = 85
𝟐𝟓
𝟓𝟎𝟎
=
𝟓
𝟏𝟎𝟎
***A line is straight ONLY because the slope is
the same throughout the entire line
Use graph paper and label the axes with the following values:
A car rental agency charges $25/day to rent a
compact car, and $50/day to rent a sports car.
For each car, graph the cost of renting for 1
to 3 days. Plot the points and connect with a
continuous line graph.
cost
days 1 2 3
y2 – y1
x2 – x1
m =
Slope measures how y changes, given a
change in x (which must come first).
In other words, “How will a change in our
independent variable affect the dependent
variable?
change in y
change in x
Over the same change in x, (3 days)
It’s easy to see that the sports car had
a greater affect on the ‘y’ (cost)...
Than the compact car, over the same change in x.
The steeper the line, the greater the change in y.
Slope Sense
Example:
The table shows the total cost of gas per gallon. Use the data to
make a graph. Find the slope of the line and explain what it shows.
Graph the data.
Cost of Gas
Gallons Cost
0 0
3 6
6 12
6
9
9
12
60
3
3 x
y
Gallons
Cost of Gas
Cost
0
Slope Sense
Example Continued
Find the slope of the line:
The slope of the line is 2. This means that for
every gallon of gas, you will pay another $2.
=
y2 – y1
x2 – x1
6
3
=
12 – 6
6 – 3
= 2
Slope Sense
Find the equation of the line that has a slope of
𝟏
𝟒
and a y-
intercept of 2. Graph the line and write the equation in both
slope-intercept and standard forms with integers only.
The Graph
The Equations
1. Slope-intercept form: The instant equation, just add x and y.
Fractional form: y =
𝟏
𝟒
x + 2 Integer form form: 4y = x + 8
2. Standard Form: Easily & directly found by doing this:
cross-multiply
The Other Formulas
Find the equation of the line that has a slope of 𝟑 and a y-
intercept of -1. Graph the line and write the equation in both
slope-intercept and standard forms with integers only for the
standard form.
On Your Own:
What if:
The only information you have is the slope
𝟑
𝟒
, and a point on the
line, (1,2). Use the correct equation & graph the line. Then write the
equation standard form with integers only.
You begin with the point-slope formula,
which becomes the slope-intercept form.
Use the slope-intercept to graph.
To put the equation in standard form,
you can do this...
Class Work 2.11;
Show All Work
January 16, 2015

January 16, 2015

  • 1.
    Today:  No Warm-Up Review Slope & Other Formulas  Examples & Practice  Class Work 2.11
  • 2.
  • 3.
    Y is thedependent variable. X is the independent variable. The constant rate of change of a line is called the slope of the line. The rise is the difference of the y-values of two points on a line. The run is the difference in the x-values of two points on a line. The slope of a line is the ratio of rise to run for any two points on the line. change in y change in x Rise Run = Slope Sense
  • 4.
    (3, 2) (–1, –2) Thencount horizontally to a second point to find the run. Count vertically from any one point on the line to find the rise. Finding the Slope of a Line slope= = 14 4 The slope of the line is 1. –4 –4slope = = 1 It does not matter which ordered pair you start with. Slope Sense
  • 5.
    Then count horizontallyto a second point to find the run. Count vertically from any one point on the line to find the rise. slope = =2 4 1 2 The slope of the line is - 1 2 –2 –4 slope = = 1 2 (5, 4) (1, 2) Slope Sense
  • 6.
    Slope Sense What isthe equation of this line? The point here, is called the.... y-intercept. We know the slope, so we can plug both into the slope-intercept form of a line and get.... y = 2/3x - 2
  • 7.
  • 8.
    What is theslope of the line? Slope Sense
  • 9.
    Slope Sense Which slope,or grade, is the steepest? Why? 𝟏𝟕 𝟏𝟎𝟎 = 𝒙 𝟓𝟎𝟎 x = 85 𝟐𝟓 𝟓𝟎𝟎 = 𝟓 𝟏𝟎𝟎 ***A line is straight ONLY because the slope is the same throughout the entire line
  • 10.
    Use graph paperand label the axes with the following values: A car rental agency charges $25/day to rent a compact car, and $50/day to rent a sports car. For each car, graph the cost of renting for 1 to 3 days. Plot the points and connect with a continuous line graph. cost days 1 2 3 y2 – y1 x2 – x1 m = Slope measures how y changes, given a change in x (which must come first). In other words, “How will a change in our independent variable affect the dependent variable? change in y change in x Over the same change in x, (3 days) It’s easy to see that the sports car had a greater affect on the ‘y’ (cost)... Than the compact car, over the same change in x. The steeper the line, the greater the change in y. Slope Sense
  • 11.
    Example: The table showsthe total cost of gas per gallon. Use the data to make a graph. Find the slope of the line and explain what it shows. Graph the data. Cost of Gas Gallons Cost 0 0 3 6 6 12 6 9 9 12 60 3 3 x y Gallons Cost of Gas Cost 0 Slope Sense
  • 12.
    Example Continued Find theslope of the line: The slope of the line is 2. This means that for every gallon of gas, you will pay another $2. = y2 – y1 x2 – x1 6 3 = 12 – 6 6 – 3 = 2 Slope Sense
  • 13.
    Find the equationof the line that has a slope of 𝟏 𝟒 and a y- intercept of 2. Graph the line and write the equation in both slope-intercept and standard forms with integers only. The Graph The Equations 1. Slope-intercept form: The instant equation, just add x and y. Fractional form: y = 𝟏 𝟒 x + 2 Integer form form: 4y = x + 8 2. Standard Form: Easily & directly found by doing this: cross-multiply The Other Formulas
  • 14.
    Find the equationof the line that has a slope of 𝟑 and a y- intercept of -1. Graph the line and write the equation in both slope-intercept and standard forms with integers only for the standard form. On Your Own: What if: The only information you have is the slope 𝟑 𝟒 , and a point on the line, (1,2). Use the correct equation & graph the line. Then write the equation standard form with integers only. You begin with the point-slope formula, which becomes the slope-intercept form. Use the slope-intercept to graph. To put the equation in standard form, you can do this...
  • 15.