More Related Content
Similar to Daily livestock report sep 10 2012
Similar to Daily livestock report sep 10 2012 (20)
More from joseleorcasita (20)
Daily livestock report sep 10 2012
- 1. Vol. 10, No. 175 September 10, 2012
USDA will release its latest esti-
mate of U.S. and world agricultural output CORN & SOYBEAN PRE-REPORT ESTIMATES
and usage Wednesday at 7:30 CDT when its September 12, 2012 Crop Production/WASDE Reports
monthly Crop Production and World Agri- Analysts' Estimates, September
cultural Supply and Demand Estimates USDA '12
(WASDE) are released. While the trade will, Units USDA '11 August Low High Average
quite understandably, be looking at USDA’s Corn Area Planted Acres 91.9 96.4
yield estimates, the focus this month is really Area Harvested Acres 84.0 87.4 83.000 87.400 86.173
on harvestedacres. USDA has pegged those
Yield Bu/Acre 147.2 123.4 117.600 124.000 120.595
figures at 87.4 million for corn and 74.5 million
Crop Bil. Bu. 12.358 10.779 9.860 10.780 10.380
for soybeans in the August reports. That figure
for corn is the high of analysts’ pre-report esti- '12 Ending Stocks Bil. Bu. 1.021
mates for this month’s report with the average '13 Ending Stocks Bil. Bu. 0.650
estimate being 86.173 million. That would be Soybeans Area Planted Acres 77.4 76.1
just 89.4% of planted acres, the lowest harvest- Area Harvested Acres 76.6 74.6 73.300 74.745 74.447
ed percentage since 2003-04 when 87.9% of Yield Bu/Acre 41.5 36.1 34.500 36.700 35.792
acres were harvested. It would still be 3.4% Crop Bil. Bu. 3.056 2.692 2.510 2.739 2.658
more than were harvested in 1988, the year of '12 Ending Stocks Bil. Bu. 0.145
the last severe drought in the U.S. Cornbelt. '13 Ending Stocks Bil. Bu. 0.115
This is not to say that there is agree-
ment on what USDA will say on yields. Estimates are still over 7 bush-
US COW AND BULL SLAUGHTER
els per acre apart from low to high. But they are significantly skewed to PRELIMINARY DATA BASED ON DAILY SLAUGHTER ESTIMATES - 7 DAY RUNNING TOTAL
the low side. That is not a surprise given recently published estimates. 000 HEAD
In fact, we were a bit surprised to see the average above 120 bushels 170.0
per acre given all of the estimates in the 110s over the past few weeks. 160.0
A crop of 10.380 billion bushels would mean another 400 million bush-
els would have be cut from usage as we don’t see much way to take 150.0
carryout stocks below the 650 million estimated in August.
The bean side is not quite as dire. Harvested acres and yield 140.0
estimates are expected to drop slightly from USDA’s August figures as
130.0
late-season rains came in time to have some impact on beans in some
areas. The average crop estimates is only 2.3% lower than in August. 120.0
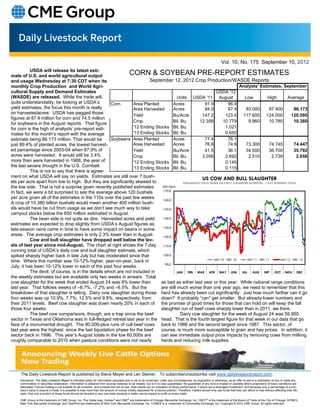
Cow and bull slaughter have dropped well below the lev-
els of last year since mid-August. The chart at right shows the 7-day 110.0
running total of USDA’s daily cow and bull slaughter estimate, which
spiked sharply higher back in late July but has moderated since that 100.0
JAN 10 - DEC 10 JAN 11 - DEC 11 JAN 12 - DEC 12
time. Where this number was 10-12% higher, year-on-year, back in
90.0
July, it has been 10-12% lower in each of the past four weeks.
The devil, of course, is in the details which are not included in JAN FEB MAR APR MAY JUN JUL AUG SEP OCT NOV DEC
the weekly estimates but are available only two weeks in arrears. Total
cow slaughter for the week that ended August 24 was 8% lower than as bad as either last year or this year. While national range conditions
last year. That follows weeks of –8.7%, -7.2% and –6.5%. But the are still much worse than one year ago, we need to remember that this
breakdown of that slaughter is telling. Dairy cow slaughter during those herd has already been cut significantly. Just how much farther can it go
four weeks was up 10.9%, 7.7%, 12.5% and 9.8%, respectively, from down? It probably “can” get smaller. But already-lower numbers and
their 2011 levels. Beef cow slaughter was down nearly 20% in each of the promise of good times for those that can hold on will keep the fall
those four weeks. slaughter run of beef cows sharply lower than in 2011, we think.
The beef cow comparisons, though, are a trap since the beef Dairy cow slaughter for the week of August 24 was 59,950
sector in Texas and Oklahoma was in full-fledged retreat last year in the head. That is the fourth largest figure for that week in our data that go
face of a monumental drought. The 80,000-plus runs of cull beef cows back to 1986 and the second largest since 1987. This sector, of
last year were the highest since the last liquidation phase for the beef course, is much more susceptible to grain and hay prices. In addition, it
sector back in 1996. This year’s August totals in the low 60,000s are can see immediate output price impacts by removing cows from milking
roughly comparable to 2010 when pasture conditions were not nearly herds and reducing milk supplies.
The Daily Livestock Report is published by Steve Meyer and Len Steiner. To subscribe/unsubscribe visit www.dailylivestockreport.com.
Disclaimer: The Daily Livestock Report is intended solely for information purposes and is not to be construed, under any circumstances, by implication or otherwise, as an offer to sell or a solicitation to buy or trade any
commodities or securities whatsoever. Information is obtained from sources believed to be reliable, but is in no way guaranteed. No guarantee of any kind is implied or possible where projections of future conditions are
attempted. Futures trading is not suitable for all investors, and involves the risk of loss. Past results are no indication of future performance. Futures are a leveraged investment, and because only a percentage of a con-
tract’s value is require to trade, it is possible to lose more than the amount of money initially deposited for a futures position. Therefore, traders should only use funds that they can afford to lose without affecting their life-
style. And only a portion of those funds should be devoted to any one trade because a trader cannot expect to profit on every trade.
CME Group is the trademark of CME Group, Inc. The Globe logo, Globex® and CME® are trademarks of Chicago Mercantile Exchange, Inc. CBOT® is the trademark of the Board of Trade of the City of Chicago. NYMEX,
New York Mercantile Exchange, and ClearPort are trademarks of New York Mercantile Exchange. Inc. COMEX is a trademark of Commodity Exchange, Inc. Copyright © 2012 CME Group. All rights reserved.
- 2. Vol. 10, No. 175 September 10, 2012
PRODUCTION AND PRICE SUMMARY Week Ending 9/8/2012
Current Pct. Pct. Pct.
Item Units Week Last Week Change Last Year Change YTD Change
Total Meat & Poultry Prod. Million lbs. 1630.5 1757.0 -7.20% 1633.3 -0.18% 59,753 -1.19%
C FI Slaughter Thou. Head 551 641 -14.04% 581 -5.21% 22,356 -4.17%
A FI Cow Slaughter Thou. Head 125.7 121.5 3.42% 136.7 -8.04% 4,053 -3.79%
T Avg. Live Weight Lbs. 1304 1300 0.31% 1280 1.88% 1,297 1.77%
T Avg. Dressed Weight Lbs. 794 794 0.00% 777 2.19% 787 2.04%
L Beef Production Million Lbs. 436.5 507.7 -14.02% 448 -2.57% 17,556 -2.09%
E Live Fed Steer $/cwt live wt. 121.80 121.49 0.30% 117.46 3.69%
Dressed Steer $/cwt carcass 189.48 188.97 0.27% 186.58 1.55%
& OKC Feeder Steer 600-700 Lbs. #N/A 144.32 #N/A 139.00 #N/A
Beef Cutout 600-750 Choice 190.97 191.05 -0.04% 180.25 5.95%
B Hide/Offal $/cwt live wt. 13.54 13.46 0.59% 13.48 0.45%
E Rib Choice 294.68 292.85 0.62% 259.59 13.52%
E Round Choice 168.83 166.72 1.27% 161.31 4.66%
F Chuck Choice 159.14 158.70 0.28% 148.75 6.98%
Trimmings, 50% Fresh 59.93 58.92 1.71% 97.02 -38.23%
Trimmings, 90% Fresh 215.43 215.22 0.10% 178.83 20.47%
H FI Slaughter Thou. Head 2074 2282 -9.11% 2017 2.81% 74,912 1.78%
O FI Sow Slaughter Thou. Head 60.5 60.7 -0.32% 62.5 -3.15% 1,914 -0.87%
G Avg. Dressed Weight Lbs. 201 201 0.00% 201 0.00% 206 0.43%
S Pork Production Million Lbs. 417 458.2 -8.99% 406.2 2.66% 15,437 2.25%
Iowa-S. Minn. Direct Avg. 68.57 75.45 -9.10% 83.28 -17.70%
& Natl. Base Carcass Price Weighted Avg. 75.77 80.19 -5.50% 85.10 -11.00%
Natl. Net Carcass Price Weighted Avg. 77.96 82.66 -5.70% 87.72 -11.10%
P Pork Cutout 185 Lbs. 78.87 82.73 -4.70% 94.50 -16.50%
O Hams Primal Cutout 60.26 65.06 -7.40% 83.83 -28.10%
R Loins Primal Cutout 86.31 92.25 -6.40% 112.44 -23.20%
K Bellies Primal Cutout 120.25 124.60 -3.50% 107.72 11.60%
C Young Chicken Slaughter* Million Head 156.78 157.80 -0.65% 161.41 -2.87% 5,344 -4.21%
H Avg. Weight Lbs., RTC 4.27 4.31 -1.04% 4.20 1.60% 4.3 -0.02%
I Broiler Production Million Lbs., RTC 669.3 680.7 -1.68% 678.2 -1.32% 23,009 -3.19%
C Eggs Set Million 189.5 192.5 -1.60% 189.3 0.11% 6,873 -3.15%
K Chicks Placed Million Head 160.1 162.5 -1.50% 160.9 -0.52% 5,737 -2.66%
E 12-City Broiler Composite 81.6 84.33 -3.20% 77.97 4.70%
N Georgia Dock Broiler 2.5-3 Lbs. 94.6 94.55 0.10% 86.87 8.90%
Northeast Breast Skinlss/Bonelss 153.11 151.46 1.10% 136.49 12.20%
Northeast Legs 77.66 70.66 9.90% 70.26 10.50%
T Young Turkey Slaughter* Million Head 4.38 4.67 -6.17% 4.42 -0.82% 153.8 -0.29%
U Avg. Weight Lbs. 24.58 23.66 3.92% 22.84 7.63% 24.4 2.10%
R Turkey Production Million Lbs. 107.7 110.4 -2.49% 100.9 6.76% 3,751 1.96%
K Eastern Region Hen 8-16 Lbs. 110.50 107.57 2.70% 106.82 3.40%
F Corn, Omaha $ per Bushel 7.93 8.20 -3.29% 7.14 10.99%
E DDGS, Minnesota $ per ton 285.00 287.50 -0.87% 190.00 50.00%
E Wheat, Kansas City $ per Bushel 8.75 8.59 1.86% 7.78 12.47%
D Soybeans, S. Iowa $ per Bushel 18.15 18.15 0.00% 14.21 27.70%
SB Meal, 48% Central Illinois $ per Ton 579.10 579.10 0.00% 353.20 64.00%
* Chicken & turkey slaughter, production and prices are 1 week earlier than the date at the top of this table. Cow & sow slaughter are for 2 weeks earlier