More Related Content
Similar to Daily livestock report oct 25 2012
Similar to Daily livestock report oct 25 2012 (20)
More from joseleorcasita (20)
Daily livestock report oct 25 2012
- 1. Vol. 10, No. 207 / October 25, 2012
Market Comments 1000 eggs US WEEKLY BROILER EGG SETS, USDA
215,000
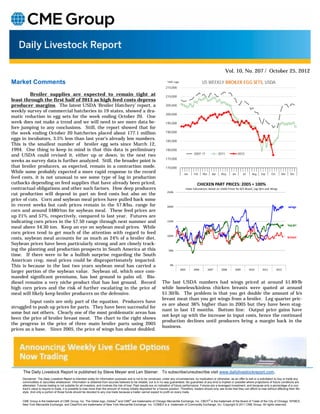
Broiler supplies are expected to remain tight at 210,000
least through the first half of 2013 as high feed costs depress
producer margins. The latest USDA ‘Broiler Hatchery’ report, a 205,000
weekly survey of commercial hatcheries in 19 states, showed a dra-
200,000
matic reduction in egg sets for the week ending October 20. One
week does not make a trend and we will need to see more data be- 195,000
fore jumping to any conclusions. Still, the report showed that for
the week ending October 20 hatcheries placed about 177.1 million 190,000
eggs in incubators, 3.5% less than last year’s already low numbers. 185,000
This is the smallest number of broiler egg sets since March 12,
1994. One thing to keep in mind is that this data is preliminary 180,000
and USDA could revised it, either up or down, in the next two 2007-11 2011 2012
175,000
weeks as survey data is further analyzed. Still, the broader point is
that broiler producers, as expected, remain in a contraction mode. 170,000
While some probably expected a more rapid response to the record Jan Feb Mar Apr May Jun Jul Aug Sep Oct Nov Dec
feed costs, it is not unusual to see some type of lag in production
cutbacks depending on feed supplies that have already been priced, CHICKEN PART PRICES: 2005 = 100%
contractual obligations and other such factors. How deep producers Index Calculations Based on USDA Prices for B/S Breast, Leg Qtrs and Wings
cut production will depend in part on feed costs but also on the 250%
price of cuts. Corn and soybean meal prices have pulled back some
in recent weeks but cash prices remain in the $7.8/bu. range for 200% wings
corn and around $480/ton for soybean meal. These feed prices are
up 21% and 57%, respectively, compared to last year. Futures are
indicating corn prices in the $7.50 range through next summer and 150%
leg qtr
meal above $4.30 ton. Keep an eye on soybean meal prices. While
corn prices tend to get much of the attention with regard to feed
100%
costs, soybean meal accounts for as much as 24% of a broiler diet. breast
Soybean prices have been particularly strong and are closely track-
ing the planting and production prospects in South America at this 50%
time. If there were to be a bullish surprise regarding the South
American crop, meal prices could be disproportionately impacted.
This is because in the last two years soybean meal has carried a 0%
larger portion of the soybean value. Soybean oil, which once com- 2005 2006 2007 2008 2009 2010 2011 2012
manded significant premiums, has lost ground to palm oil. Bio-
diesel remains a very niche product that has lost ground. Record The last USDA numbers had wings priced at around $1.89/lb
high corn prices and the risk of further escalating in the price of while boneless/kinless chicken breasts were quoted at around
meal will likely keep broiler producers on the defensive. $1.30/lb. The problem is that you get double the amount of b/s
breast meat than you get wings from a broiler. Leg quarter pric-
Input costs are only part of the equation. Producers have
es are about 36% higher than in 2005 but they have been stag-
struggled to push up prices for parts. They have been successful for
nant in last 12 months. Bottom line: Output price gains have
some but not others. Clearly one of the most problematic areas has
not kept up with the increase in input costs, hence the continued
been the price of broiler breast meat. The chart to the right shows
production declines until producers bring a margin back in the
the progress in the price of three main broiler parts using 2005
business.
prices as a base. Since 2005, the price of wings has about doubled.
The Daily Livestock Report is published by Steve Meyer and Len Steiner. To subscribe/unsubscribe visit www.dailylivestockreport.com.
Disclaimer: The Daily Livestock Report is intended solely for information purposes and is not to be construed, under any circumstances, by implication or otherwise, as an offer to sell or a solicitation to buy or trade any
commodities or securities whatsoever. Information is obtained from sources believed to be reliable, but is in no way guaranteed. No guarantee of any kind is implied or possible where projections of future conditions are
attempted. Futures trading is not suitable for all investors, and involves the risk of loss. Past results are no indication of future performance. Futures are a leveraged investment, and because only a percentage of a con-
tract’s value is require to trade, it is possible to lose more than the amount of money initially deposited for a futures position. Therefore, traders should only use funds that they can afford to lose without affecting their life-
style. And only a portion of those funds should be devoted to any one trade because a trader cannot expect to profit on every trade.
CME Group is the trademark of CME Group, Inc. The Globe logo, Globex® and CME® are trademarks of Chicago Mercantile Exchange, Inc. CBOT® is the trademark of the Board of Trade of the City of Chicago. NYMEX,
New York Mercantile Exchange, and ClearPort are trademarks of New York Mercantile Exchange. Inc. COMEX is a trademark of Commodity Exchange, Inc. Copyright © 2011 CME Group. All rights reserved.