More Related Content
Similar to Daily livestock report oct 29 2012
Similar to Daily livestock report oct 29 2012 (20)
More from joseleorcasita (20)
Daily livestock report oct 29 2012
- 1. Vol. 10, No. 209 / October 29, 2012
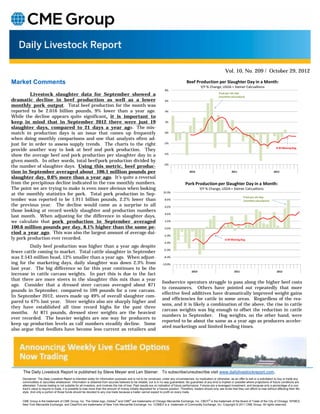
Market Comments Beef Production per Slaughter Day in a Month:
Y/Y % Change, USDA + Steiner Calcualtions
8%
Livestock slaughter data for September showed a Prod per sltr day
(monthly calculation)
dramatic decline in beef production as well as a lower 6%
monthly pork output. Total beef production for the month was
reported to be 2.016 billion pounds, 9% lower than a year ago. 4%
While the decline appears quite significant, it is important to
keep in mind that in September 2012 there were just 19 2%
slaughter days, compared to 21 days a year ago. The mis-
match in production days is an issue that comes up frequently 0%
when doing monthly comparisons and one that analysts often ad-
just for in order to assess supply trends. The charts to the right ‐2%
provide another way to look at beef and pork production. They 6‐M Moving Avg.
show the average beef and pork production per slaughter day in a ‐4%
given month. In other words, total beef/pork production divided by
the number of slaughter days. Using this metric, beef produc- ‐6%
tion in September averaged about 106.1 million pounds per 2010 2011 2012
slaughter day, 0.6% more than a year ago. It’s quite a reversal
from the precipitous decline indicated in the raw monthly numbers. Pork Production per Slaughter Day in a Month:
The point we are trying to make is even more obvious when looking Y/Y % Change, USDA + Steiner Calcualtions
at the monthly statistics for pork. Total pork production in Sep- 10.0%
Prod per sltr day
tember was reported to be 1.911 billion pounds, 2.2% lower than 8.0% (monthly calculation)
the previous year. The decline would come as a surprise to all 6.0%
those looking at record weekly slaughter and production numbers
4.0%
last month. When adjusting for the difference in slaughter days,
we calculate that pork production in September averaged 2.0%
100.6 million pounds per day, 8.1% higher than the same pe- 0.0%
riod a year ago. This was also the largest amount of average dai-
‐2.0%
ly pork production ever recorded. 6‐M Moving Avg.
‐4.0%
Daily beef production was higher than a year ago despite
fewer cattle coming to market. Total cattle slaughter in September ‐6.0%
was 2.543 million head, 12% smaller than a year ago. When adjust- ‐8.0%
ing for the marketing days, daily slaughter was down 2.3% from ‐10.0%
last year. The big difference so far this year continues to be the
2010 2011 2012
increase in cattle carcass weights. In part this is due to the fact
that there are more steers in the slaughter this mix than a year
foodservice operators struggle to pass along the higher beef costs
ago. Consider that a dressed steer carcass averaged about 871
to consumers. Others have pointed out repeatedly that more
pounds in September, compared to 599 pounds for a cow carcass.
effective feed additives have dramatically improved weight gains
In September 2012, steers made up 49% of overall slaughter com-
and efficiencies for cattle in some areas. Regardless of the rea-
pared to 47% last year. Steer weights also are sharply higher and
sons, and it is likely a combination of the above, the rise in cattle
they have established all time record highs for the past three
carcass weights was big enough to offset the reduction in cattle
months. At 871 pounds, dressed steer weights are the heaviest
numbers in September. Hog weights, on the other hand, were
ever recorded. The heavier weights are one way for producers to
reported to be about the same as a year ago as producers acceler-
keep up production levels as calf numbers steadily decline. Some
ated marketings and limited feeding times.
also argue that feedlots have become less current as retailers and
The Daily Livestock Report is published by Steve Meyer and Len Steiner. To subscribe/unsubscribe visit www.dailylivestockreport.com.
Disclaimer: The Daily Livestock Report is intended solely for information purposes and is not to be construed, under any circumstances, by implication or otherwise, as an offer to sell or a solicitation to buy or trade any
commodities or securities whatsoever. Information is obtained from sources believed to be reliable, but is in no way guaranteed. No guarantee of any kind is implied or possible where projections of future conditions are
attempted. Futures trading is not suitable for all investors, and involves the risk of loss. Past results are no indication of future performance. Futures are a leveraged investment, and because only a percentage of a con-
tract’s value is require to trade, it is possible to lose more than the amount of money initially deposited for a futures position. Therefore, traders should only use funds that they can afford to lose without affecting their life-
style. And only a portion of those funds should be devoted to any one trade because a trader cannot expect to profit on every trade.
CME Group is the trademark of CME Group, Inc. The Globe logo, Globex® and CME® are trademarks of Chicago Mercantile Exchange, Inc. CBOT® is the trademark of the Board of Trade of the City of Chicago. NYMEX,
New York Mercantile Exchange, and ClearPort are trademarks of New York Mercantile Exchange. Inc. COMEX is a trademark of Commodity Exchange, Inc. Copyright © 2011 CME Group. All rights reserved.
- 2. Page 2
Vol. 10, No. 209 / October 29, 2012
PRODUCTION & PRICE SUMMARY Week Ending 10/27/2012
Current Pct. Pct. Y/Y %
Item Units Week Last Week Change Last Year Change YTD Change
27-Oct-12 20-Oct-12 29-Oct-11
Total Red Meat & Poultry mil lbs., cwe 1,811 1,784 1.53% 1,793 1.00% 70,561 76.8%
FI Slaughter Thou. Head 641 634 1.10% 672 -4.67% 26,813 -4.2%
C FI Cow Slaughter ** Thou. Head 133 129 2.90% 132 0.72% 4,941 -4.7%
A Avg. Live Weight Lbs. 1326 1330 -0.30% 1294 2.47% 1,301 1.9%
T Avg. Dressed Weight Lbs. 800 800 0.00% 780 2.56% 789 2.1%
T Beef Production Million Lbs. 511.4 505.9 1.09% 522.8 -2.18% 21,110 -2.0%
L Live Fed Steer Price $ per cwt 126.61 126.11 0.40% 120.93 4.70%
E Dressed Fed Steer Price $ per cwt 197.96 196.69 0.65% 192.25 2.97%
OKC Feeder Steer, 600-700 $ per cwt 151.78 150.74 0.69% 146.01 3.95%
& Choice Beef Cutout $ per cwt 198.49 195.65 1.45% 186.98 6.16%
Hide/Offal $ per cwt, live wt 13.07 13.20 -0.98% 12.73 2.67%
B Rib, Choice $ per cwt 298.06 290.90 2.46% 303.98 -1.95%
E Round, Choice $ per cwt 180.34 177.38 1.67% 167.58 7.61%
E Chuck, Choice $ per cwt 172.20 172.06 0.08% 151.88 13.38%
F Trimmings, 50% $ per cwt 64.39 59.39 8.42% 106.14 -39.33%
Trimmings, 90% $ per cwt 203.39 202.62 0.38% 175.30 16.02%
FI Slaughter Thou. Head 2,379 2,388 -0.38% 2,308 3.09% 91,582 2.1%
FI Sow Slaughter ** Thou. Head 62.7 67.3 -6.84% 62.1 0.96% 2,357 -0.1%
H Avg. Dressed Weight Lbs. 203.0 202.0 0.50% 206.0 -1.46% 206 0.2%
O Pork Production Million Lbs. 482.7 483.4 -0.14% 476.2 1.36% 18,820 2.3%
G Iowa-S. Minn. Direct Wtd. Avg. 82.59 82.36 0.28% 88.64 -6.83%
S Natl. Base Carcass Price Wtd. Avg. 83.12 82.33 0.96% 88.69 -6.28%
Natl. Net Carcass Price Wtd. Avg. 85.51 84.75 0.90% 91.25 -6.29%
Pork Cutout 200 Lbs. 86.46 88.24 -2.02% 97.49 -11.31%
Hams $ per cwt 74.13 78.13 -5.12% 87.39 -15.17%
Loins $ per cwt 93.70 97.21 -3.61% 105.40 -11.10%
Bellies $ per cwt 124.08 123.24 0.68% 125.23 -0.92%
C Young Chicken Slaughter * Million Head 155.5 155.0 0.32% 155.2 0.14% 6,413 N/A
H Avg. Weight (Live) Lbs. 5.95 5.86 1.54% 5.81 2.41% 5.74 0.1%
I Chicken Production (RTC) Million Lbs. 698.4 685.6 1.86% 676.5 3.24% 26,349 N/A
C Eggs Set Million 177.1 183.1 -3.30% 183.5 -3.51% 8,164 -2.6%
K Chicks Placed Million Head 154.3 155.9 -1.02% 151.1 2.07% 6,834 -2.1%
E 12-City Broiler Price Composite 84.81 83.43 1.65% 74.93 13.19%
N Georgia Dock Broiler Price 2.5-3 Lbs. 95.3 95.01 0.31% 87.75 8.60%
Northeast Breast, B/S $/cwt 130.34 130.89 -0.42% 119.07 9.47%
Northeast Legs $/cwt 70.86 70.86 0.00% 70.22 0.91%
T Young Turkey Slaughter * Million Head 4.991 4.458 11.96% 5.066 -1.48% 185.529 N/A
U Avg. Live Weight Lbs. 29.68 30.48 -2.62% 29.02 2.27% 30.06 1.0%
R Turkey Production (RTC) Million Lbs. 118.5 108.7 9.02% 117.5 0.79% 4,283 N/A
K Eastern Region Hen Price 8-16 Lbs. 110.07 109.48 0.54% 117.54 -6.36%
G Corn, Omaha $ per Bushel 7.65 7.82 -2.17% 6.49 17.87%
R DDGs, Minnesota $ per Ton 257.50 255.00 0.98% 204.00 26.23%
A Wheat, Kansas City $ per Bushel 8.79 8.78 0.11% 7.18 22.42%
I Soybeans, S. Iowa $ per Bushel 15.74 15.56 1.16% 12.35 27.45%
N Soybn Meal, 48% Decatur $ per Ton 501.40 483.30 3.75% 311.50 60.96%
* Chicken & turkey slaughter & production are 1 week earlier than the date at the top of this sheet.
** Cow and sow slaughter reflect levels from two weeks ago due to reporting lag.