More Related Content
Similar to Daily livestock report sep 17 2012
Similar to Daily livestock report sep 17 2012 (20)
More from joseleorcasita (20)
Daily livestock report sep 17 2012
- 1. Vol. 10, No. 179 / September 17, 2012
Market Comments million
animal units
GRAIN CONSUMING ANIMAL UNITS (GCAU): USDA, ALL ANIMALS
100
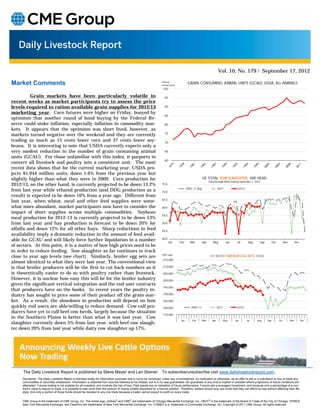
Grain markets have been particularly volatile in 95
recent weeks as market participants try to assess the price
levels required to ration available grain supplies for 2012/13 90
marketing year. Corn futures were higher on Friday, buoyed by
85
optimism that another round of bond buying by the Federal Re-
serve could stoke inflation, especially inflation in commodity mar- 80
kets. It appears that the optimism was short lived, however, as
markets turned negative over the weekend and they are currently 75
trading as much as 15 cents lower corn and 37 cents lower soy- 70
beans. It is interesting to note that USDA currently expects only a
very modest reduction in the number of grain consuming animal 65
units (GCAU). For those unfamiliar with this index, it purports to
60
convert all livestock and poultry into a consistent unit. The most
recent data shows that for the current marketing year, USDA pro-
jects 91.944 million units, down 1.6% from the previous year but
slightly higher than what they were in 2009. Corn production for US TOTAL SOW SLAUGHTER, 000 HEAD
Data through Week Ending September 1, 2012
2012/13, on the other hand, is currently projected to be down 13.2% 75.0
from last year while ethanol production (and DDG production as a 70.0
2007-11 Avg. 2011 2012
result) is expected to be down 10% from a year ago. Different from
last year, when wheat, meal and other feed supplies were some- 65.0
what more abundant, market participants now have to consider the 60.0
impact of short supplies across multiple commodities. Soybean
55.0
meal production for 2012-13 is currently projected to be down 13%
from last year and hay production is forecast to be down 20% for 50.0
alfalfa and down 12% for all other hays. Sharp reductions in feed 45.0
availability imply a dramatic reduction in the amount of feed avail-
able for GCAU and will likely force further liquidation in a number 40.0
Jan Feb Mar Apr May Jun Jul Aug Sep Oct Nov Dec
of sectors. At this point, it is a matter of how high prices need to be
in order to reduce feeding. Sow slaughter so far continues to track
close to year ago levels (see chart). Similarly, broiler egg sets are 1000 eggs
US WEEKLY BROILER EGG SETS, USDA
215,000
almost identical to what they were last year. The conventional view
is that broiler producers will be the first to cut back numbers as it 210,000
is theoretically easier to do so with poultry rather than livestock. 205,000
However, it is unclear how easy this will be for the broiler industry 200,000
given the significant vertical integration and the end user contracts
195,000
that producers have on the books. In recent years the poultry in-
dustry has sought to price some of their product off the grain mar- 190,000
ket. As a result, the slowdown in production will depend on how 185,000
quickly end users are able/willing to reduce demand. Cow-calf pro- 180,000 2007-11 2011 2012
ducers have yet to cull beef cow herds, largely because the situation
175,000
in the Southern Plains is better than what it was last year. Cow
Jan Feb Mar Apr May Jun Jul Aug Sep Oct Nov Dec
slaughter currently down 5% from last year, with beef cow slaugh-
ter down 20% from last year while dairy cow slaughter up 17%.
The Daily Livestock Report is published by Steve Meyer and Len Steiner. To subscribe/unsubscribe visit www.dailylivestockreport.com.
Disclaimer: The Daily Livestock Report is intended solely for information purposes and is not to be construed, under any circumstances, by implication or otherwise, as an offer to sell or a solicitation to buy or trade any
commodities or securities whatsoever. Information is obtained from sources believed to be reliable, but is in no way guaranteed. No guarantee of any kind is implied or possible where projections of future conditions are
attempted. Futures trading is not suitable for all investors, and involves the risk of loss. Past results are no indication of future performance. Futures are a leveraged investment, and because only a percentage of a con-
tract’s value is require to trade, it is possible to lose more than the amount of money initially deposited for a futures position. Therefore, traders should only use funds that they can afford to lose without affecting their life-
style. And only a portion of those funds should be devoted to any one trade because a trader cannot expect to profit on every trade.
CME Group is the trademark of CME Group, Inc. The Globe logo, Globex® and CME® are trademarks of Chicago Mercantile Exchange, Inc. CBOT® is the trademark of the Board of Trade of the City of Chicago. NYMEX,
New York Mercantile Exchange, and ClearPort are trademarks of New York Mercantile Exchange. Inc. COMEX is a trademark of Commodity Exchange, Inc. Copyright © 2011 CME Group. All rights reserved.
- 2. Page 2
Vol. 10, No. 179 / September 17, 2012
PRODUCTION & PRICE SUMMARY Week Ending 9/15/2012
Current Pct. Pct. Y/Y %
Item Units Week Last Week Change Last Year Change YTD Change
15-Sep-12 8-Sep-12 17-Sep-11
Total Red Meat & Poultry mil lbs., cwe 1,698 1,637 3.71% 1,663 2.10% 61,447 11.1%
FI Slaughter Thou. Head 647 551 17.42% 660 -1.90% 23,003 -4.1%
C FI Cow Slaughter ** Thou. Head 129 126 2.38% 136 -5.37% 4,182 -3.8%
A Avg. Live Weight Lbs. 1306 1304 0.15% 1278 2.19% 1,297 1.8%
T Avg. Dressed Weight Lbs. 793 794 -0.13% 773 2.59% 787 2.0%
T Beef Production Million Lbs. 511.9 436.5 17.27% 507.7 0.83% 18,067 -2.0%
L Live Fed Steer Price $ per cwt 125.91 123.31 2.11% 116.95 7.66%
E Dressed Fed Steer Price $ per cwt 195.41 190.85 2.39% 185.75 5.20%
OKC Feeder Steer, 600-700 $ per cwt 148.48 N/A N/A 138.55 7.17%
& Choice Beef Cutout $ per cwt 191.50 190.97 0.28% 184.27 3.92%
Hide/Offal $ per cwt, live wt 13.59 13.54 0.37% 13.49 0.74%
B Rib, Choice $ per cwt 291.11 294.68 -1.21% 266.58 9.20%
E Round, Choice $ per cwt 171.10 168.83 1.34% 167.00 2.46%
E Chuck, Choice $ per cwt 161.10 159.14 1.23% 153.65 4.85%
F Trimmings, 50% $ per cwt 55.42 59.93 -7.53% 96.15 -42.36%
Trimmings, 90% $ per cwt 213.05 215.43 -1.10% 178.66 19.25%
FI Slaughter Thou. Head 2,428 2,062 17.75% 2,291 5.98% 77,324 1.9%
FI Sow Slaughter ** Thou. Head 60.9 60.5 0.62% 59.8 1.85% 1,975 -0.8%
H Avg. Dressed Weight Lbs. 201.0 201.0 0.00% 202.0 -0.50% 206 0.4%
O Pork Production Million Lbs. 488.7 414.6 17.87% 461.6 5.87% 15,923 2.3%
G Iowa-S. Minn. Direct Wtd. Avg. 63.94 67.71 -5.57% 87.29 -26.75%
S Natl. Base Carcass Price Wtd. Avg. 70.74 74.52 -5.07% 85.11 -16.88%
Natl. Net Carcass Price Wtd. Avg. 73.01 76.78 -4.91% 87.88 -16.92%
Pork Cutout 200 Lbs. 78.05 78.87 -1.04% 95.09 -17.92%
Hams $ per cwt 62.91 60.26 4.40% 86.29 -27.09%
Loins $ per cwt 86.07 86.31 -0.28% 112.04 -23.18%
Bellies $ per cwt 113.68 120.25 -5.46% 106.00 7.25%
C Young Chicken Slaughter * Million Head 139.2 156.8 -11.21% 141.5 -1.62% 5,484 -4.1%
H Avg. Weight (Live) Lbs. 5.74 5.73 0.17% 5.73 0.17% 5.72 0.0%
I Chicken Production (RTC) Million Lbs. 603.2 678.2 -11.06% 604.0 -0.13% 23,612 -3.1%
C Eggs Set Million 186.3 189.3 -1.59% 185.2 0.60% 7,058 -3.1%
K Chicks Placed Million Head 159.6 160.0 -0.28% 160.2 -0.38% 5,896 -2.6%
E 12-City Broiler Price Composite 83.16 81.6 1.91% 76 9.42%
N Georgia Dock Broiler Price 2.5-3 Lbs. 94.74 94.6 0.15% 87.17 8.68%
Northeast Breast, B/S $/cwt 148.77 153.11 -2.83% 134.58 10.54%
Northeast Legs $/cwt 74.54 77.66 -4.02% 71.91 3.66%
T Young Turkey Slaughter * Million Head 3.944 4.381 -9.97% 3.913 0.79% 157.792 -0.3%
U Avg. Live Weight Lbs. 29.77 30.74 -3.16% 28.62 4.02% 30.06 0.7%
R Turkey Production (RTC) Million Lbs. 93.9 107.6 -12.74% 89.6 4.85% 3,845 2.0%
K Eastern Region Hen Price 8-16 Lbs. 108.50 110.50 -1.81% 104.00 4.33%
G Corn, Omaha $ per Bushel 7.65 7.93 -3.53% 6.82 12.17%
R DDGs, Minnesota $ per Ton 282.50 285.00 -0.88% 192.50 46.75%
A Wheat, Kansas City $ per Bushel 9.00 8.75 2.86% 7.39 21.79%
I Soybeans, S. Iowa $ per Bushel 17.67 18.15 -2.64% 13.49 30.99%
N Soybn Meal, 48% Decatur $ per Ton 560.05 579.10 -3.29% 335.60 66.88%
* Chicken & turkey slaughter & production are 1 week earlier than the date at the top of this sheet.
** Cow and sow slaughter reflect levels from two weeks ago due to reporting lag.