SlideShare a Scribd company logo
1 of 2
Download to read offline
Vol. 10, No. 161 August 20, 2012
          USDA’ monthly Cattle on Feed report for August,, re-                                                                            USDA Cattle on Feed Report -- August 2012
leased Friday afternoon, showed the number of cattle in feedlots                                                                                                               Thous. Hd.                      2012 as Pct. of 2011
with capacities of 1000 head and more almost precisely as was                                                                                                                                                                    Differ-
expected, on average, by analysts surveyed before the report’s                                                                                                              2011           2012            Actual Estimate*
                                                                                                                                                                                                                                  ence
release. The key numbers from the report appear in the table at right.                                                  On Feed, August 1                                   10,579         10,656          100.7      100.7        0.0
Some highlights are:                                                                                                    Placed on Feed in July                               2,135          1,922           90.0      91.4        -1.4
 Total cattle on feed as of August 1 numbered 10.656 million head,                                                    Fed Cattle Marketed, July                            1,918          1,913           99.7      101.6       -1.9
                                                                                                                        *Dow Jones survey
    0.7% higher than one year ago. That year-on-year increase is
    exactly the same as the average of pre-report estimates. The
    figure is 7.9% larger than was the inventory on August 1, 2010.                                                                                            FEEDLOT PLACEMENTS
                                                                                                                                                            Total U.S., Lots of >1000 Head Capacity
 The “on the nose” feedlot inventory number was reached in a                                                          Thous. Hd.
    slightly roundabout manner with both placements and marketings                                                      2700
    coming in lower than what analysts, again on average, expected
                                                                                                                                             2011
    to see in the August report. 1.922 million cattle were place during                                                 2500
    July, 10% lower than one year ago and 1.4% lower than the num-                                                                           2012

    ber expected. Recall that last year’s July placements were huge                                                     2300                 Avg. '06-'10
    due to the early movement of calves from parched pastures in the
    southwest. There are plenty of parched pastures to go around                                                        2100
    this year but not near as many cattle were placed. It appears that
    the winner in our “feed prices vs. pasture conditions” battle is feed                                               1900
    prices, whose high level very likely kept a good number of cattle
    out of lots— for now. July placements were 8.5% larger than the                                                     1700
    2006-2010 average indicating that, while smaller than last year,
    this year’s movement of cattle to feedlots was still quite large.                                                   1500

 Marketings of 1.913 million head were only fractionally lower than                                                   1300
    last year but were 1.9% lower than analysts expectation of +1.6%                                                                 J        F        M         A        M         J         J        A         S        O         N         D
    for this year’s sales. Both numbers were significantly higher rela-
    tive to one year ago than was steer and heifer slaughter over the
    four weeks that ended July 28. That figure was –3.1%.                                                                                 COF AVERAGE PLACEMENT WEIGHT
 The lack — at least for now — of early placed cattle is apparent in                                                    Lbs.
    the average in-weights of July-placed cattle. Those cattle                                                            740
    weighed an average of 713.7 lbs., just one pound higher than the                                                      730
    2006-2010 average for July but 11.5 pounds heavier than last
    year’s July-placed cattle. The lower August placements and                                                            720
    “normal” placement weights are slightly bullish for January and                                                       710
    February fed cattle prices.
                                                                                                                          700
 The impact of pasture conditions can be most clearly seen in the
    state-by-state placement data. Placements in Oklahoma and                                                             690
    Texas were 21% and 25%, respectively, lower than one year ago.                                                        680               2010
    Those declines account for 243,000 of the 471,000 fewer cattle                                                                          2011
    placed this July. Part of this reduction is due to the simple fact                                                    670               2012

    that there are fewer cattle in those states this year but part of it is                                                                 Avg. '06-'10
                                                                                                                          660
    due to relatively better pasture conditions in much of Texas and a
                                                                                                                          650
    smaller proportion of Oklahoma. Conversely, placements in Ne-
    braska were 5% higher this year while placements in Iowa, Kan-                                                        640
    sas and South Dakota were 95%, 93% and 91% as large as last                                                                       J        F        M        A        M         J        J        A         S        O        N           D
    year — smaller but still above the national year-on-year figure,
    meaning they drove the national number higher.                                                                     record-high feed prices will both discourage any growth in feedlot
          We expect cattle placements to remain lower than one year                                                    numbers. We still expect feedlot inventories to fall below year-ago
ago for the remainder of 2012. T/hat is not saying a lot since place-                                                  levels in September and for beef cutout values and cattle prices to
ments last year were so large but tighter feeder cattle supplies and                                                   move higher this fall. The Choice cutout gained almost $9 last week.


     The Daily Livestock Report is published by Steve Meyer and Len Steiner. To subscribe/unsubscribe visit www.dailylivestockreport.com.
    Disclaimer: The Daily Livestock Report is intended solely for information purposes and is not to be construed, under any circumstances, by implication or otherwise, as an offer to sell or a solicitation to buy or trade any
    commodities or securities whatsoever. Information is obtained from sources believed to be reliable, but is in no way guaranteed. No guarantee of any kind is implied or possible where projections of future conditions are
    attempted. Futures trading is not suitable for all investors, and involves the risk of loss. Past results are no indication of future performance. Futures are a leveraged investment, and because only a percentage of a con-
    tract’s value is require to trade, it is possible to lose more than the amount of money initially deposited for a futures position. Therefore, traders should only use funds that they can afford to lose without affecting their life-
    style. And only a portion of those funds should be devoted to any one trade because a trader cannot expect to profit on every trade.

    CME Group is the trademark of CME Group, Inc. The Globe logo, Globex® and CME® are trademarks of Chicago Mercantile Exchange, Inc. CBOT® is the trademark of the Board of Trade of the City of Chicago. NYMEX,
    New York Mercantile Exchange, and ClearPort are trademarks of New York Mercantile Exchange. Inc. COMEX is a trademark of Commodity Exchange, Inc. Copyright © 2012 CME Group. All rights reserved.
Vol. 10, No. 161 August 20, 2012


PRODUCTION AND PRICE SUMMARY                                                                                               Week Ending                           8/18/2012
                                                                         Current                          Pct.                           Pct.                         Pct.
       Item                                   Units                       Week Last Week               Change Last Year               Change                 YTD   Change
       Total Meat & Poultry Prod.             Million lbs.                  1705.1         1686.3          1.12%          1687.6          1.04%          54,591      -1.49%
  C    FI Slaughter                           Thou. Head                       643            642          0.16%             669         -3.93%         20,514       -4.18%
  A    FI Cow Slaughter                       Thou. Head                     120.9          121.9         -0.88%           129.3         -6.53%          3,688       -3.35%
  T    Avg. Live Weight                       Lbs.                            1303           1300          0.23%            1273          2.36%          1,296        1.75%
  T    Avg. Dressed Weight                    Lbs.                             792            791          0.13%             776          2.06%            786        1.98%
  L    Beef Production                        Million Lbs.                   507.9          506.4          0.30%           517.5         -1.86%         16,093       -2.16%
  E    Live Fed Steer                         $/cwt live wt.                119.95         119.51          0.40%          114.03          5.19%
       Dressed Steer                          $/cwt carcass                 189.01         188.50          0.27%          183.14          3.21%
  &    OKC Feeder Steer                       600-700 Lbs.                  139.36         145.52         -4.23%          141.69         -1.64%
       Beef Cutout                            600-750 Choice                190.23         181.46          4.83%          185.05          2.80%
  B    Hide/Offal                             $/cwt live wt.                 13.24          13.26         -0.15%           13.42         -1.34%
  E    Rib                                    Choice                        279.53         268.41          4.14%          255.07          9.59%
  E    Round                                  Choice                        167.28         161.51          3.57%          169.02         -1.03%
  F    Chuck                                  Choice                        157.09         146.59          7.16%          152.57          2.96%
       Trimmings, 50%                         Fresh                          48.05          43.19         11.25%          105.11        -54.29%
       Trimmings, 90%                         Fresh                         210.61         207.84          1.33%          178.54         17.96%
  H    FI Slaughter                           Thou. Head                      2166           2031          6.65%            2050          5.64%         68,259        1.39%
  O    FI Sow Slaughter                       Thou. Head                      62.9           61.4          2.34%            55.2         13.90%          1,732       -1.20%
  G    Avg. Dressed Weight                    Lbs.                             201            201          0.00%             199          1.01%            207        0.43%
  S    Pork Production                        Million Lbs.                   434.8          408.7          6.39%           407.4          6.73%         14,099        1.86%
       Iowa-S. Minn. Direct                   Avg.                           87.16          90.13         -3.30%          101.74        -14.30%
  &    Natl. Base Carcass Price               Weighted Avg.                  89.42          91.31         -2.10%           99.58        -10.20%
       Natl. Net Carcass Price                Weighted Avg.                  91.92          93.81         -2.00%          102.60        -10.40%
  P    Pork Cutout                            185 Lbs.                       91.82          93.00         -1.30%          107.79        -14.80%
  O    Hams                                   Primal Cutout                  73.85          77.01         -4.10%           86.65        -14.80%
  R    Loins                                  Primal Cutout                  99.01          98.78          0.20%          129.29        -23.40%
  K    Bellies                                Primal Cutout                 149.72         152.73         -2.00%          147.74          1.30%
  C    Young Chicken Slaughter*               Million Head                  156.08         154.91          0.75%          156.03          0.03%          4,872       -4.51%
  H    Avg. Weight                            Lbs., RTC                       4.20           4.28         -1.91%            4.19          0.18%            4.3       -0.14%
  I    Broiler Production                     Million Lbs., RTC              655.8          663.6         -1.17%           654.5          0.21%         20,969       -3.62%
  C    Eggs Set                               Million                        193.4          195.4         -1.00%           194.2         -0.38%          6,299       -3.39%
  K    Chicks Placed                          Million Head                   162.6          163.7         -0.69%           162.3          0.16%          5,252       -2.90%
  E    12-City Broiler                        Composite                      83.17          80.54          3.30%           83.07          0.10%
  N    Georgia Dock Broiler                   2.5-3 Lbs.                     94.06          93.85          0.20%           86.85          8.30%
       Northeast Breast                       Skinlss/Bonelss               139.93         135.46          3.30%          123.52         13.30%
       Northeast Legs                                                        66.14          65.88          0.40%           68.48         -3.40%
  T    Young Turkey Slaughter*                Million Head                    4.58           4.67         -1.91%            4.73         -3.23%          140.3       -0.34%
  U    Avg. Weight                            Lbs.                           23.27          23.03          1.04%           22.86          1.78%           24.4        1.91%
  R    Turkey Production                      Million Lbs.                   106.6          107.6         -0.88%           108.2         -1.51%          3,429        1.73%
  K    Eastern Region Hen                     8-16 Lbs.                     108.18         107.70          0.40%           103.5          4.50%
  F    Corn, Omaha                            $ per Bushel                    8.07           8.21         -1.71%            7.08         13.91%
  E    DDGS, Minnesota                        $ per ton                     294.00         302.50         -2.81%          182.50         61.10%
  E    Wheat, Kansas City                     $ per Bushel                    8.59           8.66         -0.81%            7.89          8.87%
  D    Soybeans, S. Iowa                      $ per Bushel                   17.08          16.96          0.71%           13.73         24.40%
       SB Meal, 48% Central Illinois          $ per Ton                     560.00         561.20         -0.21%          345.00         62.30%
* Chicken & turkey slaughter, production and prices are 1 week earlier than the date at the top of this table. Cow & sow slaughter are for 2 weeks earlier

More Related Content

What's hot

Daily livestock report sep 28 2012
Daily livestock report sep 28 2012Daily livestock report sep 28 2012
Daily livestock report sep 28 2012joseleorcasita
 
Daily livestock report dec 26 2012
Daily livestock report dec 26 2012Daily livestock report dec 26 2012
Daily livestock report dec 26 2012joseleorcasita
 
Daily livestock report nov 5 2012
Daily livestock report nov 5 2012Daily livestock report nov 5 2012
Daily livestock report nov 5 2012joseleorcasita
 
Daily livestock report dec 24 2012
Daily livestock report dec 24 2012Daily livestock report dec 24 2012
Daily livestock report dec 24 2012joseleorcasita
 
Daily livestock report mar 25 2013
Daily livestock report mar 25 2013Daily livestock report mar 25 2013
Daily livestock report mar 25 2013joseleorcasita
 
Daily livestock report dec 18 2012
Daily livestock report dec 18 2012Daily livestock report dec 18 2012
Daily livestock report dec 18 2012joseleorcasita
 
Daily livestock report oct 8 2012
Daily livestock report oct 8 2012Daily livestock report oct 8 2012
Daily livestock report oct 8 2012joseleorcasita
 
Daily livestock report jan 2 2013
Daily livestock report jan 2 2013Daily livestock report jan 2 2013
Daily livestock report jan 2 2013joseleorcasita
 
Daily livestock report oct 29 2012
Daily livestock report oct 29 2012Daily livestock report oct 29 2012
Daily livestock report oct 29 2012joseleorcasita
 
Daily livestock report oct 1 2012
Daily livestock report oct 1 2012Daily livestock report oct 1 2012
Daily livestock report oct 1 2012joseleorcasita
 
House price monitor.12.2011
House price monitor.12.2011House price monitor.12.2011
House price monitor.12.2011REALTORS
 
Daily livestock report july 20 2012
Daily livestock report july 20 2012Daily livestock report july 20 2012
Daily livestock report july 20 2012joseleorcasita
 
Daily livestock report aug 22 2012
Daily livestock report aug 22 2012Daily livestock report aug 22 2012
Daily livestock report aug 22 2012joseleorcasita
 
Daily livestock report oct 16 2012
Daily livestock report oct 16 2012Daily livestock report oct 16 2012
Daily livestock report oct 16 2012joseleorcasita
 

What's hot (16)

Daily livestock report sep 28 2012
Daily livestock report sep 28 2012Daily livestock report sep 28 2012
Daily livestock report sep 28 2012
 
Daily livestock report dec 26 2012
Daily livestock report dec 26 2012Daily livestock report dec 26 2012
Daily livestock report dec 26 2012
 
Daily livestock report nov 5 2012
Daily livestock report nov 5 2012Daily livestock report nov 5 2012
Daily livestock report nov 5 2012
 
Daily livestock report dec 24 2012
Daily livestock report dec 24 2012Daily livestock report dec 24 2012
Daily livestock report dec 24 2012
 
Daily livestock report mar 25 2013
Daily livestock report mar 25 2013Daily livestock report mar 25 2013
Daily livestock report mar 25 2013
 
Daily livestock report dec 18 2012
Daily livestock report dec 18 2012Daily livestock report dec 18 2012
Daily livestock report dec 18 2012
 
Daily livestock report oct 8 2012
Daily livestock report oct 8 2012Daily livestock report oct 8 2012
Daily livestock report oct 8 2012
 
Daily livestock report jan 2 2013
Daily livestock report jan 2 2013Daily livestock report jan 2 2013
Daily livestock report jan 2 2013
 
Daily livestock report oct 29 2012
Daily livestock report oct 29 2012Daily livestock report oct 29 2012
Daily livestock report oct 29 2012
 
Daily livestock report oct 1 2012
Daily livestock report oct 1 2012Daily livestock report oct 1 2012
Daily livestock report oct 1 2012
 
House price monitor.12.2011
House price monitor.12.2011House price monitor.12.2011
House price monitor.12.2011
 
Daily livestock report july 20 2012
Daily livestock report july 20 2012Daily livestock report july 20 2012
Daily livestock report july 20 2012
 
Daily livestock report aug 22 2012
Daily livestock report aug 22 2012Daily livestock report aug 22 2012
Daily livestock report aug 22 2012
 
Daily livestock report oct 16 2012
Daily livestock report oct 16 2012Daily livestock report oct 16 2012
Daily livestock report oct 16 2012
 
Sar stats july2011
Sar stats july2011Sar stats july2011
Sar stats july2011
 
Sarasota Market Stats feb2012
Sarasota Market Stats feb2012Sarasota Market Stats feb2012
Sarasota Market Stats feb2012
 

Viewers also liked

PANORAMA DEL ANTIGUO TESTAMENTO
PANORAMA DEL ANTIGUO TESTAMENTOPANORAMA DEL ANTIGUO TESTAMENTO
PANORAMA DEL ANTIGUO TESTAMENTOOscar Briones
 
Quadro de vagas_14-03-14
Quadro de vagas_14-03-14Quadro de vagas_14-03-14
Quadro de vagas_14-03-14Renata Dorta
 
Testspringeenrum
TestspringeenrumTestspringeenrum
Testspringeenrumgewoonmarik
 
wireless sensor network 2015-2016
wireless sensor network 2015-2016wireless sensor network 2015-2016
wireless sensor network 2015-2016parry prabhu
 
Niu springboard domain name infographic
Niu springboard domain name infographicNiu springboard domain name infographic
Niu springboard domain name infographicLuanne Mayorga
 
Resumo do SFN versão digitada.pdf
Resumo do SFN versão digitada.pdfResumo do SFN versão digitada.pdf
Resumo do SFN versão digitada.pdfJeferson S. J.
 
Lista de cotejo - Johanna Arosemena
Lista de cotejo - Johanna ArosemenaLista de cotejo - Johanna Arosemena
Lista de cotejo - Johanna ArosemenaJohanna Arosemena
 

Viewers also liked (10)

PANORAMA DEL ANTIGUO TESTAMENTO
PANORAMA DEL ANTIGUO TESTAMENTOPANORAMA DEL ANTIGUO TESTAMENTO
PANORAMA DEL ANTIGUO TESTAMENTO
 
Quadro de vagas_14-03-14
Quadro de vagas_14-03-14Quadro de vagas_14-03-14
Quadro de vagas_14-03-14
 
Practica del teclado.
Practica del teclado. Practica del teclado.
Practica del teclado.
 
Testspringeenrum
TestspringeenrumTestspringeenrum
Testspringeenrum
 
Gary richetelli
Gary richetelliGary richetelli
Gary richetelli
 
wireless sensor network 2015-2016
wireless sensor network 2015-2016wireless sensor network 2015-2016
wireless sensor network 2015-2016
 
Niu springboard domain name infographic
Niu springboard domain name infographicNiu springboard domain name infographic
Niu springboard domain name infographic
 
Resumo do SFN versão digitada.pdf
Resumo do SFN versão digitada.pdfResumo do SFN versão digitada.pdf
Resumo do SFN versão digitada.pdf
 
ensayo
ensayoensayo
ensayo
 
Lista de cotejo - Johanna Arosemena
Lista de cotejo - Johanna ArosemenaLista de cotejo - Johanna Arosemena
Lista de cotejo - Johanna Arosemena
 

Similar to Daily livestock report aug 20 2012

Daily livestock report july 23 2012
Daily livestock report july 23 2012Daily livestock report july 23 2012
Daily livestock report july 23 2012joseleorcasita
 
Daily livestock report nov 09 2012
Daily livestock report nov 09 2012Daily livestock report nov 09 2012
Daily livestock report nov 09 2012joseleorcasita
 
Daily livestock report feb 25 2013
Daily livestock report feb 25 2013Daily livestock report feb 25 2013
Daily livestock report feb 25 2013joseleorcasita
 
Daily livestock report sep 10 2012
Daily livestock report sep 10 2012Daily livestock report sep 10 2012
Daily livestock report sep 10 2012joseleorcasita
 
Daily livestock report nov 15 2012
Daily livestock report nov 15 2012Daily livestock report nov 15 2012
Daily livestock report nov 15 2012joseleorcasita
 
Daily livestock report aug 24 2012
Daily livestock report aug 24 2012Daily livestock report aug 24 2012
Daily livestock report aug 24 2012joseleorcasita
 
Daily livestock report sep 4 2012
Daily livestock report sep 4 2012Daily livestock report sep 4 2012
Daily livestock report sep 4 2012joseleorcasita
 
Daily livestock report july 18 2012
Daily livestock report july 18 2012Daily livestock report july 18 2012
Daily livestock report july 18 2012joseleorcasita
 
Daily livestock report mar 28 2013
Daily livestock report mar 28 2013Daily livestock report mar 28 2013
Daily livestock report mar 28 2013joseleorcasita
 
Daily livestock report dec 4 2012
Daily livestock report dec 4 2012Daily livestock report dec 4 2012
Daily livestock report dec 4 2012joseleorcasita
 
Daily livestock report aug 27 2012
Daily livestock report aug 27 2012Daily livestock report aug 27 2012
Daily livestock report aug 27 2012joseleorcasita
 
Daily livestock report mar 21 2013
Daily livestock report mar 21 2013Daily livestock report mar 21 2013
Daily livestock report mar 21 2013joseleorcasita
 
Daily livestock report nov 19 2012
Daily livestock report nov 19 2012Daily livestock report nov 19 2012
Daily livestock report nov 19 2012joseleorcasita
 
Daily livestock report apr 01 2013
Daily livestock report apr 01 2013Daily livestock report apr 01 2013
Daily livestock report apr 01 2013joseleorcasita
 
Daily livestock report apr 17 2013
Daily livestock report apr 17 2013Daily livestock report apr 17 2013
Daily livestock report apr 17 2013joseleorcasita
 
Daily livestock report oct 2 2012
Daily livestock report oct 2 2012Daily livestock report oct 2 2012
Daily livestock report oct 2 2012joseleorcasita
 
Daily Livestock Report July 24 2012
Daily Livestock Report July 24 2012Daily Livestock Report July 24 2012
Daily Livestock Report July 24 2012joseleorcasita
 
Daily livestock report aug 23 2012
Daily livestock report aug 23 2012Daily livestock report aug 23 2012
Daily livestock report aug 23 2012joseleorcasita
 

Similar to Daily livestock report aug 20 2012 (20)

Daily livestock report july 23 2012
Daily livestock report july 23 2012Daily livestock report july 23 2012
Daily livestock report july 23 2012
 
Daily livestock report nov 09 2012
Daily livestock report nov 09 2012Daily livestock report nov 09 2012
Daily livestock report nov 09 2012
 
Daily livestock report feb 25 2013
Daily livestock report feb 25 2013Daily livestock report feb 25 2013
Daily livestock report feb 25 2013
 
Daily livestock report sep 10 2012
Daily livestock report sep 10 2012Daily livestock report sep 10 2012
Daily livestock report sep 10 2012
 
Daily livestock report nov 15 2012
Daily livestock report nov 15 2012Daily livestock report nov 15 2012
Daily livestock report nov 15 2012
 
Daily livestock report aug 24 2012
Daily livestock report aug 24 2012Daily livestock report aug 24 2012
Daily livestock report aug 24 2012
 
Daily livestock report sep 4 2012
Daily livestock report sep 4 2012Daily livestock report sep 4 2012
Daily livestock report sep 4 2012
 
Daily livestock report july 18 2012
Daily livestock report july 18 2012Daily livestock report july 18 2012
Daily livestock report july 18 2012
 
Daily livestock report mar 28 2013
Daily livestock report mar 28 2013Daily livestock report mar 28 2013
Daily livestock report mar 28 2013
 
Daily livestock report dec 4 2012
Daily livestock report dec 4 2012Daily livestock report dec 4 2012
Daily livestock report dec 4 2012
 
Daily livestock report aug 27 2012
Daily livestock report aug 27 2012Daily livestock report aug 27 2012
Daily livestock report aug 27 2012
 
Daily livestock report mar 21 2013
Daily livestock report mar 21 2013Daily livestock report mar 21 2013
Daily livestock report mar 21 2013
 
Daily livestock report nov 19 2012
Daily livestock report nov 19 2012Daily livestock report nov 19 2012
Daily livestock report nov 19 2012
 
Ldp m december 2012
Ldp m december 2012Ldp m december 2012
Ldp m december 2012
 
Daily livestock report apr 01 2013
Daily livestock report apr 01 2013Daily livestock report apr 01 2013
Daily livestock report apr 01 2013
 
Daily livestock report apr 17 2013
Daily livestock report apr 17 2013Daily livestock report apr 17 2013
Daily livestock report apr 17 2013
 
Daily livestock report oct 2 2012
Daily livestock report oct 2 2012Daily livestock report oct 2 2012
Daily livestock report oct 2 2012
 
Ldp m august 2012
Ldp m august 2012Ldp m august 2012
Ldp m august 2012
 
Daily Livestock Report July 24 2012
Daily Livestock Report July 24 2012Daily Livestock Report July 24 2012
Daily Livestock Report July 24 2012
 
Daily livestock report aug 23 2012
Daily livestock report aug 23 2012Daily livestock report aug 23 2012
Daily livestock report aug 23 2012
 

More from joseleorcasita

Inac boletin semanal 24082013
Inac boletin semanal 24082013Inac boletin semanal 24082013
Inac boletin semanal 24082013joseleorcasita
 
Bcr boletin informativo 23082013
Bcr boletin informativo 23082013Bcr boletin informativo 23082013
Bcr boletin informativo 23082013joseleorcasita
 
Bcr informativo semanal 19042013
Bcr informativo semanal 19042013Bcr informativo semanal 19042013
Bcr informativo semanal 19042013joseleorcasita
 
Inac boletin semanal 13042013
Inac boletin semanal 13042013Inac boletin semanal 13042013
Inac boletin semanal 13042013joseleorcasita
 
Daily livestock report apr 19 2013
Daily livestock report apr 19 2013Daily livestock report apr 19 2013
Daily livestock report apr 19 2013joseleorcasita
 
Daily livestock report apr 18 2013
Daily livestock report apr 18 2013Daily livestock report apr 18 2013
Daily livestock report apr 18 2013joseleorcasita
 
Daily livestock report apr 16 2013
Daily livestock report apr 16 2013Daily livestock report apr 16 2013
Daily livestock report apr 16 2013joseleorcasita
 
Daily livestock report apr 15 2013
Daily livestock report apr 15 2013Daily livestock report apr 15 2013
Daily livestock report apr 15 2013joseleorcasita
 
Usda report april 2013
Usda report april 2013Usda report april 2013
Usda report april 2013joseleorcasita
 
Daily livestock report apr 12 2013
Daily livestock report apr 12 2013Daily livestock report apr 12 2013
Daily livestock report apr 12 2013joseleorcasita
 
Daily livestock report apr 11 2013
Daily livestock report apr 11 2013Daily livestock report apr 11 2013
Daily livestock report apr 11 2013joseleorcasita
 
Daily livestock report apr 10 2013
Daily livestock report apr 10 2013Daily livestock report apr 10 2013
Daily livestock report apr 10 2013joseleorcasita
 
Daily livestock report apr 09 2013
Daily livestock report apr 09 2013Daily livestock report apr 09 2013
Daily livestock report apr 09 2013joseleorcasita
 

More from joseleorcasita (20)

Bcr boletin 06092013
Bcr boletin 06092013Bcr boletin 06092013
Bcr boletin 06092013
 
Inac boletin 31082013
Inac boletin 31082013Inac boletin 31082013
Inac boletin 31082013
 
Boletim do leite 221
Boletim do leite 221Boletim do leite 221
Boletim do leite 221
 
Boletim do leite 220
Boletim do leite 220Boletim do leite 220
Boletim do leite 220
 
Boletim do leite 219
Boletim do leite 219Boletim do leite 219
Boletim do leite 219
 
Boletim do leite 218
Boletim do leite 218Boletim do leite 218
Boletim do leite 218
 
Boletim do leite 217
Boletim do leite 217Boletim do leite 217
Boletim do leite 217
 
Inac boletin semanal 24082013
Inac boletin semanal 24082013Inac boletin semanal 24082013
Inac boletin semanal 24082013
 
Bcr boletin informativo 23082013
Bcr boletin informativo 23082013Bcr boletin informativo 23082013
Bcr boletin informativo 23082013
 
Bcr informativo semanal 19042013
Bcr informativo semanal 19042013Bcr informativo semanal 19042013
Bcr informativo semanal 19042013
 
Inac boletin semanal 13042013
Inac boletin semanal 13042013Inac boletin semanal 13042013
Inac boletin semanal 13042013
 
Daily livestock report apr 19 2013
Daily livestock report apr 19 2013Daily livestock report apr 19 2013
Daily livestock report apr 19 2013
 
Daily livestock report apr 18 2013
Daily livestock report apr 18 2013Daily livestock report apr 18 2013
Daily livestock report apr 18 2013
 
Daily livestock report apr 16 2013
Daily livestock report apr 16 2013Daily livestock report apr 16 2013
Daily livestock report apr 16 2013
 
Daily livestock report apr 15 2013
Daily livestock report apr 15 2013Daily livestock report apr 15 2013
Daily livestock report apr 15 2013
 
Usda report april 2013
Usda report april 2013Usda report april 2013
Usda report april 2013
 
Daily livestock report apr 12 2013
Daily livestock report apr 12 2013Daily livestock report apr 12 2013
Daily livestock report apr 12 2013
 
Daily livestock report apr 11 2013
Daily livestock report apr 11 2013Daily livestock report apr 11 2013
Daily livestock report apr 11 2013
 
Daily livestock report apr 10 2013
Daily livestock report apr 10 2013Daily livestock report apr 10 2013
Daily livestock report apr 10 2013
 
Daily livestock report apr 09 2013
Daily livestock report apr 09 2013Daily livestock report apr 09 2013
Daily livestock report apr 09 2013
 

Daily livestock report aug 20 2012

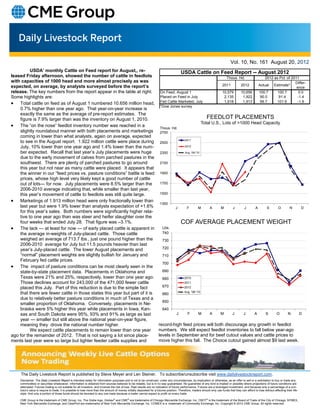
  • 1. Vol. 10, No. 161 August 20, 2012 USDA’ monthly Cattle on Feed report for August,, re- USDA Cattle on Feed Report -- August 2012 leased Friday afternoon, showed the number of cattle in feedlots Thous. Hd. 2012 as Pct. of 2011 with capacities of 1000 head and more almost precisely as was Differ- expected, on average, by analysts surveyed before the report’s 2011 2012 Actual Estimate* ence release. The key numbers from the report appear in the table at right. On Feed, August 1 10,579 10,656 100.7 100.7 0.0 Some highlights are: Placed on Feed in July 2,135 1,922 90.0 91.4 -1.4  Total cattle on feed as of August 1 numbered 10.656 million head, Fed Cattle Marketed, July 1,918 1,913 99.7 101.6 -1.9 *Dow Jones survey 0.7% higher than one year ago. That year-on-year increase is exactly the same as the average of pre-report estimates. The figure is 7.9% larger than was the inventory on August 1, 2010. FEEDLOT PLACEMENTS Total U.S., Lots of >1000 Head Capacity  The “on the nose” feedlot inventory number was reached in a Thous. Hd. slightly roundabout manner with both placements and marketings 2700 coming in lower than what analysts, again on average, expected 2011 to see in the August report. 1.922 million cattle were place during 2500 July, 10% lower than one year ago and 1.4% lower than the num- 2012 ber expected. Recall that last year’s July placements were huge 2300 Avg. '06-'10 due to the early movement of calves from parched pastures in the southwest. There are plenty of parched pastures to go around 2100 this year but not near as many cattle were placed. It appears that the winner in our “feed prices vs. pasture conditions” battle is feed 1900 prices, whose high level very likely kept a good number of cattle out of lots— for now. July placements were 8.5% larger than the 1700 2006-2010 average indicating that, while smaller than last year, this year’s movement of cattle to feedlots was still quite large. 1500  Marketings of 1.913 million head were only fractionally lower than 1300 last year but were 1.9% lower than analysts expectation of +1.6% J F M A M J J A S O N D for this year’s sales. Both numbers were significantly higher rela- tive to one year ago than was steer and heifer slaughter over the four weeks that ended July 28. That figure was –3.1%. COF AVERAGE PLACEMENT WEIGHT  The lack — at least for now — of early placed cattle is apparent in Lbs. the average in-weights of July-placed cattle. Those cattle 740 weighed an average of 713.7 lbs., just one pound higher than the 730 2006-2010 average for July but 11.5 pounds heavier than last year’s July-placed cattle. The lower August placements and 720 “normal” placement weights are slightly bullish for January and 710 February fed cattle prices. 700  The impact of pasture conditions can be most clearly seen in the state-by-state placement data. Placements in Oklahoma and 690 Texas were 21% and 25%, respectively, lower than one year ago. 680 2010 Those declines account for 243,000 of the 471,000 fewer cattle 2011 placed this July. Part of this reduction is due to the simple fact 670 2012 that there are fewer cattle in those states this year but part of it is Avg. '06-'10 660 due to relatively better pasture conditions in much of Texas and a 650 smaller proportion of Oklahoma. Conversely, placements in Ne- braska were 5% higher this year while placements in Iowa, Kan- 640 sas and South Dakota were 95%, 93% and 91% as large as last J F M A M J J A S O N D year — smaller but still above the national year-on-year figure, meaning they drove the national number higher. record-high feed prices will both discourage any growth in feedlot We expect cattle placements to remain lower than one year numbers. We still expect feedlot inventories to fall below year-ago ago for the remainder of 2012. T/hat is not saying a lot since place- levels in September and for beef cutout values and cattle prices to ments last year were so large but tighter feeder cattle supplies and move higher this fall. The Choice cutout gained almost $9 last week. The Daily Livestock Report is published by Steve Meyer and Len Steiner. To subscribe/unsubscribe visit www.dailylivestockreport.com. Disclaimer: The Daily Livestock Report is intended solely for information purposes and is not to be construed, under any circumstances, by implication or otherwise, as an offer to sell or a solicitation to buy or trade any commodities or securities whatsoever. Information is obtained from sources believed to be reliable, but is in no way guaranteed. No guarantee of any kind is implied or possible where projections of future conditions are attempted. Futures trading is not suitable for all investors, and involves the risk of loss. Past results are no indication of future performance. Futures are a leveraged investment, and because only a percentage of a con- tract’s value is require to trade, it is possible to lose more than the amount of money initially deposited for a futures position. Therefore, traders should only use funds that they can afford to lose without affecting their life- style. And only a portion of those funds should be devoted to any one trade because a trader cannot expect to profit on every trade. CME Group is the trademark of CME Group, Inc. The Globe logo, Globex® and CME® are trademarks of Chicago Mercantile Exchange, Inc. CBOT® is the trademark of the Board of Trade of the City of Chicago. NYMEX, New York Mercantile Exchange, and ClearPort are trademarks of New York Mercantile Exchange. Inc. COMEX is a trademark of Commodity Exchange, Inc. Copyright © 2012 CME Group. All rights reserved.
  • 2. Vol. 10, No. 161 August 20, 2012 PRODUCTION AND PRICE SUMMARY Week Ending 8/18/2012 Current Pct. Pct. Pct. Item Units Week Last Week Change Last Year Change YTD Change Total Meat & Poultry Prod. Million lbs. 1705.1 1686.3 1.12% 1687.6 1.04% 54,591 -1.49% C FI Slaughter Thou. Head 643 642 0.16% 669 -3.93% 20,514 -4.18% A FI Cow Slaughter Thou. Head 120.9 121.9 -0.88% 129.3 -6.53% 3,688 -3.35% T Avg. Live Weight Lbs. 1303 1300 0.23% 1273 2.36% 1,296 1.75% T Avg. Dressed Weight Lbs. 792 791 0.13% 776 2.06% 786 1.98% L Beef Production Million Lbs. 507.9 506.4 0.30% 517.5 -1.86% 16,093 -2.16% E Live Fed Steer $/cwt live wt. 119.95 119.51 0.40% 114.03 5.19% Dressed Steer $/cwt carcass 189.01 188.50 0.27% 183.14 3.21% & OKC Feeder Steer 600-700 Lbs. 139.36 145.52 -4.23% 141.69 -1.64% Beef Cutout 600-750 Choice 190.23 181.46 4.83% 185.05 2.80% B Hide/Offal $/cwt live wt. 13.24 13.26 -0.15% 13.42 -1.34% E Rib Choice 279.53 268.41 4.14% 255.07 9.59% E Round Choice 167.28 161.51 3.57% 169.02 -1.03% F Chuck Choice 157.09 146.59 7.16% 152.57 2.96% Trimmings, 50% Fresh 48.05 43.19 11.25% 105.11 -54.29% Trimmings, 90% Fresh 210.61 207.84 1.33% 178.54 17.96% H FI Slaughter Thou. Head 2166 2031 6.65% 2050 5.64% 68,259 1.39% O FI Sow Slaughter Thou. Head 62.9 61.4 2.34% 55.2 13.90% 1,732 -1.20% G Avg. Dressed Weight Lbs. 201 201 0.00% 199 1.01% 207 0.43% S Pork Production Million Lbs. 434.8 408.7 6.39% 407.4 6.73% 14,099 1.86% Iowa-S. Minn. Direct Avg. 87.16 90.13 -3.30% 101.74 -14.30% & Natl. Base Carcass Price Weighted Avg. 89.42 91.31 -2.10% 99.58 -10.20% Natl. Net Carcass Price Weighted Avg. 91.92 93.81 -2.00% 102.60 -10.40% P Pork Cutout 185 Lbs. 91.82 93.00 -1.30% 107.79 -14.80% O Hams Primal Cutout 73.85 77.01 -4.10% 86.65 -14.80% R Loins Primal Cutout 99.01 98.78 0.20% 129.29 -23.40% K Bellies Primal Cutout 149.72 152.73 -2.00% 147.74 1.30% C Young Chicken Slaughter* Million Head 156.08 154.91 0.75% 156.03 0.03% 4,872 -4.51% H Avg. Weight Lbs., RTC 4.20 4.28 -1.91% 4.19 0.18% 4.3 -0.14% I Broiler Production Million Lbs., RTC 655.8 663.6 -1.17% 654.5 0.21% 20,969 -3.62% C Eggs Set Million 193.4 195.4 -1.00% 194.2 -0.38% 6,299 -3.39% K Chicks Placed Million Head 162.6 163.7 -0.69% 162.3 0.16% 5,252 -2.90% E 12-City Broiler Composite 83.17 80.54 3.30% 83.07 0.10% N Georgia Dock Broiler 2.5-3 Lbs. 94.06 93.85 0.20% 86.85 8.30% Northeast Breast Skinlss/Bonelss 139.93 135.46 3.30% 123.52 13.30% Northeast Legs 66.14 65.88 0.40% 68.48 -3.40% T Young Turkey Slaughter* Million Head 4.58 4.67 -1.91% 4.73 -3.23% 140.3 -0.34% U Avg. Weight Lbs. 23.27 23.03 1.04% 22.86 1.78% 24.4 1.91% R Turkey Production Million Lbs. 106.6 107.6 -0.88% 108.2 -1.51% 3,429 1.73% K Eastern Region Hen 8-16 Lbs. 108.18 107.70 0.40% 103.5 4.50% F Corn, Omaha $ per Bushel 8.07 8.21 -1.71% 7.08 13.91% E DDGS, Minnesota $ per ton 294.00 302.50 -2.81% 182.50 61.10% E Wheat, Kansas City $ per Bushel 8.59 8.66 -0.81% 7.89 8.87% D Soybeans, S. Iowa $ per Bushel 17.08 16.96 0.71% 13.73 24.40% SB Meal, 48% Central Illinois $ per Ton 560.00 561.20 -0.21% 345.00 62.30% * Chicken & turkey slaughter, production and prices are 1 week earlier than the date at the top of this table. Cow & sow slaughter are for 2 weeks earlier