More Related Content
Similar to Daily livestock report apr 18 2013
Similar to Daily livestock report apr 18 2013 (20)
More from joseleorcasita (20)
Daily livestock report apr 18 2013
- 1. Sponsored by
Vol. 11, No. 73 / April 18, 2013
We were recently challenged after a presentation by an ber that financial failure is the mechanism that commodity markets use
attendee who said “If high feed prices are so bad, why was pork to force reductions in output. Some firms may reduce output without
production record high in the fourth quarter of 2012?” That is a going bankrupt but it is usually exits — in this case by a major player—
legitimate question since a) it is based on fact and b) it correctly points that cause the most significant supply reductions.
out that warnings of dire reductions in meat protein supplies — including The observant reader would say “Yes, but pork has recovered
ours! — have not proven accurate. to it’s pre-2008 trend line,” and, on its face, that observation is true. But
But the question begs for context. What is the proper yard- here again, one must consider context. In 2007, the pork industry was
stick to measure the impact feed costs increases have had on meat and the beneficiary of a major technological development in the form of vac-
poultry production? We think the answer lies in comparing trends, not cines to control circorvirus, a pathogen that had been found to be sort of
comparing snapshot production levels such as quarterly pork output. a gateway for many other swine health problems. The products had a
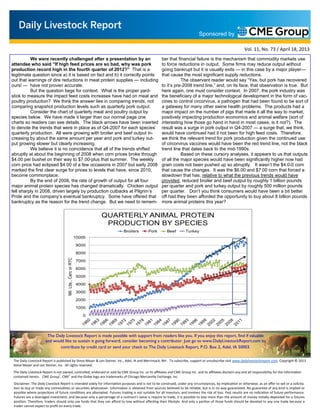
Consider the chart of quarterly meat and poultry output by major impact on the number of pigs that made it all the way to market,
species below. We have made it larger than our normal page one positively impacting production economics and animal welfare (sort of
charts so readers can see details. The black arrows have been inserted interesting how those go hand in hand in most cases, is it not?). The
to denote the trends that were in place as of Q4-2007 for each species’ result was a surge in pork output in Q4-2007 — a surge that, we think,
quarterly production. All were growing with broiler and beef output in- would have continued had it not been for high feed costs. Therefore,
creasing by about the same amount per year and pork and turkey out- we think the relevant trend for pork production given the continued use
put growing slower but clearly increasing. of circorvirus vaccines would have been the red trend line, not the black
We believe it is no coincidence that all of the trends shifted trend line that dates back to the mid-1990s.
abruptly at about the beginning of 2008 when corn prices broke through Based on these cursory analyses, it appears to us that outputs
$4.00 per bushel on their way to $7.00-plus that summer. The weekly of all the major species would have been significantly higher now had
corn price had eclipsed $4.00 of a few occasions in 2007 but early 2008 grain costs not been pushed up so abruptly. It wasn’t the $4.0-0 corn
marked the first clear surge for prices to levels that have, since 2010, that cause the changes. It was the $6.00 and $7.00 corn that forced a
become commonplace. slowdown that has, relative to what the previous trends would have
By the end of 2008, the rate of growth of output for all four provided, reduced broiler and beef output by roughly 1 billion pounds
major animal protein species has changed dramatically. Chicken output per quarter and pork and turkey output by roughly 500 million pounds
fell sharply in 2008, driven largely by production cutbacks at Pilgrim’s per quarter. Don’t you think consumers would have been a bit better
Pride and the company’s eventual bankruptcy. Some have offered that off had they been afforded the opportunity to buy about 8 billion pounds
bankruptcy as the reason for the trend change. But we need to remem- more animal proteins this year?
QUARTERLY ANIMAL PROTEIN
PRODUCTION BY SPECIES
Broilers Pork Beef Turkey
10000
9000
8000
Mil. Lbs., Carc or RTC
7000
6000
5000
4000
3000
2000
1000
0
The Daily Livestock Report is made possible with support from readers like you. If you enjoy this report, find if valuable
and would like to sustain it going forward, consider becoming a contributor. Just go to www.DailyLivestockReport.com to
contribute by credit card or send your check to The Daily Livestock Report, P.O. Box 2, Adel, IA 50003.
The Daily Livestock Report is published by Steve Meyer & Len Steiner, Inc., Adel, IA and Merrimack, NH. To subscribe, support or unsubscribe visit www.dailylivestockreport.com. Copyright © 2013
Steve Meyer and Len Steiner, Inc. All rights reserved.
The Daily Livestock Report is not owned, controlled, endorsed or sold by CME Group Inc. or its affiliates and CME Group Inc. and its affiliates disclaim any and all responsibility for the informa on
contained herein. CME Group®, CME® and the Globe logo are trademarks of Chicago Mercan le Exchange, Inc.
Disclaimer: The Daily Livestock Report is intended solely for informa on purposes and is not to be construed, under any circumstances, by implica on or otherwise, as an offer to sell or a solicita‐
on to buy or trade any commodi es or securi es whatsoever. Informa on is obtained from sources believed to be reliable, but is in no way guaranteed. No guarantee of any kind is implied or
possible where projec ons of future condi ons are a empted. Futures trading is not suitable for all investors, and involves the risk of loss. Past results are no indica on of future performance.
Futures are a leveraged investment, and because only a percentage of a contract’s value is require to trade, it is possible to lose more than the amount of money ini ally deposited for a futures
posi on. Therefore, traders should only use funds that they can afford to lose without affec ng their lifestyle. And only a por on of those funds should be devoted to any one trade because a
trader cannot expect to profit on every trade.