More Related Content
Similar to Daily livestock report july 18 2012
Similar to Daily livestock report july 18 2012 (20)
More from joseleorcasita (20)
Daily livestock report july 18 2012
- 1. Vol. 10, No. 138 July 18, 2012
B USDA’s monthly Cattle On Feed report for July will be Pre-Report Estimates -- USDA Cattle On Feed
released Friday afternoon. The report provides a snapshot of the
July 20, 2012
July 1 inventory and June in– and out-movements of cattle for
feedyards with one-time capacities of 1000 head an more. Ana- Average of
Range of Estimates
lysts expect these number to continue higher than one year ago — Estimates
just as they have done for 24 of the past 25 months.. One item of (Percent of year ago)
note is the relatively large spread between the low and high esti- On Feed, July1 100.0-103.8 102.5
mates for June placements. This disagreement, we believe, is due Placed in June 92.6-104.1 98.7
to differing views of the impact of dry pasture conditions and higher Marketed in June 92.0-101.0 94.0
feed costs. Readers should note that the number of feedyards that, Source: DowJones
based on one-time capacity, qualify for the survey has increased
over the past few years. USDA estimates that this larger number of SHARE OF BEEF COWS BY PASTURE
survey respondents accounts for roughly 2% of the total inventory. RATINGS
This is a major reason that feedyard inventories have been higher, Poor/Very Poor States Good/Excellent States
year-on-year, while year-on-year steer and heifer slaughter has 80%
been lower over the past year.
USDA will also release on Friday its semi-annual esti- 70%
mate of total cattle numbers in the Cattle report. This report will 60%
provide the government’s first estimate of the 2012 calf crop which,
50%
given the sharp decline in beef cow numbers last year will almost
surely be significantly lower than that of 2011. In addition, the re- 40%
port will provide figures for the numbers of beef and dairy cows on
30%
farms as of July 1 as well as the numbers of younger cattle being
held for feeding and breeding. 20%
One confounding factor in these numbers this year
10%
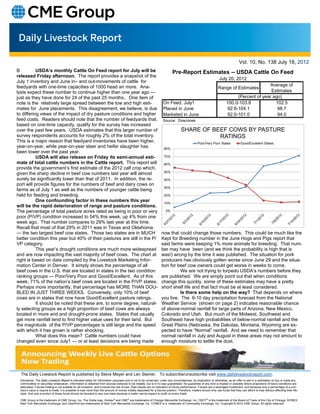
will be the rapid deterioration of range and pasture conditions.
The percentage of total pasture acres rated as being in poor or very 0%
poor (P/VP) condition increased to 54% this week, up 4% from one
week ago. That number compares to 29% last year at this time.
Recall that most of that 29% in 2011 was in Texas and Oklahoma
— the two largest beef cow states. Those two states are in MUCH now that could change those numbers. This could be much like the
better condition this year but 40% of their pastures are still in the P/ Kept for Breeding number in the June Hogs and Pigs report that
VP category. said farms were keeping 1% more animals for breeding. That num-
This year’s drought conditions are much more widespread ber may have been (and we think the probability is high that is
and are now impacting the vast majority of beef cows. The chart at was!) wrong by the time it was published. The situation for pork
right is based on data compiled by the Livestock Marketing Infor- producers has obviously gotten worse since June 29 and the situa-
mation Center in Denver. It simply shows the percentage of all tion for beef cow owners could get worse in weeks to come.
beef cows in the U.S. that are located in states in the two condition We are not trying to torpedo USDA’s numbers before they
ranking groups — Poor/Very Poor and Good/Excellent. As of this are published. We are simply point out that when conditions
week, 71% of the nation’s beef cows are located in the P/VP states. change this quickly, some of these estimates may have a pretty
Perhaps more importantly, that percentage has MORE THAN DOU- short shelf life and that fact must be at least considered.
BLED IN JUST THREE WEEKS. Conversely, only 10% of beef Is there some help on the way? That depends on where
cows are in states that now have Good/Excellent pasture ratings. you live. The 6-10 day precipitation forecast from the National
It should be noted that these are, to some degree, natural- Weather Service (shown on page 2) indicates reasonable chance
ly selecting groups as a high proportion of beef cows are always of above-normal rainfall for large parts of Arizona, New Mexico,
located in more arid and drought-prone states. States that usually Colorado and Utah. But much of the Midwest, Southwest and
get more rainfall tend to find higher value uses for their land. But Southeast have high probabilities of below-normal rainfall and the
the magnitude of the P/VP percentages is still large and the speed Great Plains (Nebraska, the Dakotas, Montana, Wyoming are ex-
with which it has grown is rather shocking. pected to have “Normal” rainfall. And we need to remember that
What does this mean? Cattle numbers could have normal rainfall in July and August in these areas may not amount to
changed even since July1 — or at least decisions are being made enough moisture to settle the dust.
The Daily Livestock Report is published by Steve Meyer and Len Steiner. To subscribe/unsubscribe visit www.dailylivestockreport.com.
Disclaimer: The Daily Livestock Report is intended solely for information purposes and is not to be construed, under any circumstances, by implication or otherwise, as an offer to sell or a solicitation to buy or trade any
commodities or securities whatsoever. Information is obtained from sources believed to be reliable, but is in no way guaranteed. No guarantee of any kind is implied or possible where projections of future conditions are
attempted. Futures trading is not suitable for all investors, and involves the risk of loss. Past results are no indication of future performance. Futures are a leveraged investment, and because only a percentage of a con-
tract’s value is require to trade, it is possible to lose more than the amount of money initially deposited for a futures position. Therefore, traders should only use funds that they can afford to lose without affecting their life-
style. And only a portion of those funds should be devoted to any one trade because a trader cannot expect to profit on every trade.
CME Group is the trademark of CME Group, Inc. The Globe logo, Globex® and CME® are trademarks of Chicago Mercantile Exchange, Inc. CBOT® is the trademark of the Board of Trade of the City of Chicago. NYMEX,
New York Mercantile Exchange, and ClearPort are trademarks of New York Mercantile Exchange. Inc. COMEX is a trademark of Commodity Exchange, Inc. Copyright © 2012 CME Group. All rights reserved.