More Related Content
Similar to Daily livestock report oct 8 2012
Similar to Daily livestock report oct 8 2012 (20)
More from joseleorcasita (20)
Daily livestock report oct 8 2012
- 1. Vol. 10, No. 194 October 8, 2012
Supply matters. That is a statement of obvious truth to those
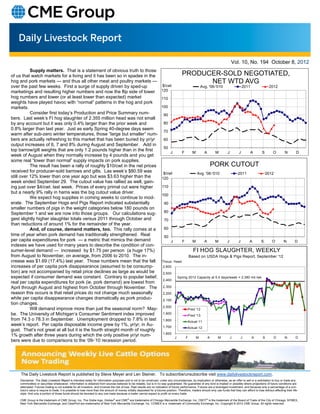
of us that watch markets for a living and it has been so in spades in the PRODUCER-SOLD NEGOTIATED,
hog and pork markets — and thus all other meat and poultry markets — NET WTD AVG
over the past few weeks. First a surge of supply driven by sped-up $/cwt Avg. '06-'010 2011 2012
marketings and resulting higher numbers and now the flip side of lower 120
hog numbers and lower (or at least lower than expected) market 110
weights have played havoc with “normal” patterns in the hog and pork
markets. 100
Consider first today’s Production and Price Summary num- 90
bers. Last week’s FI hog slaughter of 2.355 million head was not small
by any account but it was only 0.4% larger than the prior week and 80
0.8% larger than last year. Just as early Spring 40-degree days seem
70
warm after sub-zero winter temperatures, those “large but smaller” num-
bers are actually refreshing to this market that has been buried by yr/yr 60
output increases of 6, 7 and 8% during August and September. Add in
50
top barrow/gilt weights that are only 1.2 pounds higher than in the first
J F M A M J J A S O N D
week of August when they normally increase by 4 pounds and you get
some real “lower than normal” supply impacts on pork supplies.
The result has been a rally of roughly $10/cwt in the net prices PORK CUTOUT
received for producer-sold barrows and gilts. Las week’s $80.59 was $/cwt Avg. '06-'010 2011 2012
still over 12% lower than one year ago but was $3.63 higher than the 120
week ended September 29. The cutout value has rallied as well, gain-
ing just over $4/cwt. last week. Prices of every primal cut were higher 110
but a nearly 9% rally in hams was the big cutout value driver.
100
We expect hog supplies in coming weeks to continue to mod-
erate. The September Hogs and Pigs Report indicated substantially 90
smaller numbers of pigs in the weight categories below 180 pounds on
September 1 and we are now into those groups. Our calculations sug- 80 y
gest slightly higher slaughter totals versus 2011 through October and 70
than reductions of around 1% for the remainder of the year.
And, of course, demand matters, too. This rally comes at a 60
time of year when pork demand has traditionally strengthened. Real 50
per capita expenditures for pork — a metric that mimics the demand J F M A M J J A S O N D
indexes we have used for many years to describe the condition of con-
sumer-level demand — increased by $1.75 per person (a huge 17%) FI HOG SLAUGHTER, WEEKLY
from August to November, on average, from 2006 to 2010. The in- Based on USDA Hogs & Pigs Report, September '12
crease was $1.69 (17.4%) last year. Those numbers mean that the fall Thous. Head
increases of per capita pork disappearance (assumed to be consump- 2,600
tion) are not accompanied by retail price declines as large as would be 2,500
expected if consumer demand was constant. Contrary to popular belief, Spring 2012 Capacity at 5.4 days/week = 2.380 mil./wk.
2,400
real per capita expenditures for pork (ie. pork demand) are lowest from
April through August and highest from October through November. The 2,300
reason this occurs is that retail prices do not change much seasonally 2,200
while per capita disappearance changes dramatically as pork produc- 2,100
tion changes.
2,000
Will demand improve more than just the seasonal norm? May- Pred '12
be. The University of Michigan’s Consumer Sentiment index improved 1,900
Pred '13
from 74.3 o 78.3 in September. Unemployment dropped to 7.8% in last 1,800 Actual 11
week’s report. Per capita disposable income grew by 1%, yr/yr, in Au- 1,700 Actual 12
gust. That’s not great at all but it is the fourth straight month of roughly
1,600
1% growth after three years during which the only positive yr/yr num- J F M A M J J A S O N D
bers were due to comparisons to the ‘09-’10 recession period.
The Daily Livestock Report is published by Steve Meyer and Len Steiner. To subscribe/unsubscribe visit www.dailylivestockreport.com.
Disclaimer: The Daily Livestock Report is intended solely for information purposes and is not to be construed, under any circumstances, by implication or otherwise, as an offer to sell or a solicitation to buy or trade any
commodities or securities whatsoever. Information is obtained from sources believed to be reliable, but is in no way guaranteed. No guarantee of any kind is implied or possible where projections of future conditions are
attempted. Futures trading is not suitable for all investors, and involves the risk of loss. Past results are no indication of future performance. Futures are a leveraged investment, and because only a percentage of a con-
tract’s value is require to trade, it is possible to lose more than the amount of money initially deposited for a futures position. Therefore, traders should only use funds that they can afford to lose without affecting their life-
style. And only a portion of those funds should be devoted to any one trade because a trader cannot expect to profit on every trade.
CME Group is the trademark of CME Group, Inc. The Globe logo, Globex® and CME® are trademarks of Chicago Mercantile Exchange, Inc. CBOT® is the trademark of the Board of Trade of the City of Chicago. NYMEX,
New York Mercantile Exchange, and ClearPort are trademarks of New York Mercantile Exchange. Inc. COMEX is a trademark of Commodity Exchange, Inc. Copyright © 2012 CME Group. All rights reserved.
- 2. Vol. 10, No. 192 October 4, 2012
PRODUCTION AND PRICE SUMMARY Week Ending 10/6/2012
Current Pct. Pct. Pct.
Item Units Week Last Week Change Last Year Change YTD Change
Total Meat & Poultry Prod. Million lbs. 1762.7 1763.5 -0.04% 1791.6 -1.61% 66,772 -1.06%
C FI Slaughter Thou. Head 620 651 -4.76% 669 -7.31% 24,904 -4.20%
A FI Cow Slaughter Thou. Head 128.5 127.9 0.48% 148.0 -13.17% 4,547 -4.61%
T Avg. Live Weight Lbs. 1327 1316 0.84% 1290 2.87% 1,299 1.88%
T Avg. Dressed Weight Lbs. 797 794 0.38% 781 2.05% 788 2.10%
L Beef Production Million Lbs. 493.3 516.3 -4.45% 521.2 -5.35% 19,582 -2.06%
E Live Fed Steer $/cwt live wt. 123.57 122.45 0.90% 120.97 2.15%
Dressed Steer $/cwt carcass 189.84 190.75 -0.48% 189.88 -0.02%
& OKC Feeder Steer 600-700 Lbs. 148.60 151.79 -2.10% 142.81 4.05%
Beef Cutout 600-750 Choice 190.34 191.77 -0.75% 184.20 3.33%
B Hide/Offal $/cwt live wt. 13.34 13.41 -0.52% 13.20 1.06%
E Rib Choice 287.09 286.87 0.08% 286.53 0.20%
E Round Choice 170.23 171.30 -0.62% 167.95 1.36%
F Chuck Choice 164.54 166.87 -1.40% 153.47 7.21%
Trimmings, 50% Fresh 51.59 49.04 5.20% 89.11 -42.11%
Trimmings, 90% Fresh 201.80 203.40 -0.79% 167.31 20.61%
H FI Slaughter Thou. Head 2355 2345 0.43% 2336 0.83% 84,430 2.01%
O FI Sow Slaughter Thou. Head 66.7 64.9 2.87% 64.9 2.85% 2,161 -0.49%
G Avg. Dressed Weight Lbs. 202 202 0.00% 205 -1.46% 206 0.34%
S Pork Production Million Lbs. 476.7 474 0.57% 477.3 -0.13% 17,367 2.40%
Iowa-S. Minn. Direct Avg. 78.59 74.77 5.10% 93.14 -15.60%
& Natl. Base Carcass Price Weighted Avg. 78.17 74.50 4.90% 88.88 -12.10%
Natl. Net Carcass Price Weighted Avg. 80.59 76.96 4.70% 91.77 -12.20%
P Pork Cutout 200 Lbs 83.43 79.41 5.10% 98.06 -14.90%
O Hams Primal Cutout 73.99 68.08 8.70% 87.56 -15.50%
R Loins Primal Cutout 90.96 88.75 2.50% 113.24 -19.70%
K Bellies Primal Cutout 118.28 110.46 7.10% 118.86 -0.50%
C Young Chicken Slaughter* Million Head 155.61 154.23 0.90% 156.44 -0.53% 5,948 -4.01%
H Avg. Weight Lbs., RTC 4.40 4.29 2.43% 4.37 0.51% 4.3 -0.05%
I Broiler Production Million Lbs., RTC 684.0 661.8 3.35% 684.1 -0.02% 25,653 -2.99%
C Eggs Set Million 185.8 187.4 -0.87% 181.8 2.22% 7,615 -2.75%
K Chicks Placed Million Head 154.4 158.9 -2.84% 154.4 0.03% 6,370 -2.41%
E 12-City Broiler Composite 82.56 82.74 -0.20% 72.30 14.20%
N Georgia Dock Broiler 2.5-3 Lbs. 95 95.23 -0.20% 87.12 9.00%
Northeast Breast Skinlss/Bonelss 131.73 136.77 -3.70% 122.03 7.90%
Northeast Let Quarters 51.80 52.15 2.90% 53.52 0.80%
T Young Turkey Slaughter* Million Head 4.45 4.66 -4.44% 4.67 -4.65% 171.4 -0.33%
U Avg. Weight Lbs. 24.42 23.90 2.17% 23.34 4.62% 24.3 2.14%
R Turkey Production Million Lbs. 108.7 111.3 -2.37% 108.9 -0.24% 4,170 1.94%
K Eastern Region Hen 8-16 Lbs. 111.02 110.86 0.10% 112.08 -0.90%
F Corn, Omaha $ per Bushel 7.65 7.13 7.22% 5.97 28.06%
E DDGS, Minnesota $ per ton 265.00 270.00 -1.85% 186.00 42.47%
E Wheat, Kansas City $ per Bushel 8.39 8.81 -4.77% 6.50 29.08%
D Soybeans, S. Iowa $ per Bushel 15.59 15.83 -1.52% 11.50 35.50%
SB Meal, 48% Central Illinois $ per Ton 485.30 490.10 -0.98% 285.60 69.90%
* Chicken & turkey slaughter, production and prices are 1 week earlier than the date at the top of this table. Cow & sow slaughter are for 2 weeks earlier