More Related Content
Similar to Daily livestock report dec 7 2012
Similar to Daily livestock report dec 7 2012 (20)
More from joseleorcasita (20)
Daily livestock report dec 7 2012
- 1. Vol. 10, No. 237 December 7, 2012
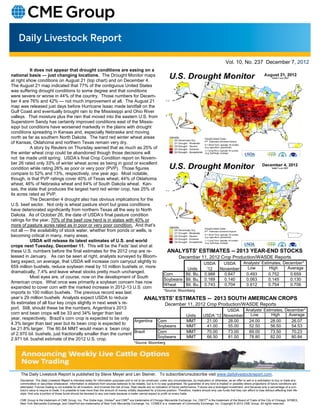
It does not appear that drought conditions are easing on a
national basis — just changing locations. The Drought Monitor maps
at right show conditions on August 21 (top chart) and on December 4.
The August 21 map indicated that 77% of the contiguous United States
was suffering drought conditions to some degree and that conditions
were severe or worse in 44% of the country. Those numbers for Decem-
ber 4 are 76% and 42% — not much improvement at all. The August 21
map was released just days before Hurricane Isaac made landfall on the
Gulf Coast and eventually brought rain to the Mississippi and Ohio River
valleys. That moisture plus the rain that moved into the eastern U.S. from
Superstorm Sandy has certainly improved conditions east of the Missis-
sippi but conditions have worsened markedly in the plains with drought
conditions spreading in Kansas and, especially Nebraska and moving
north as far as southern North Dakota. The hard red winter wheat areas
of Kansas, Oklahoma and northern Texas remain very dry.
A story by Reuters on Thursday warned that as much as 25% of
the winter wheat crop could be abandoned though those decisions will
not be made until spring. USDA’s final Crop Condition report on Novem-
ber 26 rated only 33% of winter wheat acres as being in good or excellent
condition while rating 26% as poor or very poor (PVP). Those figures
compare to 52% and 13%, respectively, one year ago. Most notable,
though, is that PVP ratings cover 40% of Texas wheat, 44% of Oklahoma
wheat, 46% of Nebraska wheat and 64% of South Dakota wheat. Kan-
sas, the state that produces the largest hard red winter crop, has 25% of
its acres rated as PVP.
The December 4 drought also has obvious implications for the
U.S. beef sector. Not only is wheat pasture short but grass conditions
have deteriorated significantly from northern Texas all the way to North
Dakota. As of October 26, the date of USDA’s final pasture condition
ratings for the year, 70% of the beef cow herd is in states with 40% or
more of pasture acres rated as in poor or very poor condition. And that’s
not all — the availability of stock water, whether from ponds or wells, is
becoming critical in many, many areas.
USDA will release its latest estimates of U.S. and world
crops next Tuesday, December 11. This will be the Feds’ last shot at
these U.S. numbers before the final estimates for the 2012 crop are re- ANALYSTS' ESTIMATES -- 2013 YEAR-END STOCKS
leased in January. As can be seen at right, analysts surveyed by Bloom- December 11, 2012 Crop Production/WASDE Reports
berg expect, on average, that USDA will increase corn carryout slightly to USDA USDA Analysts' Estimates, December*
659 million bushels, reduce soybean meal by 10 million bushels or, more Units '12 November Low High Average
dramatically, 7.4% and leave wheat stocks pretty much unchanged.
Corn Bil. Bu. 0.988 0.647 0.493 0.752 0.659
Most eyes are, of course, now on the development of South
Soybeans Bil. Bu. 0.169 0.140 0.063 0.145 0.130
American crops. What once was primarily a soybean concern has now
Wheat Bil. Bu. 0.743 0.704 0.612 0.754 0.706
expanded to cover corn with the marked increase in 2012-13 U.S. corn
*Source: Bloomberg
imports to 100 million bushels. The previous record was last
year’s 29 million bushels Analysts expect USDA to reduce ANALYSTS' ESTIMATES -- 2013 SOUTH AMERICAN CROPS
its estimates of all four key crops slightly in next week’s re- December 11, 2012 Crop Production/WASDE Reports
port. Still, should these be the numbers, Argentina’s 2013 Analysts' Estimates, December*
USDA
corn and bean crops will be 33 and 34% larger than last Low High Average
Units USDA '12 November
year, respectively. Brazil’s corn crop is expected to be only
Argentina Corn MMT 21.00 28.00 24.00 28.00 26.07
4.3% larger than last year but its bean crop is expected to
Soybeans MMT 41.00 55.00 52.50 56.50 54.53
be 21.8% larger. The 80.84 MMT would mean a bean crop
of 2.970 bil. bushels, just fractionally smaller than the current Brazil Corn MMT 70.00 73.00 69.00 73.50 70.23
Soybeans MMT 66.50 81.00 78.80 82.00 80.84
2.971 bil. bushel estimate of the 2012 U.S. crop.
*Source: Bloomberg
The Daily Livestock Report is published by Steve Meyer and Len Steiner. To subscribe/unsubscribe visit www.dailylivestockreport.com.
Disclaimer: The Daily Livestock Report is intended solely for information purposes and is not to be construed, under any circumstances, by implication or otherwise, as an offer to sell or a solicitation to buy or trade any
commodities or securities whatsoever. Information is obtained from sources believed to be reliable, but is in no way guaranteed. No guarantee of any kind is implied or possible where projections of future conditions are
attempted. Futures trading is not suitable for all investors, and involves the risk of loss. Past results are no indication of future performance. Futures are a leveraged investment, and because only a percentage of a con-
tract’s value is require to trade, it is possible to lose more than the amount of money initially deposited for a futures position. Therefore, traders should only use funds that they can afford to lose without affecting their life-
style. And only a portion of those funds should be devoted to any one trade because a trader cannot expect to profit on every trade.
CME Group is the trademark of CME Group, Inc. The Globe logo, Globex® and CME® are trademarks of Chicago Mercantile Exchange, Inc. CBOT® is the trademark of the Board of Trade of the City of Chicago. NYMEX,
New York Mercantile Exchange, and ClearPort are trademarks of New York Mercantile Exchange. Inc. COMEX is a trademark of Commodity Exchange, Inc. Copyright © 2012 CME Group. All rights reserved.