More Related Content
Similar to Daily livestock report aug 13 2012 (20)
More from joseleorcasita (20)
Daily livestock report aug 13 2012
- 1. Vol. 10, No. 156 / August 13, 2012
Market Comments USDA/WASDE Corn Supply/Demand Estimates
2011/12 2012/13 Projection
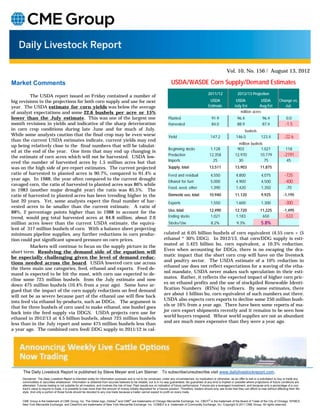
The USDA report issued on Friday contained a number of
big revisions to the projections for both corn supply and use for next USDA USDA USDA Change vs.
year. The USDA estimate for corn yields was below the average Estimate July Est Aug Est Jul.
of analyst expectations and some 22.6 bushels per acre or 15% million acres
lower than the July estimate. This was one of the largest one Planted 91.9 96.4 96.4 0.0
month revisions in yields and indicative of the sharp deterioration Harvested 84.0 88.9 87.4 -1.5
in corn crop conditions during late June and for much of July. bushels
While some analysts caution that the final crop may be even worse Yield 147.2 146.0 123.4 -22.6
than the current USDA estimates indicate, current yields may end
million bushels
up being relatively close to the final numbers that will be tabulat-
Beginning stocks 1,128 903 1,021 118
ed at the end of the year. One item that may end up changing is
Production 12,358 12,970 10,779 -2191
the estimate of corn acres which will not be harvested. USDA low-
Imports 25 30 75 45
ered the number of harvested acres by 1.5 million acres but that
was on the high side of pre-report estimates. The current projected Supply, total 13,511 13,903 11,875
ratio of harvested to planted acres is 90.7%, compared to 91.4% a Feed and residual 4,550 4,800 4,075 -725
year ago. In 1988, the year often compared to the current drought
Ethanol for fuel 5,000 4,900 4,500 -400
ravaged corn, the ratio of harvested to planted acres was 86% while
Food, seed, other 1,390 1,420 1,350 -70
in 1983 (another major drought year) the ratio was 85.5%. The
ratio of harvested to planted acres has been trending higher in the Domestic use, total 10,940 11,120 9,925 -1,195
last 20 years. Yet, some analysts expect the final number of har- Exports 1,550 1,600 1,300 -300
vested acres to be smaller than the current estimate. A ratio of
88%, 2 percentage points higher than in 1988 to account for the Use, total 12,490 12,720 11,225 -1,495
trend, would peg total harvested acres at 84.8 million, about 2.6 Ending stocks 1,021 1,183 650 -533
million acres lower than the current USDA estimate, the equiva- Stocks/Use 8.2% 9.3% 5.8%
lent of 317 million bushels of corn. With a balance sheet projecting
minimum pipeline supplies, any further reductions in corn produc- culated at 6.05 billion bushels of corn equivalent (4.55 corn + (5
tion could put significant upward pressure on corn prices. ethanol * 30% DDG). In 2012/13, that corn/DDG supply is esti-
mated at 5.425 billion bu. corn equivalent, a 10.3% reduction.
Markets will continue to focus on the supply picture in the
Even when accounting for DDGs, there is no escaping the dra-
short term. Resolving the demand side of the equation will
matic impact that the short corn crop will have on the livestock
be especially challenging given the level of demand reduc-
and poultry sector. The USDA estimate of a 10% reduction in
tions needed across the board. USDA lowered corn use across
ethanol use does not reflect expectations for a waving of the etha-
the three main use categories, feed, ethanol and exports. Feed de-
nol mandate, USDA never makes such speculation in their esti-
mand is expected to be hit the most, with corn use expected to de-
mates. Rather, it reflects the expected impact of higher corn pric-
cline some 725 million bushels from the July estimate and now
es on ethanol profits and the use of stockpiled Renewable Identi-
down 475 million bushels (10.4% from a year ago). Some have ar-
fication Numbers (RINs) by refiners. By some estimates, there
gued that the impact of the corn supply reductions on feed demand
are about 1 billion bu. corn equivalent of such numbers out there.
will not be as severe because part of the ethanol use will flow back
USDA also expects corn exports to decline some 250 million bush-
into feed via ethanol by-products, such as DDGs. The argument is
els or 16% from a year ago. There have been some reports of ma-
that for three bushels of corn used to make ethanol, one bushel goes
jor corn export shipments recently and it remains to be seen how
back into the feed supply via DDGS. USDA projects corn use for
world buyers respond. Wheat world supplies are not as abundant
ethanol in 2012/13 at 4.5 billion bushels, about 725 million bushels
and are much more expensive than they were a year ago.
less than in the July report and some 475 million bushels less than
a year ago. The combined corn feed/ DDG supply in 2011/12 is cal-
The Daily Livestock Report is published by Steve Meyer and Len Steiner. To subscribe/unsubscribe visit www.dailylivestockreport.com.
Disclaimer: The Daily Livestock Report is intended solely for information purposes and is not to be construed, under any circumstances, by implication or otherwise, as an offer to sell or a solicitation to buy or trade any
commodities or securities whatsoever. Information is obtained from sources believed to be reliable, but is in no way guaranteed. No guarantee of any kind is implied or possible where projections of future conditions are
attempted. Futures trading is not suitable for all investors, and involves the risk of loss. Past results are no indication of future performance. Futures are a leveraged investment, and because only a percentage of a con-
tract’s value is require to trade, it is possible to lose more than the amount of money initially deposited for a futures position. Therefore, traders should only use funds that they can afford to lose without affecting their life-
style. And only a portion of those funds should be devoted to any one trade because a trader cannot expect to profit on every trade.
CME Group is the trademark of CME Group, Inc. The Globe logo, Globex® and CME® are trademarks of Chicago Mercantile Exchange, Inc. CBOT® is the trademark of the Board of Trade of the City of Chicago. NYMEX,
New York Mercantile Exchange, and ClearPort are trademarks of New York Mercantile Exchange. Inc. COMEX is a trademark of Commodity Exchange, Inc. Copyright © 2011 CME Group. All rights reserved.
- 2. Page 2
Vol. 10, No. 156 / August 13, 2012
PRODUCTION & PRICE SUMMARY Week Ending 8/11/2012
Current Pct. Pct. Y/Y %
Item Units Week Last Week Change Last Year Change YTD Change
11-Aug-12 4-Aug-12 13-Aug-11
Total Red Meat & Poultry mil lbs., cwe 1,693 1,689 0.20% 1,686 0.41% 52,875 17.0%
FI Slaughter Thou. Head 639 647 -1.24% 665 -3.94% 19,871 -4.2%
C FI Cow Slaughter ** Thou. Head 122 132 -7.87% 128 -4.96% 3,567 -3.2%
A Avg. Live Weight Lbs. 1300 1300 0.00% 1267 2.60% 1,296 1.7%
T Avg. Dressed Weight Lbs. 791 792 -0.13% 774 2.20% 786 2.0%
T Beef Production Million Lbs. 504.0 511.4 -1.45% 513.4 -1.83% 15,585 -2.2%
L Live Fed Steer Price $ per cwt 119.16 117.61 1.32% 116.12 2.62%
E Dressed Fed Steer Price $ per cwt 188.78 184.95 2.07% 184.78 2.16%
OKC Feeder Steer, 600-700 $ per cwt N/A 140.88 N/A 135.93 N/A
& Choice Beef Cutout $ per cwt 181.46 177.88 2.01% 176.65 2.72%
Hide/Offal $ per cwt, live wt 13.26 13.26 0.00% 13.61 -2.57%
B Rib, Choice $ per cwt 268.41 261.70 2.56% 247.06 8.64%
E Round, Choice $ per cwt 161.51 158.92 1.63% 158.22 2.08%
E Chuck, Choice $ per cwt 146.59 142.86 2.61% 144.20 1.66%
F Trimmings, 50% $ per cwt 43.19 44.05 -1.95% 88.03 -50.94%
Trimmings, 90% $ per cwt 207.84 206.90 0.45% 178.54 16.41%
FI Slaughter Thou. Head 2,031 2,025 0.30% 2,041 -0.50% 66,078 1.2%
FI Sow Slaughter ** Thou. Head 61.4 56.5 8.76% 58.3 5.38% 1,669 -1.7%
H Avg. Dressed Weight Lbs. 201.0 202.0 -0.50% 198.0 1.52% 207 0.4%
O Pork Production Million Lbs. 408.7 408.4 0.07% 404.6 1.01% 13,664 1.7%
G Iowa-S. Minn. Direct Wtd. Avg. 91.12 92.52 -1.51% 103.99 -12.38%
S Natl. Base Carcass Price Wtd. Avg. 91.54 92.41 -0.94% 100.58 -8.99%
Natl. Net Carcass Price Wtd. Avg. 93.99 94.90 -0.96% 103.75 -9.41%
Pork Cutout 185 Lbs. 93.00 92.76 0.26% 109.83 -15.32%
Hams $ per cwt 77.01 77.57 -0.72% 89.29 -13.75%
Loins $ per cwt 98.78 99.70 -0.92% 130.33 -24.21%
Bellies $ per cwt 152.73 148.79 2.65% 157.45 -3.00%
C Young Chicken Slaughter * Million Head 154.9 157.2 -1.44% 158.7 -2.37% 4,716 -4.7%
H Avg. Weight (Live) Lbs. 5.75 5.60 2.68% 5.62 2.31% 5.72 -0.1%
I Chicken Production (RTC) Million Lbs. 672.5 664.6 1.20% 664.4 1.23% 20,305 -3.8%
C Eggs Set Million 195.3 196.3 -0.51% 195.0 0.16% 6,106 -3.5%
K Chicks Placed Million Head 163.6 161.3 1.46% 164.1 -0.26% 5,089 -3.0%
E 12-City Broiler Price Composite 80.61 79.87 0.93% 80.61 0.00%
N Georgia Dock Broiler Price 2.5-3 Lbs. 93.85 93.81 0.04% 86.2 8.87%
Northeast Breast, B/S $/cwt 135.46 136.2 -0.54% 123.14 10.00%
Northeast Legs $/cwt 65.88 64.29 2.47% 63.41 3.90%
T Young Turkey Slaughter * Million Head 4.670 4.418 5.70% 4.487 4.08% 135.742 -0.2%
U Avg. Live Weight Lbs. 28.80 29.71 -3.06% 28.84 -0.14% 30.08 0.1%
R Turkey Production (RTC) Million Lbs. 107.5 104.9 2.46% 103.5 3.90% 3,322 N/A
K Eastern Region Hen Price 8-16 Lbs. 107.70 108.12 -0.39% 105.00 2.57%
G Corn, Omaha $ per Bushel 8.21 7.99 2.75% 7.20 14.03%
R DDGs, Minnesota $ per Ton 302.50 302.50 0.00% 182.50 65.75%
A Wheat, Kansas City $ per Bushel 8.66 8.69 -0.35% 7.66 13.05%
I Soybeans, S. Iowa $ per Bushel 16.96 17.02 -0.35% 13.44 26.19%
N Soybn Meal, 48% Decatur $ per Ton 561.20 554.70 1.17% 340.40 64.86%
* Chicken & turkey slaughter & production are 1 week earlier than the date at the top of this sheet.
** Cow and sow slaughter reflect levels from two weeks ago due to reporting lag.