More Related Content
Similar to Daily livestock report nov 5 2012
Similar to Daily livestock report nov 5 2012 (17)
More from joseleorcasita (20)
Daily livestock report nov 5 2012
- 1. Vol. 10, No. 214 / November 5, 2012
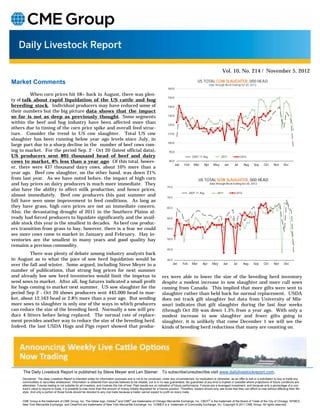
Market Comments US TOTAL COW SLAUGHTER, 000 HEAD
Data through Week Ending Oct 20, 2012
160.0
When corn prices hit $8+ back in August, there was plen-
150.0
ty of talk about rapid liquidation of the US cattle and hog
breeding stock. Individual producers may have reduced some of 140.0
their numbers but the big picture data shows that the impact
so far is not as deep as previously thought. Some segments 130.0
within the beef and hog industry have been affected more than 120.0
others due to timing of the corn price spike and overall feed struc-
ture. Consider the trend in US cow slaughter. Total US cow 110.0
slaughter has been running below year ago levels since July, in
100.0
large part due to a sharp decline in the number of beef cows com-
ing to market. For the period Sep. 2 - Oct 20 (latest official data), 90.0
US producers sent 895 thousand head of beef and dairy 2007-11 Avg. 2011 2012
cows to market, 8% less than a year ago. Of this total, howev- 80.0
Jan Feb Mar Apr May Jun Jul Aug Sep Oct Nov Dec
er, there were 437 thousand dairy cows, about 10% more than a
year ago. Beef cow slaughter, on the other hand, was down 21%
from last year. As we have noted before, the impact of high corn US TOTAL SOW SLAUGHTER, 000 HEAD
and hay prices on dairy producers is much more immediate. They Data through Week Ending Oct 20, 2012
75.0
also have the ability to affect milk production, and hence prices,
2007-11 Avg. 2011 2012
almost immediately. Beef cow producers this past summer and 70.0
fall have seen some improvement in feed conditions. As long as
they have grass, high corn prices are not an immediate concern. 65.0
Also, the devastating drought of 2011 in the Southern Plains al-
ready had forced producers to liquidate significantly and the avail- 60.0
able stock this year is the smallest in decades. As beef cow produc-
ers transition from grass to hay, however, there is a fear we could 55.0
see more cows come to market in January and February. Hay in-
ventories are the smallest in many years and good quality hay 50.0
remains a precious commodity.
45.0
There was plenty of debate among industry analysts back
in August as to what the pace of sow herd liquidation would be 40.0
over the fall and winter. Some argued, including Steve Meyer in a Jan Feb Mar Apr May Jun Jul Aug Sep Oct Nov Dec
number of publications, that strong hog prices for next summer
and already low sow herd inventories would limit the impetus to ers were able to lower the size of the breeding herd inventory
send sows to market. After all, hog futures indicated a small profit despite a modest increase in sow slaughter and more cull sows
for hogs coming to market next summer. US sow slaughter for the coming from Canada. This implied that more gilts were sent to
period Sep 2 - Oct 20 shows producers sent 445,000 head to mar- slaughter rather than held back for normal replacement. USDA
ket, about 12,163 head or 2.8% more than a year ago. But sending does not track gilt slaughter but data from University of Mis-
more sows to slaughter is only one of the ways in which producers souri indicates that gilt slaughter during the last four weeks
can reduce the size of the breeding herd. Normally a sow will pro- (through Oct 20) was down 1.3% from a year ago. With only a
duce 4 litters before being replaced. The normal rate of replace- modest increase in sow slaughter and fewer gilts going to
ment provides another way to reduce the size of the breeding herd. slaughter, it is unlikely that come December 1 we will see the
Indeed, the last USDA Hogs and Pigs report showed that produc- kinds of breeding herd reductions that many are counting on.
The Daily Livestock Report is published by Steve Meyer and Len Steiner. To subscribe/unsubscribe visit www.dailylivestockreport.com.
Disclaimer: The Daily Livestock Report is intended solely for information purposes and is not to be construed, under any circumstances, by implication or otherwise, as an offer to sell or a solicitation to buy or trade any
commodities or securities whatsoever. Information is obtained from sources believed to be reliable, but is in no way guaranteed. No guarantee of any kind is implied or possible where projections of future conditions are
attempted. Futures trading is not suitable for all investors, and involves the risk of loss. Past results are no indication of future performance. Futures are a leveraged investment, and because only a percentage of a con-
tract’s value is require to trade, it is possible to lose more than the amount of money initially deposited for a futures position. Therefore, traders should only use funds that they can afford to lose without affecting their life-
style. And only a portion of those funds should be devoted to any one trade because a trader cannot expect to profit on every trade.
CME Group is the trademark of CME Group, Inc. The Globe logo, Globex® and CME® are trademarks of Chicago Mercantile Exchange, Inc. CBOT® is the trademark of the Board of Trade of the City of Chicago. NYMEX,
New York Mercantile Exchange, and ClearPort are trademarks of New York Mercantile Exchange. Inc. COMEX is a trademark of Commodity Exchange, Inc. Copyright © 2011 CME Group. All rights reserved.
- 2. Page 2
Vol. 10, No. 214 / November 5, 2012
PRODUCTION & PRICE SUMMARY Week Ending 11/3/2012
Current Pct. Pct. Y/Y %
Item Units Week Last Week Change Last Year Change YTD Change
3-Nov-12 27-Oct-12 5-Nov-11
Total Red Meat & Poultry mil lbs., cwe 1,791 1,811 -1.11% 1,775 0.91% 73,969 80.8%
FI Slaughter Thou. Head 643 641 0.31% 650 -1.14% 27,461 -4.1%
C FI Cow Slaughter ** Thou. Head 135 133 1.87% 140 -3.54% 5,077 -4.7%
A Avg. Live Weight Lbs. 1327 1326 0.08% 1293 2.63% 1,301 1.9%
T Avg. Dressed Weight Lbs. 800 800 0.00% 776 3.09% 789 2.2%
T Beef Production Million Lbs. 513.4 511.4 0.39% 503.1 2.05% 21,627 -1.9%
L Live Fed Steer Price $ per cwt 126.18 126.58 -0.32% 121.54 3.82%
E Dressed Fed Steer Price $ per cwt 196.40 197.78 -0.70% 194.61 0.92%
OKC Feeder Steer, 600-700 $ per cwt N/A 151.78 N/A 146.48 N/A
& Choice Beef Cutout $ per cwt 195.34 198.49 -1.59% 187.52 4.17%
Hide/Offal $ per cwt, live wt 13.01 13.07 -0.46% 12.47 4.33%
B Rib, Choice $ per cwt 306.81 298.06 2.94% 309.48 -0.86%
E Round, Choice $ per cwt 175.72 180.34 -2.56% 164.35 6.92%
E Chuck, Choice $ per cwt 162.40 172.20 -5.69% 150.98 7.56%
F Trimmings, 50% $ per cwt 66.49 64.39 3.26% 114.30 -41.83%
Trimmings, 90% $ per cwt 203.99 203.39 0.29% 178.35 14.38%
FI Slaughter Thou. Head 2,359 2,379 -0.84% 2,350 0.40% 93,935 2.0%
FI Sow Slaughter ** Thou. Head 63.8 62.7 1.71% 65.2 -2.19% 2,420 -0.1%
H Avg. Dressed Weight Lbs. 204.0 203.0 0.49% 207.0 -1.45% 206 0.2%
O Pork Production Million Lbs. 480 482.7 -0.56% 487 -1.44% 19,302 2.3%
G Iowa-S. Minn. Direct Wtd. Avg. 80.61 82.80 -2.64% 87.10 -7.45%
S Natl. Base Carcass Price Wtd. Avg. 81.85 82.96 -1.34% 86.68 -5.57%
Natl. Net Carcass Price Wtd. Avg. 84.19 85.35 -1.36% 89.12 -5.53%
Pork Cutout 200 Lbs. 85.41 86.46 -1.21% 94.45 -9.57%
Hams $ per cwt 71.75 74.13 -3.21% 84.35 -14.94%
Loins $ per cwt 88.72 93.70 -5.31% 102.40 -13.36%
Bellies $ per cwt 130.68 124.08 5.32% 117.85 10.89%
C Young Chicken Slaughter * Million Head 153.4 155.5 -1.33% 152.6 0.52% 6,567 -3.6%
H Avg. Weight (Live) Lbs. 5.76 5.95 -3.19% 5.74 0.35% 5.74 0.1%
I Chicken Production (RTC) Million Lbs. 667.1 698.4 -4.48% 657.0 1.54% 28,400 N/A
C Eggs Set Million 186.4 177.2 5.20% 185.2 0.65% 8,351 -2.5%
K Chicks Placed Million Head 156.9 154.3 1.69% 153.3 2.34% 6,992 -2.0%
E 12-City Broiler Price Composite 88.83 84.81 4.74% 74.55 19.15%
N Georgia Dock Broiler Price 2.5-3 Lbs. 95.52 95.3 0.23% 87.74 8.87%
Northeast Breast, B/S $/cwt 130.86 130.34 0.40% 120.28 8.80%
Northeast Legs $/cwt 69.74 70.86 -1.58% 70.51 -1.09%
T Young Turkey Slaughter * Million Head 5.553 4.991 11.26% 5.546 0.13% 191.082 -0.4%
U Avg. Live Weight Lbs. 29.34 29.68 -1.15% 28.76 2.02% 30.05 1.1%
R Turkey Production (RTC) Million Lbs. 130.3 118.5 9.98% 127.6 2.13% 4,640 N/A
K Eastern Region Hen Price 8-16 Lbs. 109.58 110.07 -0.45% 114.81 -4.56%
G Corn, Omaha $ per Bushel 7.74 7.65 1.18% 6.50 19.08%
R DDGs, Minnesota $ per Ton 257.50 257.50 0.00% 205.00 25.61%
A Wheat, Kansas City $ per Bushel 8.77 8.79 -0.23% 6.96 26.01%
I Soybeans, S. Iowa $ per Bushel 15.72 15.74 -0.13% 12.32 27.60%
N Soybn Meal, 48% Decatur $ per Ton 504.30 501.40 0.58% 303.50 66.16%
* Chicken & turkey slaughter & production are 1 week earlier than the date at the top of this sheet.
** Cow and sow slaughter reflect levels from two weeks ago due to reporting lag.