2. Page 2
Sponsored by
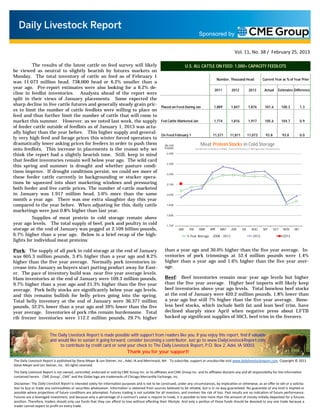
Vol. 11, No. 38 / February 25, 2013
USDA STOCKS IN COLD STORAGE REPORT
COMMODITY Stocks in All Warehouses Percent Of
31-Jan-12 31-Dec-12 31-Jan-13 Jan-12 Dec-12
1,000 Pounds
Frozen Pork
Picnics, Bone-In 10,898 7,839 12,674 116 162
Hams, Total 99,643 79,266 109,266 110 138
Bone-in 47,051 27,988 50,559 107 181
Boneless 52,592 51,278 58,707 112 114
Bellies 53,685 36,037 36,377 68 101
Loins, Total 48,851 41,364 43,839 90 106
Bone-in 18,374 15,304 13,644 74 89
Boneless 30,477 26,060 30,195 99 116
Ribs 86,457 109,235 112,162 130 103
Butts 26,869 25,881 30,949 115 120
Trimmings 56,565 52,684 57,379 101 109
Other 96,321 102,623 112,574 117 110
Variety Meats 35,904 27,404 28,320 79 103
Unclassified 70,114 69,177 61,726 88 89
Total 585,307 551,510 605,266 103 110
Frozen Beef
Boneless 427,750 395,953 420,119 98 106
Beef Cuts 57,309 69,763 63,884 111 92
Total 485,059 465,716 484,003 100 104
Other
Veal 2,996 5,221 4,982 166 95
Lamb & Mutton 19,275 21,379 18,716 97 88
Total 22,271 26,600 23,698 106 89
Total Red Meat 1,092,637 1,043,826 1,112,967 102 107
Chicken
Broilers (Whole) 15,430 14,601 18,780 122 129
Breasts and Breast Meat 116,924 130,909 130,128 111 99
Leg Quarters 84,503 97,177 115,370 137 119
Wings 35,657 68,410 59,212 166 87
Other Chicken 355,057 365,345 334,186 94 91
Total 607,571 676,442 657,676 108 97
Turkey
Whole Turkeys 109,990 95,854 148,637 135 155
Turkey Breast 49,726 54,140 64,024 129 118
Other 138,020 146,485 149,181 108 102
Total 297,736 296,479 361,842 122 122
Ducks 2,371 2,363 1,444 61 61
Total Poultry 907,678 975,284 1,020,962 112 105
The Daily Livestock Report is made possible with support from readers like you. If you enjoy reading this report and would like to
sustain it going forward, consider becoming a contributor by going to our website: www.DailyLivestockReport.com
Thank you for your support!
3. Page 3
Sponsored by
Vol. 11, No. 38 / February 25, 2013
PRODUCTION & PRICE SUMMARY Week Ending 2/23/2013
Current Y/Y %
Item Units Week Last Week Pct. Change Last Year Pct. Change YTD Change
23-Feb-13 16-Feb-13 25-Feb-12
Total Red Meat & Poultry mil lbs., cwe 1,660 1,725 -3.78% 1,658 0.09% 12,569 0.2%
FI Slaughter Thou. Head 573 596 -3.86% 587 -2.37% 4,677 -2.8%
C FI Cow Slaughter ** Thou. Head 119 123 -3.09% 124 -3.89% 746 -3.9%
A Avg. Live Weight Lbs. 1321 1325 -0.30% 1312 0.69% 1,328 1.6%
T Avg. Dressed Weight Lbs. 802 802 0.00% 792 1.26% 801 2.0%
T Beef Production Million Lbs. 458.7 476.7 -3.78% 463.6 -1.06% 3,703 -1.9%
L Live Fed Steer Price $ per cwt 122.76 122.81 -0.04% 127.87 -4.00%
E Dressed Fed Steer Price $ per cwt 195.58 195.76 -0.09% 200.73 -2.57%
OKC Feeder Steer, 600-700 $ per cwt N/A N/A N/A 170.39 N/A
& Choice Beef Cutout $ per cwt 182.51 183.07 -0.31% 195.42 -6.61%
Hide/Offal $ per cwt, live wt 13.84 13.62 1.62% 13.15 5.25%
B Rib, Choice $ per cwt 270.65 272.44 -0.66% 277.38 -2.43%
E Round, Choice $ per cwt 156.35 157.57 -0.77% 171.79 -8.99%
E Chuck, Choice $ per cwt 159.43 159.12 0.19% 161.44 -1.25%
F Trimmings, 50% $ per cwt 66.77 65.53 1.89% 100.14 -33.32%
Trimmings, 90% $ per cwt 214.30 213.20 0.52% 216.11 -0.84%
FI Slaughter Thou. Head 2,066 2,145 -3.68% 2,124 -2.74% 16,740 -2.5%
FI Sow Slaughter ** Thou. Head 57.1 55.3 3.29% 56.8 0.54% 332 -0.7%
H Avg. Dressed Weight Lbs. 207.0 207.0 0.00% 209.0 -0.96% 207 -0.7%
O Pork Production Million Lbs. 427.7 444.6 -3.80% 443 -3.45% 3,471 -3.1%
G Iowa-S. Minn. Direct Wtd. Avg. 79.18 83.29 -4.93% 86.55 -8.52%
S Natl. Base Carcass Price Wtd. Avg. 82.40 85.00 -3.06% 85.22 -3.31%
Natl. Net Carcass Price Wtd. Avg. 84.89 87.46 -2.94% 87.73 -3.24%
Pork Cutout 200 Lbs. 81.80 80.88 1.14% 85.76 -4.62%
Hams $ per cwt 63.62 64.18 -0.87% 67.15 -5.26%
Loins $ per cwt 92.36 88.75 4.07% 98.65 -6.38%
Bellies $ per cwt 128.86 128.70 0.12% 115.21 11.85%
72CL Pork Trim $ per cwt 62.00 57.26 8.28% 73.00 -15.07%
C Young Chicken Slaughter * Million Head 151.6 155.0 -2.22% 150.5 0.72% 1,053 1.2%
H Avg. Weight (Live) Lbs. 5.79 5.88 -1.53% 5.70 1.58% 5.83 2.0%
I Chicken Production (RTC) Million Lbs. 667.0 692.8 -3.71% 643.4 3.68% 4,665 4.6%
C Eggs Set Million 198.7 197.0 0.89% 194.7 2.09% 1,379 1.6%
K Chicks Placed Million Head 163.5 162.2 0.81% 161.3 1.38% 1,140 0.9%
E 12-City Broiler Price Composite 101.66 100.96 0.69% 90.5 12.33%
N Georgia Dock Broiler Price 2.5-3 Lbs. 100.39 100.11 0.28% 90.71 10.67%
Northeast Breast, B/S $/cwt 140.92 139.29 1.17% 122.34 15.19%
Northeast Legs $/cwt 68.08 67.64 0.65% 74.35 -8.43%
T Young Turkey Slaughter * Million Head 4.374 4.5 -2.80% 4.252 2.87% 29.207 1.0%
U Avg. Live Weight Lbs. 30.41 30.83 -1.36% 31.86 -4.55% 31.32 -0.9%
R Turkey Production (RTC) Million Lbs. 106.4 111.0 -4.19% 108.3 -1.84% 730 0.0%
K Eastern Region Hen Price 8-16 Lbs. 92.65 95.00 -2.47% 102.00 -9.17%
G Corn, Omaha $ per Bushel 7.15 7.19 -0.56% 6.51 9.83%
R DDGs, Minnesota $ per Ton 254.00 258.50 -1.74% 192.50 31.95%
A Wheat, Kansas City $ per Bushel 7.17 7.41 -3.24% 6.57 9.13%
I Soybeans, S. Iowa $ per Bushel 15.20 14.51 4.76% 12.84 18.38%
N Soybn Meal, 48% Decatur $ per Ton 450.30 422.70 6.53% 332.40 35.47%
* Chicken & turkey slaughter & production are 1 week earlier than the date at the top of this sheet.
** Cow and sow slaughter reflect levels from two weeks ago due to reporting lag.
The Daily Livestock Report is made possible with support from readers like you. If you enjoy reading this report and would like to
sustain it going forward, consider becoming a contributor by going to our website: www.DailyLivestockReport.com
Thank you for your support!