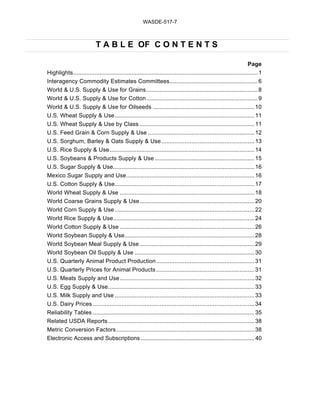
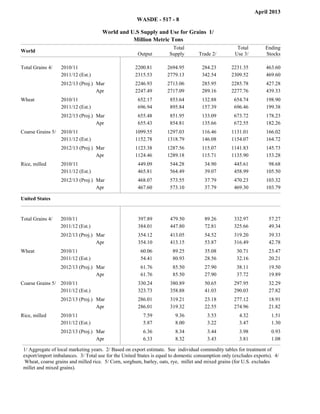
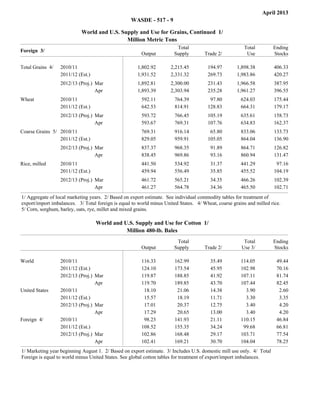
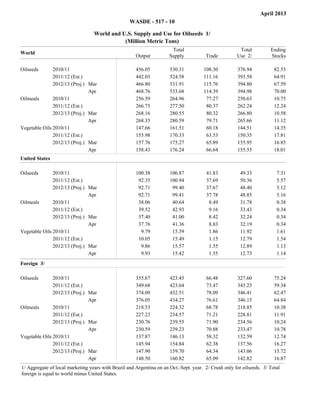
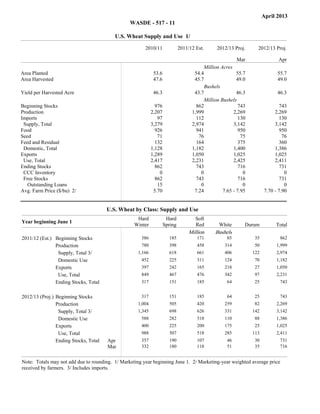
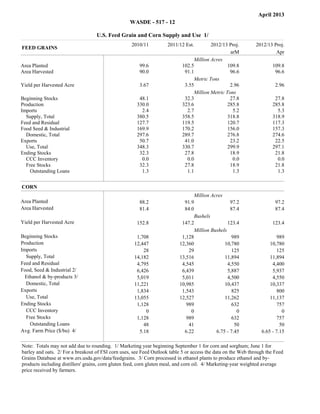
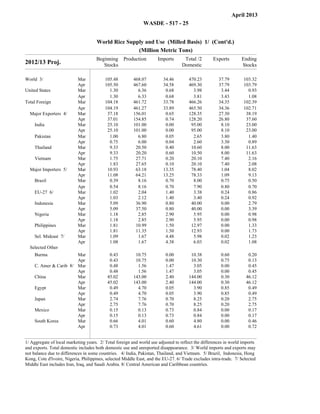
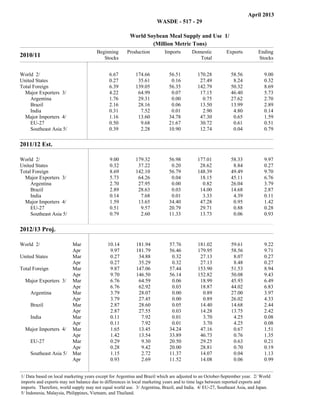
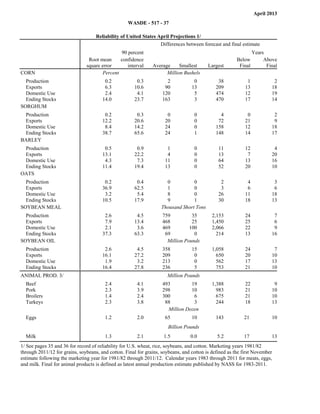
The document provides updates to global agricultural supply and demand estimates for various commodities including wheat, coarse grains, rice, oilseeds, sugar, and cotton for the 2012/13 period. Key points include:
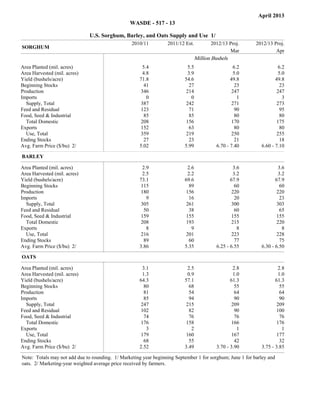
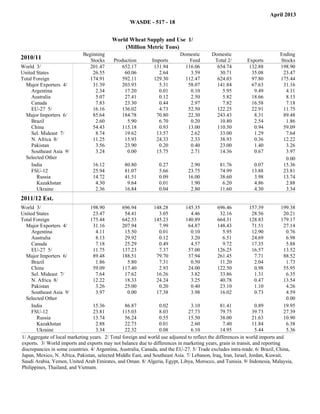
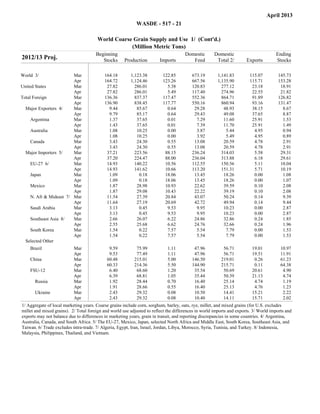
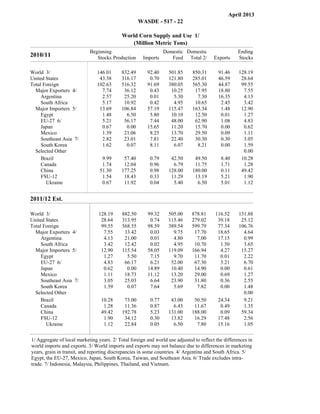
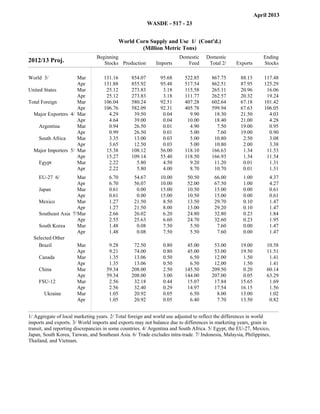
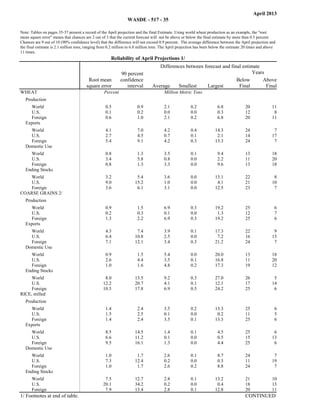
- U.S. wheat ending stocks are projected to be 15 million bushels higher. Global wheat supplies and trade are also projected to increase.
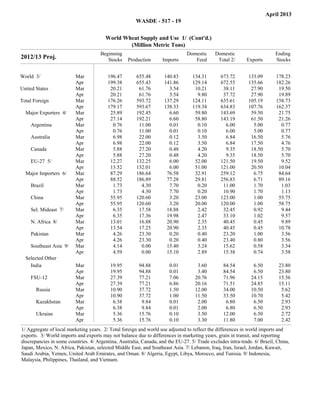
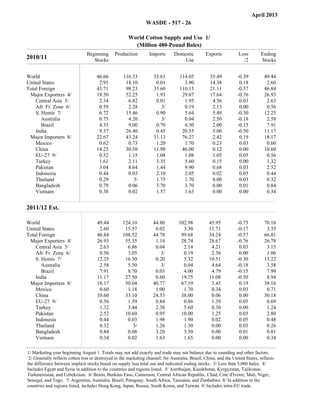
- U.S. coarse grain ending stocks are projected to be higher led by a 125 million bushel increase in corn ending stocks. Global coarse grain production is projected to increase 1.1 million tons.
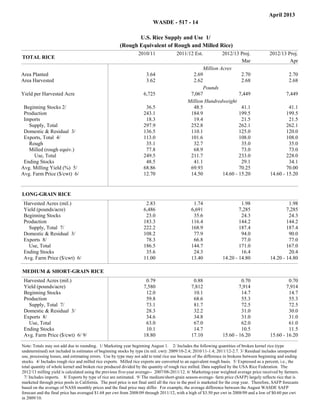
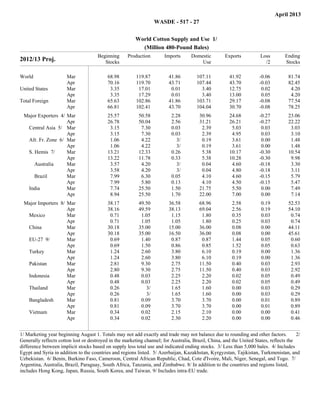
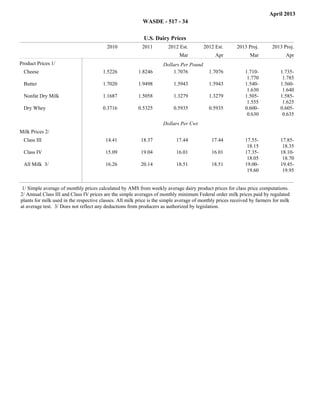
- U.S. rice domestic use is projected to decrease 5 million cwt, increasing ending stocks. Global rice production is projected at


![5G Explained! A High Level Overview [Introduction]](https://cdn.slidesharecdn.com/ss_thumbnails/5gexplainedahighleveloverview-260119165306-cc137a3e-thumbnail.jpg?width=640&height=640&fit=bounds)


