Download as PDF, PPTX
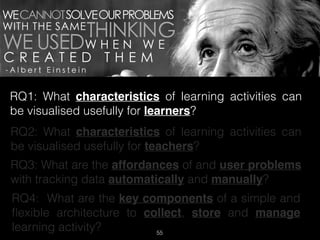
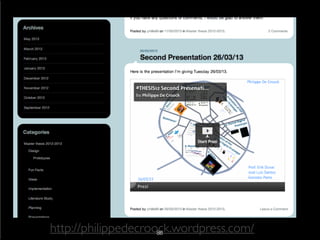
![Learning analytics is the measurement, collection, analysis
and reporting of data about learners and their contexts,
for purposes of understanding and optimising learning and
the environments in which it occurs” - George Siemens [1]
[1] G. Siemens. “Learning analytics: envisioning a research discipline and
a domain of practice”. Proceedings of the 2nd International Conference on
Learning Analytics and Knowledge . ACM. 2012, pp. 4–8.
DEFINITION
page 1 of the thesis text
2](https://image.slidesharecdn.com/publicdefense-151124120110-lva1-app6892/85/Public-PhD-defense-2-320.jpg)


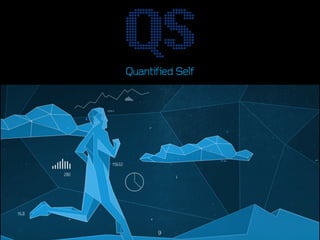


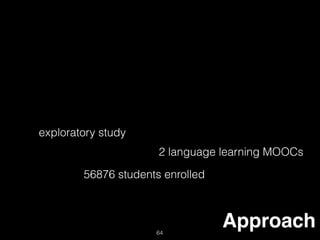
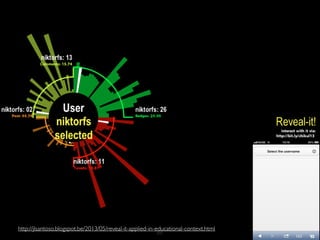
![[3,4]
Time
spent
Artefacts
Produced
Social
Interaction
Resource
use
Exercise/
Test
results
Ch. 2
Ch. 3
Ch. 4
[3] K. Verbert, E. Duval, J. Klerkx, S. Govaerts, and J. L. Santos. “Learning Analytics Dashboard Applications”. In:
American Behavioral Scientist 57.10 (2013), pp. 1500–1509.
[4] K. Verbert, S. Govaerts, E. Duval, J. L. Santos, F. Van Assche, G. Parra, and J. Klerkx. “Learning dashboards: an
overview and future research opportunities”. In: Personal and Ubiquitous Computing 18.6 (2014), pp. 1499–1514.
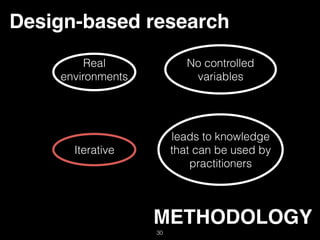
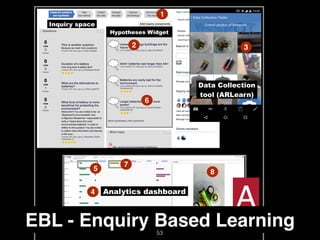
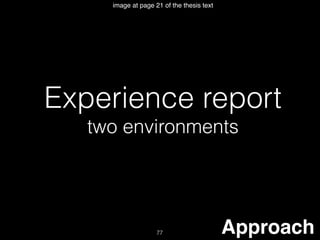
Approach
page 15 of the thesis text
59](https://image.slidesharecdn.com/publicdefense-151124120110-lva1-app6892/85/Public-PhD-defense-59-320.jpg)
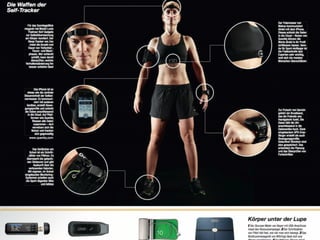
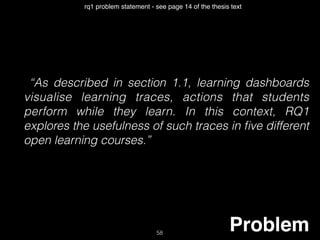
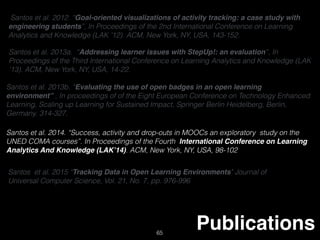
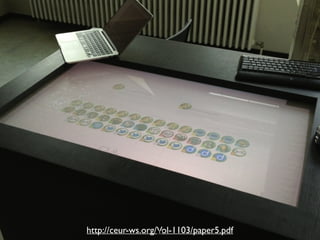
![[3,4]
Time
spent
Artefacts
Produced
Social
Interaction
Resource
use
Exercise/
Test
results
Ch. 2
Ch. 3
Social
activity
Ch. 4
Outcomes
page 16 of the thesis text
61](https://image.slidesharecdn.com/publicdefense-151124120110-lva1-app6892/85/Public-PhD-defense-61-320.jpg)

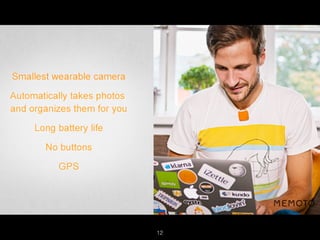
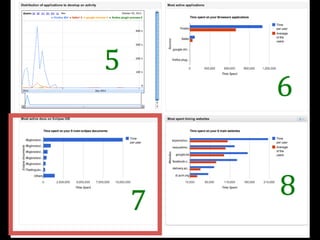
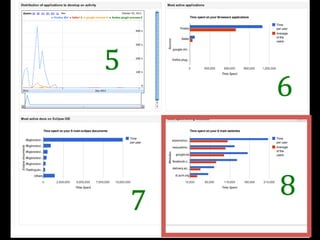
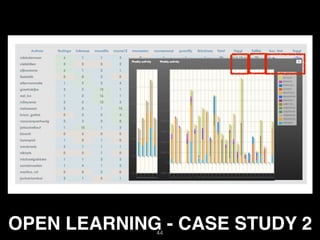
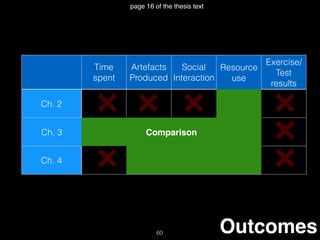
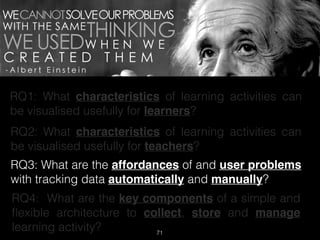
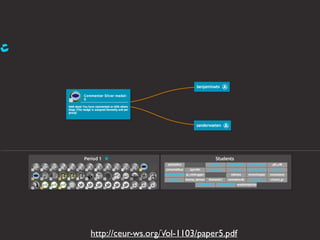
![“Results of our analyses [94, 95] report that
dashboards for teachers are designed to raise
awareness of the activities taking place in the course,
analyse activity and plan interventions, among others.
Related to activity analysis, we explored what
teachers can actually learn from visualisations.”
Problem66
rq2 problem statement - see page 17 of the thesis text](https://image.slidesharecdn.com/publicdefense-151124120110-lva1-app6892/85/Public-PhD-defense-66-320.jpg)
![Time
spent
Artefacts
Produced
Social
Interaction
Resource
use
Exercise/
Test
results
Drop-outs
[5,6,7]
Language use
[8]
Social
interaction [9]
[5] C. Alario-Hoyos et al. “Analysing the Impact of Built-In and External Social Tools in a MOOC on Educational Technologies”. In: ECTEL’13 . Vol. 8095. LNCS. Springer, 2013, pp. 5–18.
[6] D. Clow. “MOOCs and the funnel of participation”. In: Proceedings of the Third International Conference on Learning Analytics and Knowledge. LAK ’13. ACM, 2013, pp. 185–189.
[7] H. Spoelstra et al. “Team formation instruments to enhance learner interactions in open learning environments”. In: Computers in Human Behavior 45 (2015), pp. 11–20.
[8] P. Levy. “Technology-Supported Design for Inquiry-Based Learning”. In: Exploring Learning & Teaching in Higher Education . Springer, 2015, pp. 289–304.
[9] N. Michinov et al. “Procrastination, participation, and performance in online learning environments”. In: Computers & Education 56.1 (Jan. 2011), pp. 243–252.
67
Approach
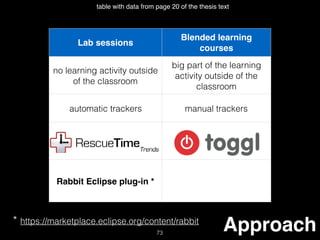
table with data from page 17 and chapter 5 of the thesis text](https://image.slidesharecdn.com/publicdefense-151124120110-lva1-app6892/85/Public-PhD-defense-67-320.jpg)
![Time
spent
Artefacts
Produced
Social
Interaction
Resource
use
Exercise/
Test
results
Drop-outs
[5,6,7]
attention to the first units of the lessons
Language use
[8]
Social
interaction [9]
68
Outcome
table with data from page 18 of the thesis text](https://image.slidesharecdn.com/publicdefense-151124120110-lva1-app6892/85/Public-PhD-defense-68-320.jpg)
![Time
spent
Artefacts
Produced
Social
Interaction
Resource
use
Exercise/
Test
results
Drop-outs
[5,6,7]
attention to the first units of the lessons
Language use
[8]
? ?
Social
interaction [9]
69
Outcome
table with data from page 18 of the thesis text](https://image.slidesharecdn.com/publicdefense-151124120110-lva1-app6892/85/Public-PhD-defense-69-320.jpg)
![Time
spent
Artefacts
Produced
Social
Interaction
Resource
use
Exercise/
Test
results
Drop-outs
[5,6,7]
attention to the first units of the lessons
Language use
[8]
? ?
Social
interaction [9]
70
Outcome
table with data from page 18 of the thesis text
thresholds thresholds](https://image.slidesharecdn.com/publicdefense-151124120110-lva1-app6892/85/Public-PhD-defense-70-320.jpg)
![“Therefore, we consider relevant to evaluate how
students perceived automatic and manual trackers.”
Problem72
rq3 problem statement - see page 19 of the thesis text
Manual Automatic
PROS Privacy tracking fatigue [10]
CONTRAS tracking fatigue [10] Privacy
[10] E. K. Choe, N. B. Lee, B. Lee, W. Pratt, and J. A. Kientz. “Understanding quantified-selfers’ practices in collecting and exploring personal data”. In:
Proceedings of the 32nd annual ACM conference on Human factors in computing systems . ACM. 2014, pp. 1143–1152.](https://image.slidesharecdn.com/publicdefense-151124120110-lva1-app6892/85/Public-PhD-defense-72-320.jpg)

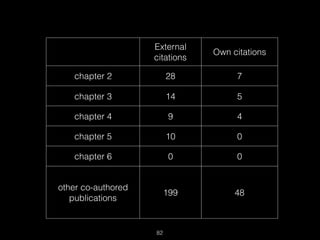


The document presents a comprehensive examination of learning analytics and learning dashboards from a Human-Computer Interaction (HCI) perspective, highlighting their potential to optimize learning environments. It addresses key research questions regarding the visualization of learning activities for both learners and teachers, as well as methodologies for tracking and managing data associated with these activities. The study is informed by various case studies and publications that demonstrate the applications and implications of learning dashboards in educational settings.


![[Extended] Bottom-up growth of learning analytics at two Australian universit...](https://cdn.slidesharecdn.com/ss_thumbnails/bottom-upgrowthofla-160416081432-thumbnail.jpg?width=640&height=640&fit=bounds)


![[DSC Europe 25] Ekaterina Bubenko - Behind the Curtain: How Data Roles Collab...](https://cdn.slidesharecdn.com/ss_thumbnails/anmv6x8dstqbbzchoklr-ekaterina-bubenko-behind-the-curtain-how-data-roles-collaborate-in-the-ai-era-a-260123083019-4b252ec7-thumbnail.jpg?width=640&height=640&fit=bounds)


![[DSC Europe 25] Milos Belcevic - Product Professional's Journey to Full-Stack...](https://cdn.slidesharecdn.com/ss_thumbnails/1zovd6fgsycdg4wvgvls-milos-belcevic-product-professionals-journey-to-full-stack-product-developer-260123083019-d993120d-thumbnail.jpg?width=640&height=640&fit=bounds)


![[DSC Europe 25] Josip Saban - Career building for data professionals.pptx](https://cdn.slidesharecdn.com/ss_thumbnails/zroflcttkm1vmli0txea-josip-saban-career-building-for-data-professionals-260123083019-587cdb8c-thumbnail.jpg?width=640&height=640&fit=bounds)
