4. Level Of service = C
PresentLevel of service =C
The capacity to be designedforthe proposedroadsectionisfor20 years.The relevantcalculations
are as follows.
Road note 31
Assumingthree wheelers,Bicycle andMotorbikesasService vehicle and Trucks and buses as Heavy
goods vehicles
Vehicle type Growth Rate
PC (Service
vehicle)
5%
Bus (Large buses) 4%
Truck (Multi axle) 7%
Three-wheeler 3.5%
Motorbike 3.5%
Bicycle 3.5%
Vehicle type Growth Rate
PC (Service vehicle) 5%
Bus (Large buses) 4%
Trucks (Multi axle) 7%
Three-wheeler 3.5%
Motorbike 3.5%
Bicycle 3.5%
Vehicle type Available percentage
Personal cars 8.765%
buses 4.250%
Trucks 4.781%
Three wheelers 51.129%
Bicycle 14.210%
Motor bikes 16.866%
5. Vehicle type Maximum vehicle flow in 1 hour after 20 years
Personal cars 753×
8.765
100
×(1.050)20
=175.119
buses 753×
4.250
100
×(1.040)20
=70.121, 93.376
Trucks 753×
4.781
100
×(1.07)20
=139.31, 105.042
Three wheelers 753×
51.129
100
×(1.035)20
=766.071, 1021.523
Bicycle 753×
14.21
100
×(1.035)20
=212.91, 283.906
Motor bikes 753×
16.866
100
×(1.035)20
=252.705, 336.971
Total maximum vehicle flow in 1 hour after 20 years (V) =1616.236, 2015.937
Vehicle type Maximum vehicle flow in 15minutes after 20
years
Personal cars 229×
8.765
100
×(1.050)20
=53.257
buses 229×
4.250
100
×(1.040)20
=21.325
Trucks 229×
4.781
100
×(1.07)20
=42.367
Three wheelers 229×
51.129
100
×(1.035)20
=232.975
Bicycle 229×
14.21
100
×(1.035)20
=64.75
Motor bikes 229×
16.866
100
×(1.035)20
=76.852
Total maximum vehicle flow in 15minutes after 20 years (V 15,max) =491.526, 613.081
Percent time spent following Mean speed
V = 1616.236,2015.937
V 15,max = =491.526,613.081
𝑽 𝒑 =
𝑽
𝑷𝑯𝑭∗𝑭 𝑮∗𝒇 𝑯𝑽
(20-3) [4]
8. Geometric design
1. Horizontal alignment design
For the convenience of designing,the bendlocatedatthe edge of the designedsectionof roadis
selected.The horizontal curve designforthatsectioniscarriedout as follows:
Assumption-The average speed is 50 km/h
V = 50 km/h
Figure 2. Horizontal curve
𝑹 𝒎𝒊𝒏 =
𝒗 𝟐
𝟏𝟐𝟕 ( 𝒆 𝒎𝒂𝒙 + 𝒇 𝐦𝐚𝐱)
For flatterrainand builtupareas,
Emax = 6%
Fmax = 0.16
𝑅 𝑚𝑖𝑛 =
502
127 (0.06 + 0.16)
= 89.48 𝑚
From figure 5,
9. r = 3.4cm
Accordingto the map scale,5cm = 212ft (1cm = 42.4ft)
1 ft= 0.304m
r = 3.4 * 42.4 *0.304
=44m
Whenv = 36km/h(limitingspeed=36 km/h)
𝑅 𝑚𝑖𝑛 =
362
127 (0.06 + 0.17)
= 44.37 𝑚
∆s = 79°Rv = 44.37m
𝑆𝑆𝐷 =
𝜋
180
∗ 𝑅𝑣 ∗ ∆𝑠
=
𝜋
180
∗ 44.37 ∗ 79 = 61.18𝑚
𝑀𝑠 = 𝑅𝑣[ 1 − cos
90 𝑆𝑆𝐷
𝜋 ∗ 𝑅𝑣
].
𝑀𝑠 = 44.37[ 1 − cos
90 ∗ 61.18
𝜋 ∗ 44.37
] =10.13 𝑚
M actual = 0.8 * 42.4 * 0.304 = 10.31 m
The projectdoesnot mentionaclearrestrictionof cost.Therefore areductionof the landacquisition
by payinga previouslyestimatedcompensationtothe relevantlandownerscanbe suggested.
10. 2. Vertical alignment design
It isa mustto carry out a vertical alignmentdesigntoensure properdrainage inthe areaand
acceptable levelof safetythatisintegratedwithvertical alignment.
By carryingout site visititwasconcludedthatthe consideredroadsectionhasa vertical profileof a
crest vertical curve.
For the convenience of the calculation, the elevation of the relevant area was assumed as
10m.
Figure 3. Vertical alignment profile
Figure 4. Vertical curve
G1 =
10
√1102−102
∗ 100% = +9.13%
11. G2 =
10
√2902−102
∗ 100% = −3.45%
L = 109.55 + 289.83 = 399.38 m
𝑺𝑺𝑫 = 𝑽 ∗ 𝒕𝑹 +
𝑽 𝟐
𝟐(𝒂+𝑮∗𝒈)
[5]
V = 25 km/h
a = 3.4 m/s
t R= 2.5s
𝑆𝑆𝐷 = 25∗
1000
3600
∗ 2.5+
(25∗
1000
3600
)
2
2(3.4+9.8∗0.0913)
= 36.34 m
SSD < L (399.38m)
Figure 5. Stopping side distance consideration for vertical crest curve [3]
Source:http://safety.fhwa.dot.gov/speedmgt/ref_mats/fhwasa10001/images/Fig2.gif
Figure 6. Vertical crest curve [3]
Source:http://www.tc.umn.edu/~cliao/ROAD/javahelp/Images/crest_curve.jpg
A = | G1 - G2|[5]
12. = |9.13 - (-3.45)|= 12.58
WhenSSD < L,
L = 𝑨 ∗
𝐒𝐒𝐃 𝟐
𝟐𝟎𝟎 (√ 𝐡𝟏+√ 𝐡𝟐)
𝟐[5]
h1 = driver'seye height=0.6m (assumed)
h2 = tail lightheight= 0.3m (assumed)
399.38 = 12.58 * SSD2
/[200(√0.6 + √0.3)
2
]
SSD = 105.37m
L actual = 47.5 m (fromthe map)
Hence,the designisok.
PAVEMENT DESIGN
(Overseas Road note 31- ESA factors)
Vehicle type ESA factor
Cars (Service vehicles) 1.88
Buses(Large buses) 0.3
Trucks (Multi axle) 0.13
the followingESA factorswere calculatedusingthe below formulaextractedfrom Guide linesfor
capacityof roads inrural areas-Indianroadcongressguide lines.
ESA factor=
𝐴𝑥𝑙𝑒 𝐿𝑜𝑎𝑑 (𝑘𝑔)
8160
⁄
4.5
(Guide linesforcapacityof roadsin rural areas-Indianroadcongressguide lines-- ESA factors)
Vehicle type ESA factor
Three wheelers 4.16×10⁻⁶
Motor bikes 1.54×10⁻⁷
Bicycles 9.147×10⁻⁷
13. The following is a conservative pavement design. Therefore the four lane road to be
designed is designed as a combination of 2 two lane roads.
Therefore the following maximumhourlyflow isconsideredtobe half of the maximumhourly
flowsgainedbythe survey.
Vehicle type Maximumhourlyflow
Personal cars 33
Bus 16
Trucks 18
Three wheelers 192.5
Bicycle 53.5
Motor bikes 63.5
Vehicle type Numberof
vehiclesintwo
lanesonly.
ESA factor Growth Rate ρi(StandardAxle
Load perday)
PC (Service
vehicle)
33 1.88 5% 992.64
Bus (Large buses) 16 0.3 4% 76.8
Truck (Multi axle) 18 0.013 7% 3.744
Three-wheeler 192.5 4.16*10-6
3.5% 0.0128
Motorbike 53.5 1.54*10-7
3.5% 1.318*10-4
Bicycle 63.5 9.147*10-7
3.5% 9.293*10-4
Pi(Cars/SV)=33×16×1.88=992.64
Pi(Bus/LB)=16×16×0.3=76.8
Pi(Trucks/MA)=18×16×0.013=3.744
Pi(Three wheeler)=192.5×16×4.16×10-6
=0.0128
Pi(Motor bike)=53.5×16×1.54×10-7
=1.318*10-4
14. Pi(Bicycle)=63.5×16×9.147*10-7
=9.293*10-4
A=365 ∑ 𝑃𝑖((1 + 𝑟𝑖) 𝑛𝑚
𝑖=1 − 1)/𝑟𝑖
n=20 (20 Year designlife of road)
m=6 (6 Typesof vehicles)
Vehicle type A
PC 11.98×10⁶
Bus 0.835×10⁶
Truck 0.056×10⁶
Three-wheeler 0.0000132×10⁶
Motorbike 0.000001×10⁶
Bicycle 0.0000096×10⁶
Total 12.8710238×10⁶
A (Cars/SV) =365{
992.64[(1+0.05)20−1]
0.05
}=11.98×10⁶
A (Bus/LB) =365{
76.8[(1+0.04)20−1]
0.04
}=0.835×10⁶
A (Trucks/MA) =365{
3.744[(1+0.07)20−1]
0.07
}=0.056×10⁶
A (Three wheeler) =365{
0.0128[(1+0.035)20−1]
0.035
}=0.0000132×10⁶
A (Motor bike) =365{
1.318×10⁻⁴[(1+0.035)20−1]
0.035
}=0.000001×10⁶
A (Bicycle) =365{
9.293×10⁻⁴[(1+0.035)20−1]
0.035
}=0.0000096×10⁶
From table 2.2 -OVERSEASROADNOTE 31(4th
EDITION)
Total A = 12.8710238×10⁶
, thisisclassifiedasTrafficclass 7 (T7)
CBR value is20
15. Sub grade strength class S5
CHART 2 COMPOSITE ROAD BASE (UNBOUND & CEMENTED) / SURFACE DRESSING
(Overseas Road note 31)

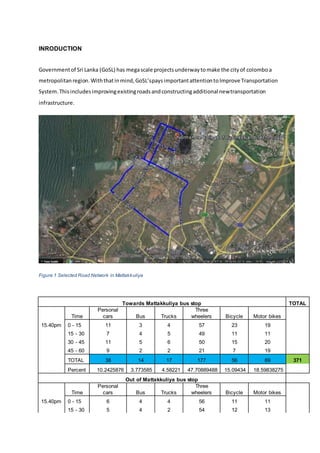
![30 - 45 12 5 10 52 12 21
45 - 60 5 5 3 46 16 13
TOTAL 28 18 19 208 51 58 382
Percent 7.329842932 4.712042 4.973822 54.45026178 13.35079 15.18324607 753
Table 3. Traffic data Collected
The capacity design of the considered section of the road for the present conditions can be
carried out as below
Percent time spent following Mean speed
V 15,max = 117+ 112 = 229
V 15,max = maximum volume within 15 minutes
V = 753 veh/hour
V = Demand volume for the full peak hour
𝑽 𝒑 =
𝑽
𝑷𝑯𝑭 ∗ 𝑭 𝑮 ∗ 𝒇 𝑯𝑽
(20-3)[4]
𝐕 𝐩 = 𝐩𝐚𝐬𝐬𝐞𝐧𝐠𝐞𝐫 𝐜𝐚𝐫 𝐞𝐪𝐮𝐢𝐯𝐚𝐥𝐞𝐧𝐭 𝐟𝐥𝐨𝐰 𝐟𝐨𝐫 𝟏𝟓 𝐦𝐢𝐧 𝐩𝐞𝐫𝐢𝐨𝐝 𝐩𝐜/𝐡)
𝑷𝑯𝑭 =
𝑽
𝑽 𝟏𝟓 ∗ 𝟒
=
𝟕𝟓𝟑
𝟐𝟐𝟗∗𝟒
= 0.822
PHF = peak hour factor
𝒇 𝑯𝑽 =
𝟏
𝟏+𝑷 𝑻 (𝑬 𝑻−𝟏)+𝑷 𝑹 (𝑬 𝑹−𝟏)
(20-4)[4]
f HV = heavy vehiclefactor
Assuming :600<Vp<1200
ET = 1.1
ER = 1.0
FG = 1(Terrain = level)
(Exhibit 20-10)[4]
Assuming:600<Vp<1200
ET = 1.2
ER = 1.0
FG = 1(Terrain=level)
(Exhibit20-9)[4]](data:image/gif;base64,R0lGODlhAQABAIAAAAAAAP///yH5BAEAAAAALAAAAAABAAEAAAIBRAA7)