Downloaded 1,498 times


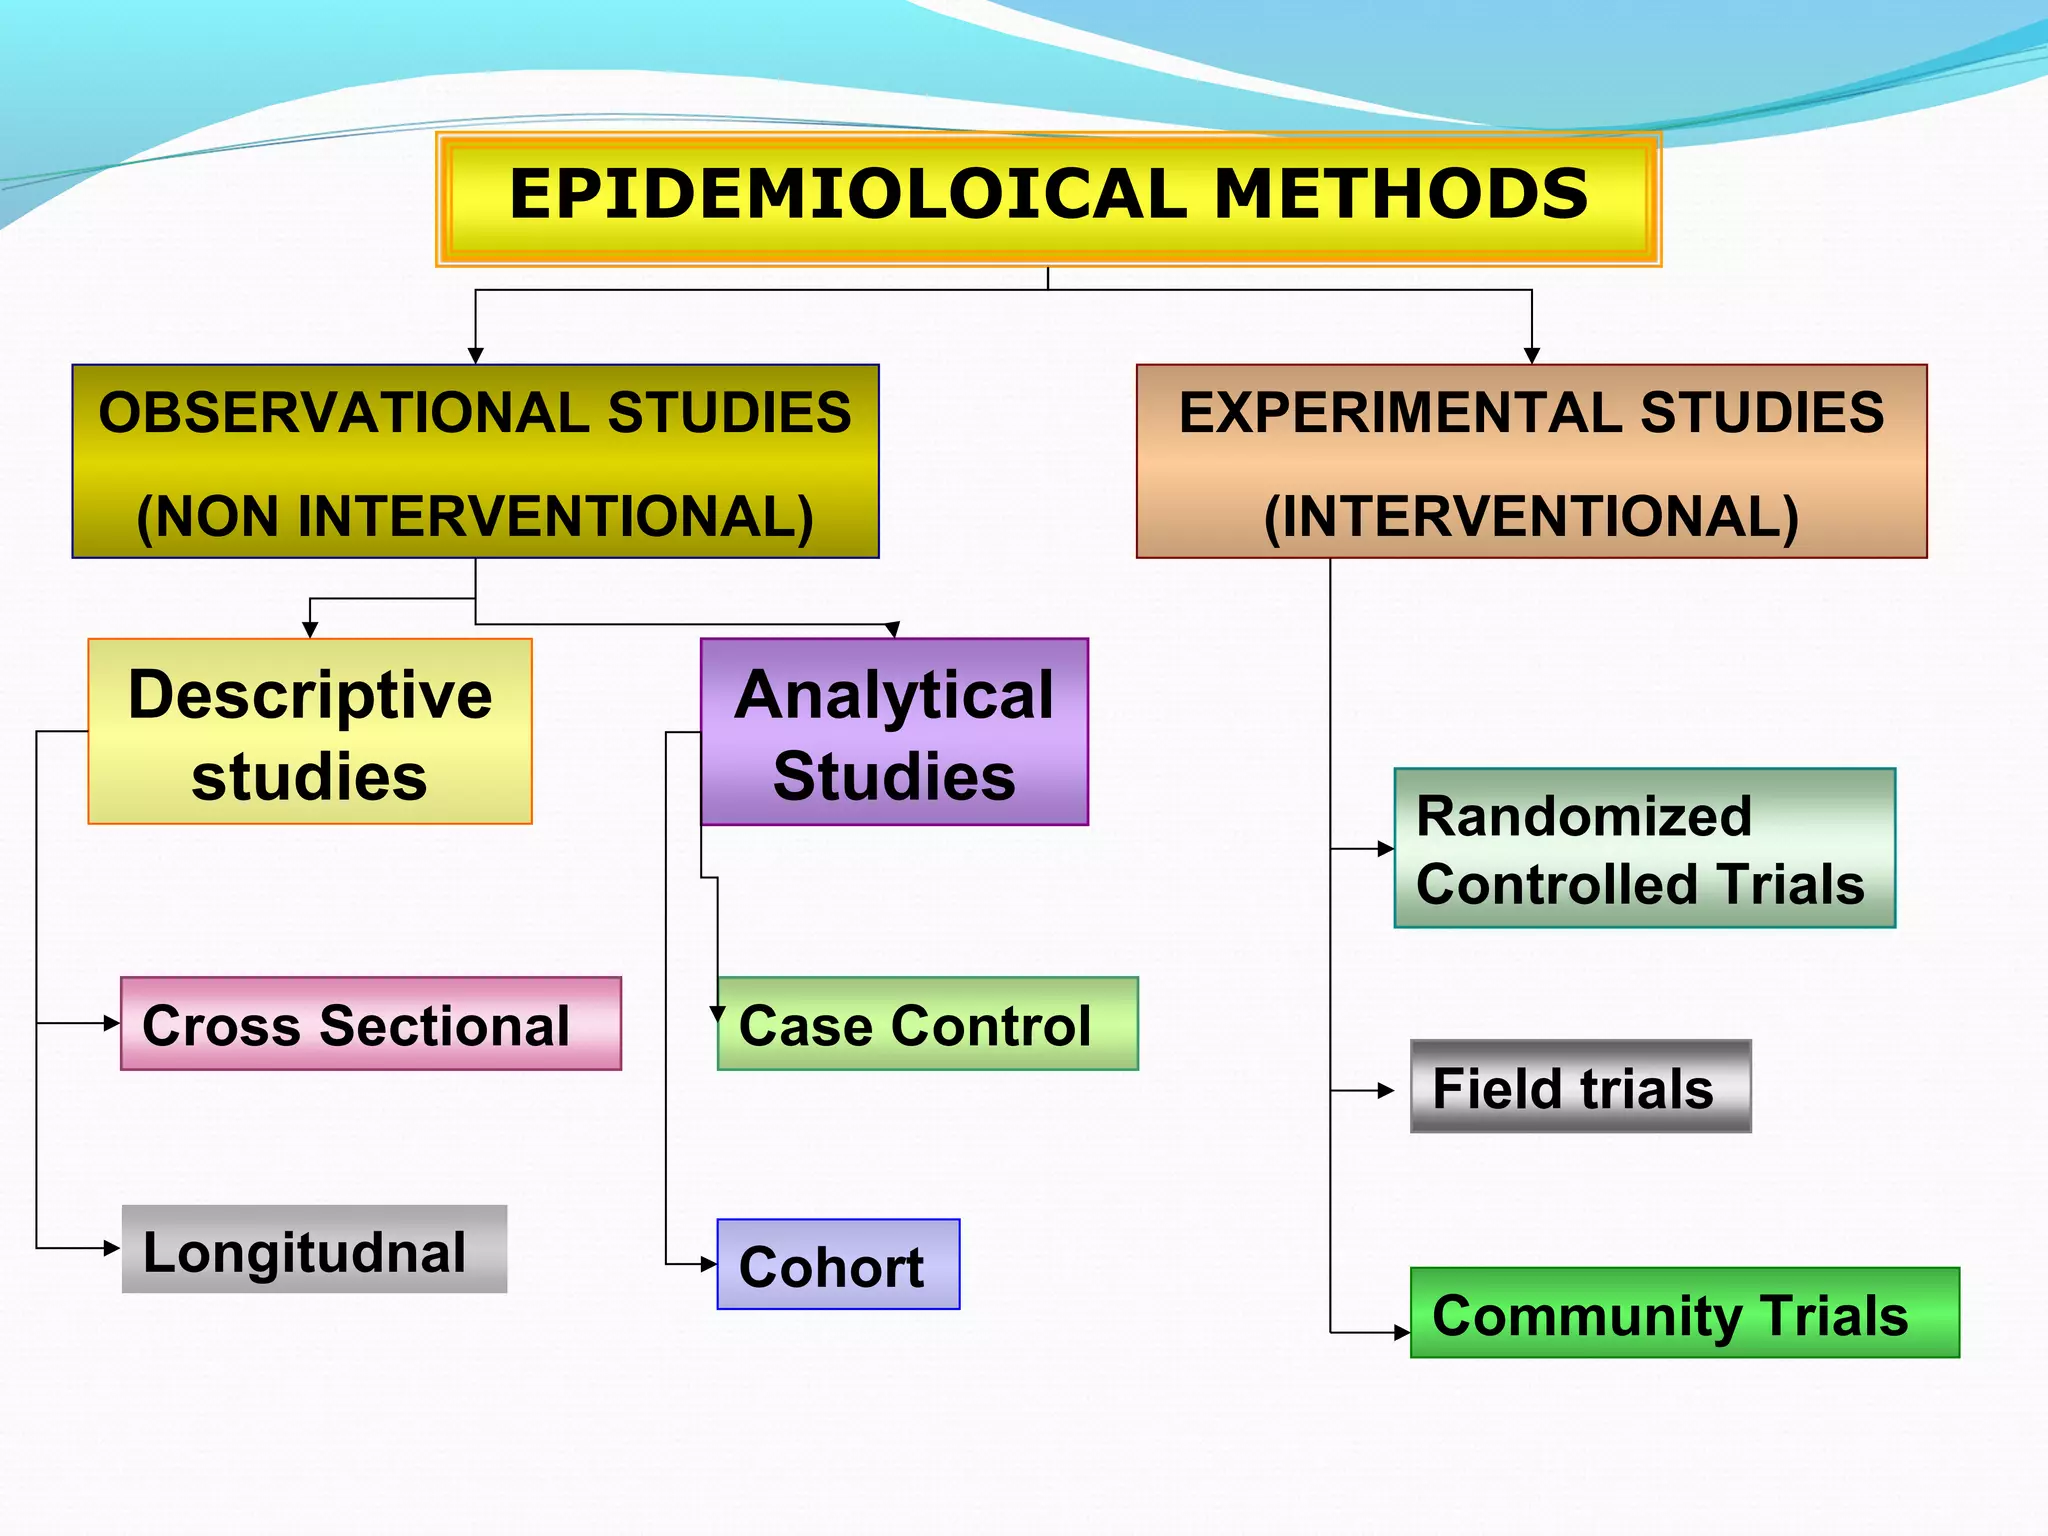
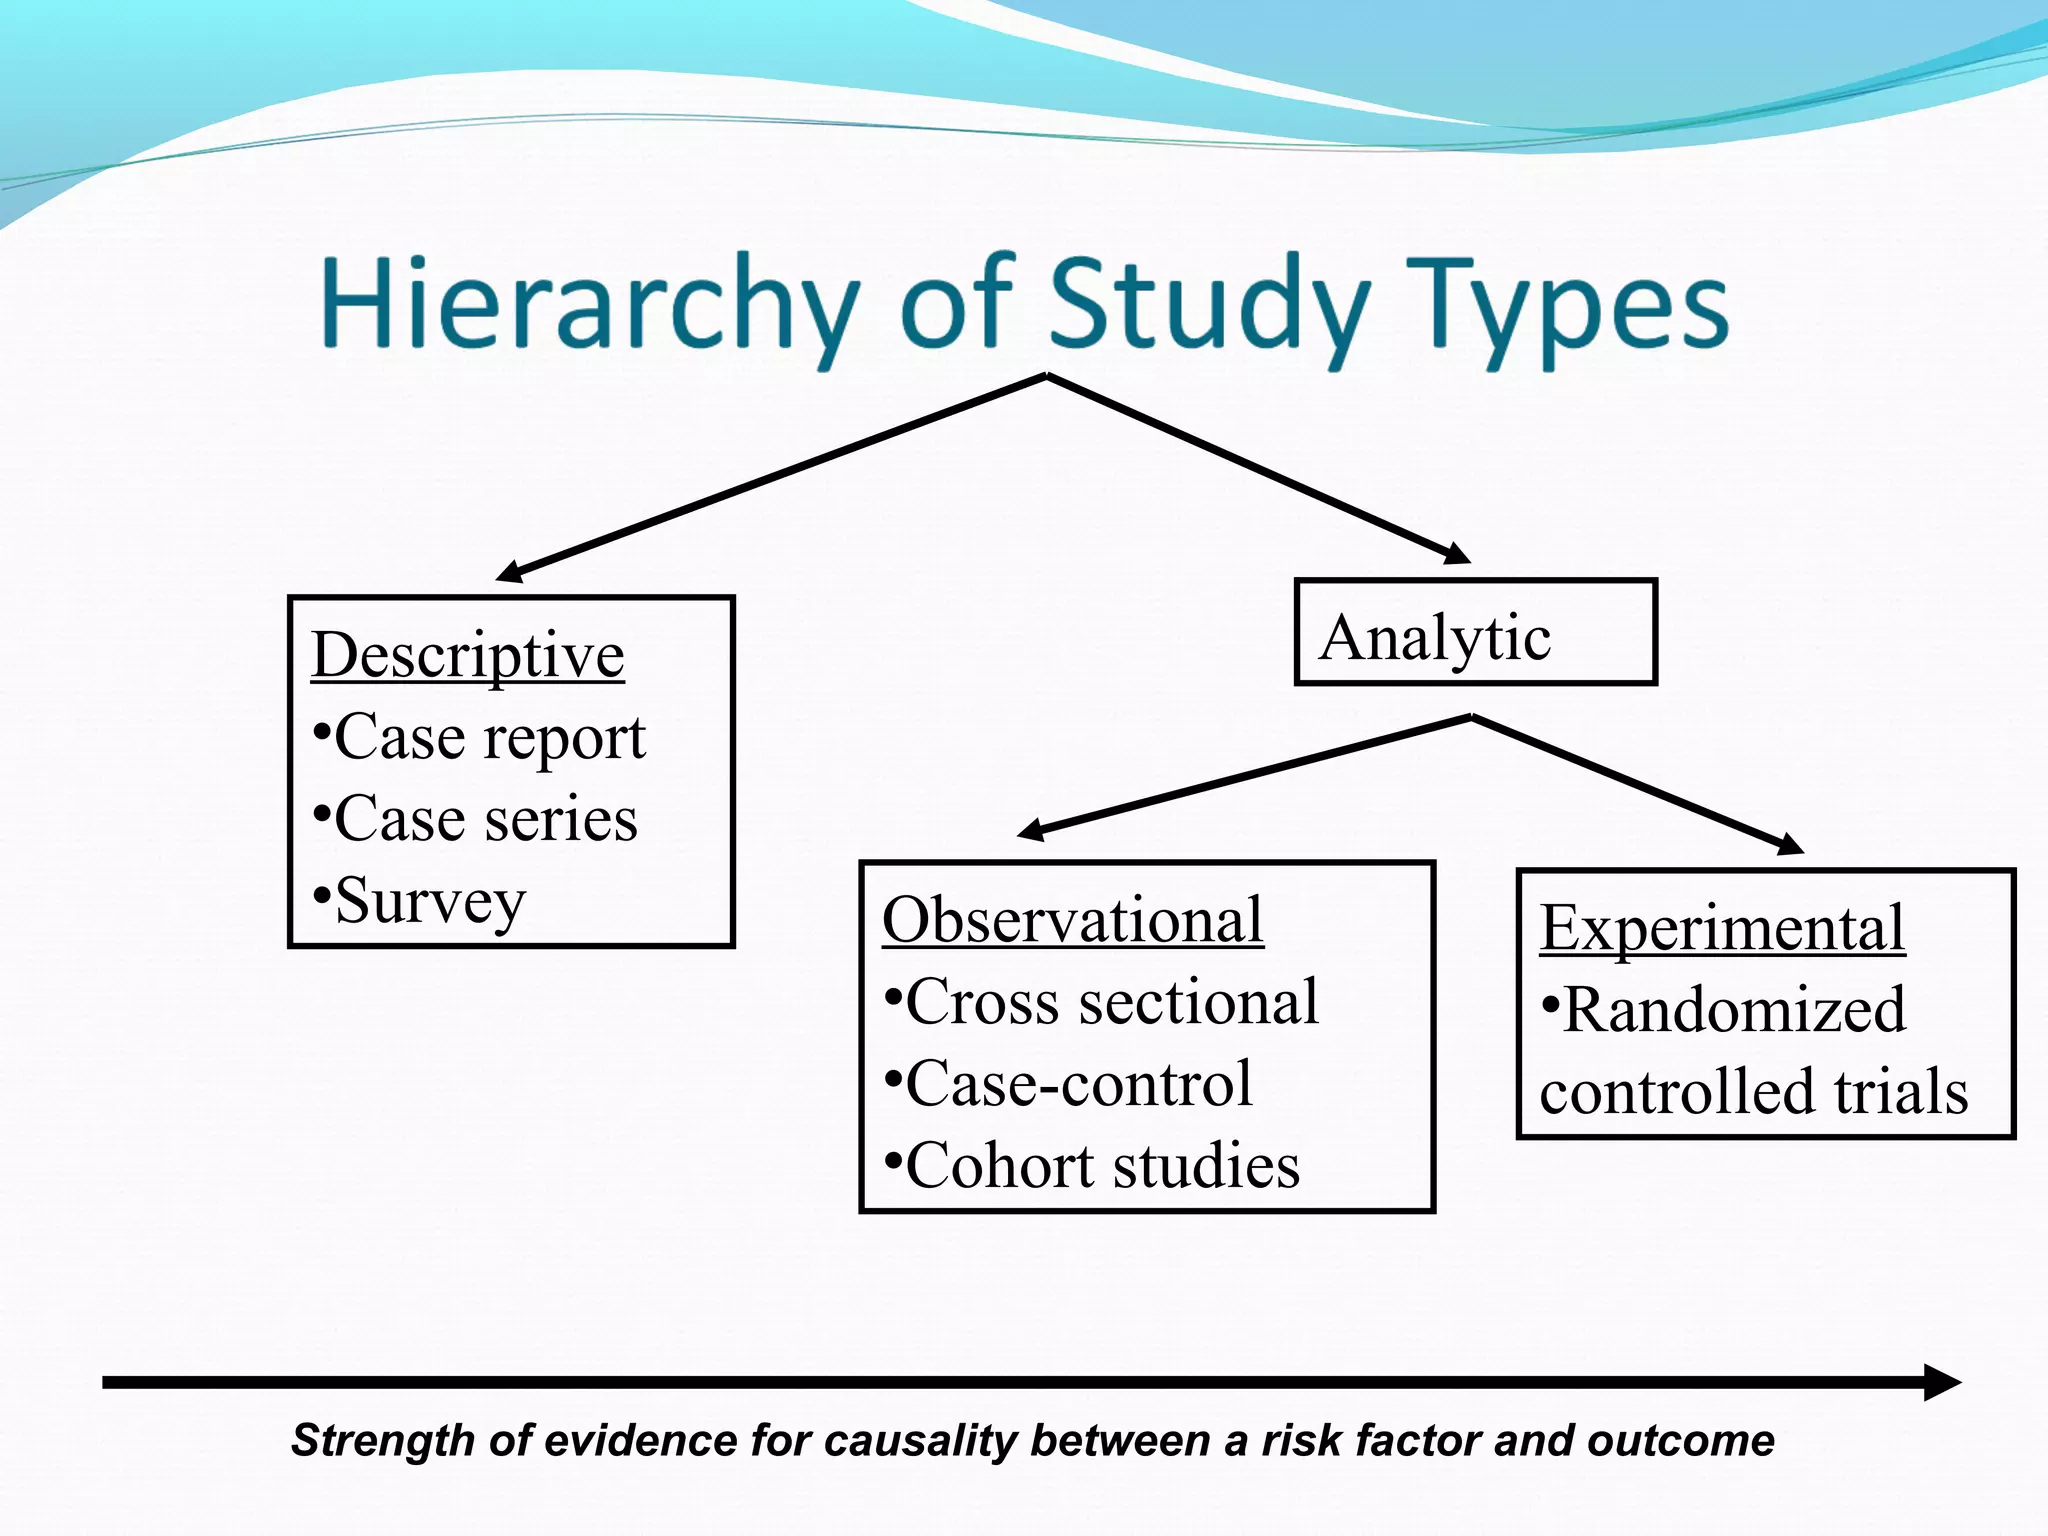


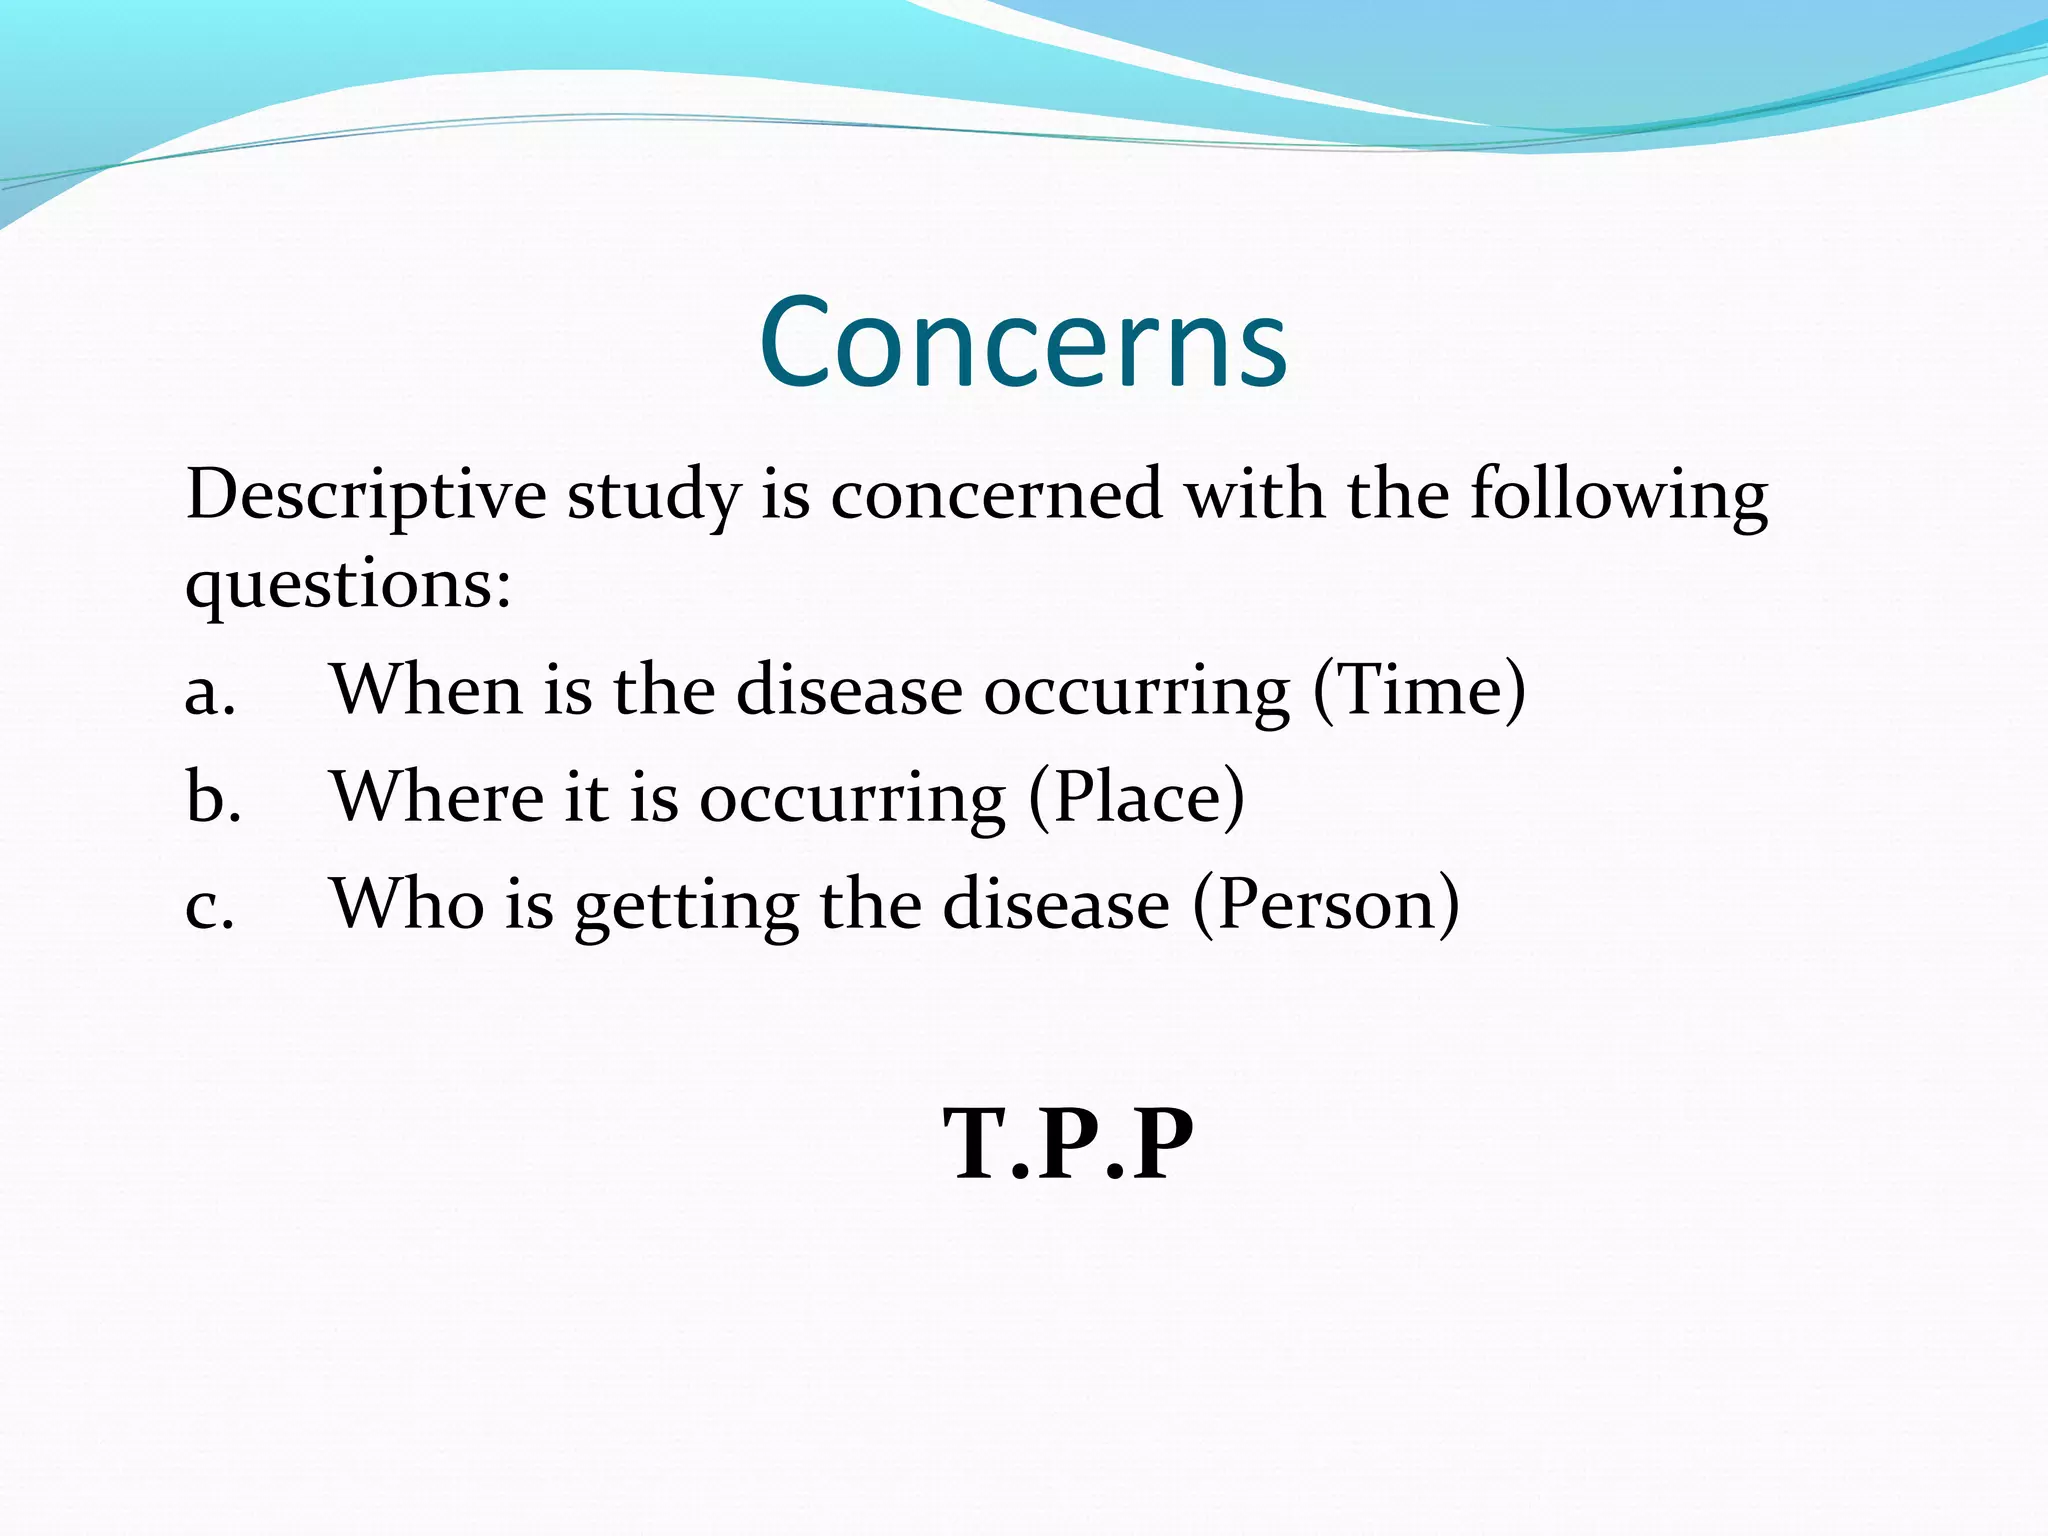


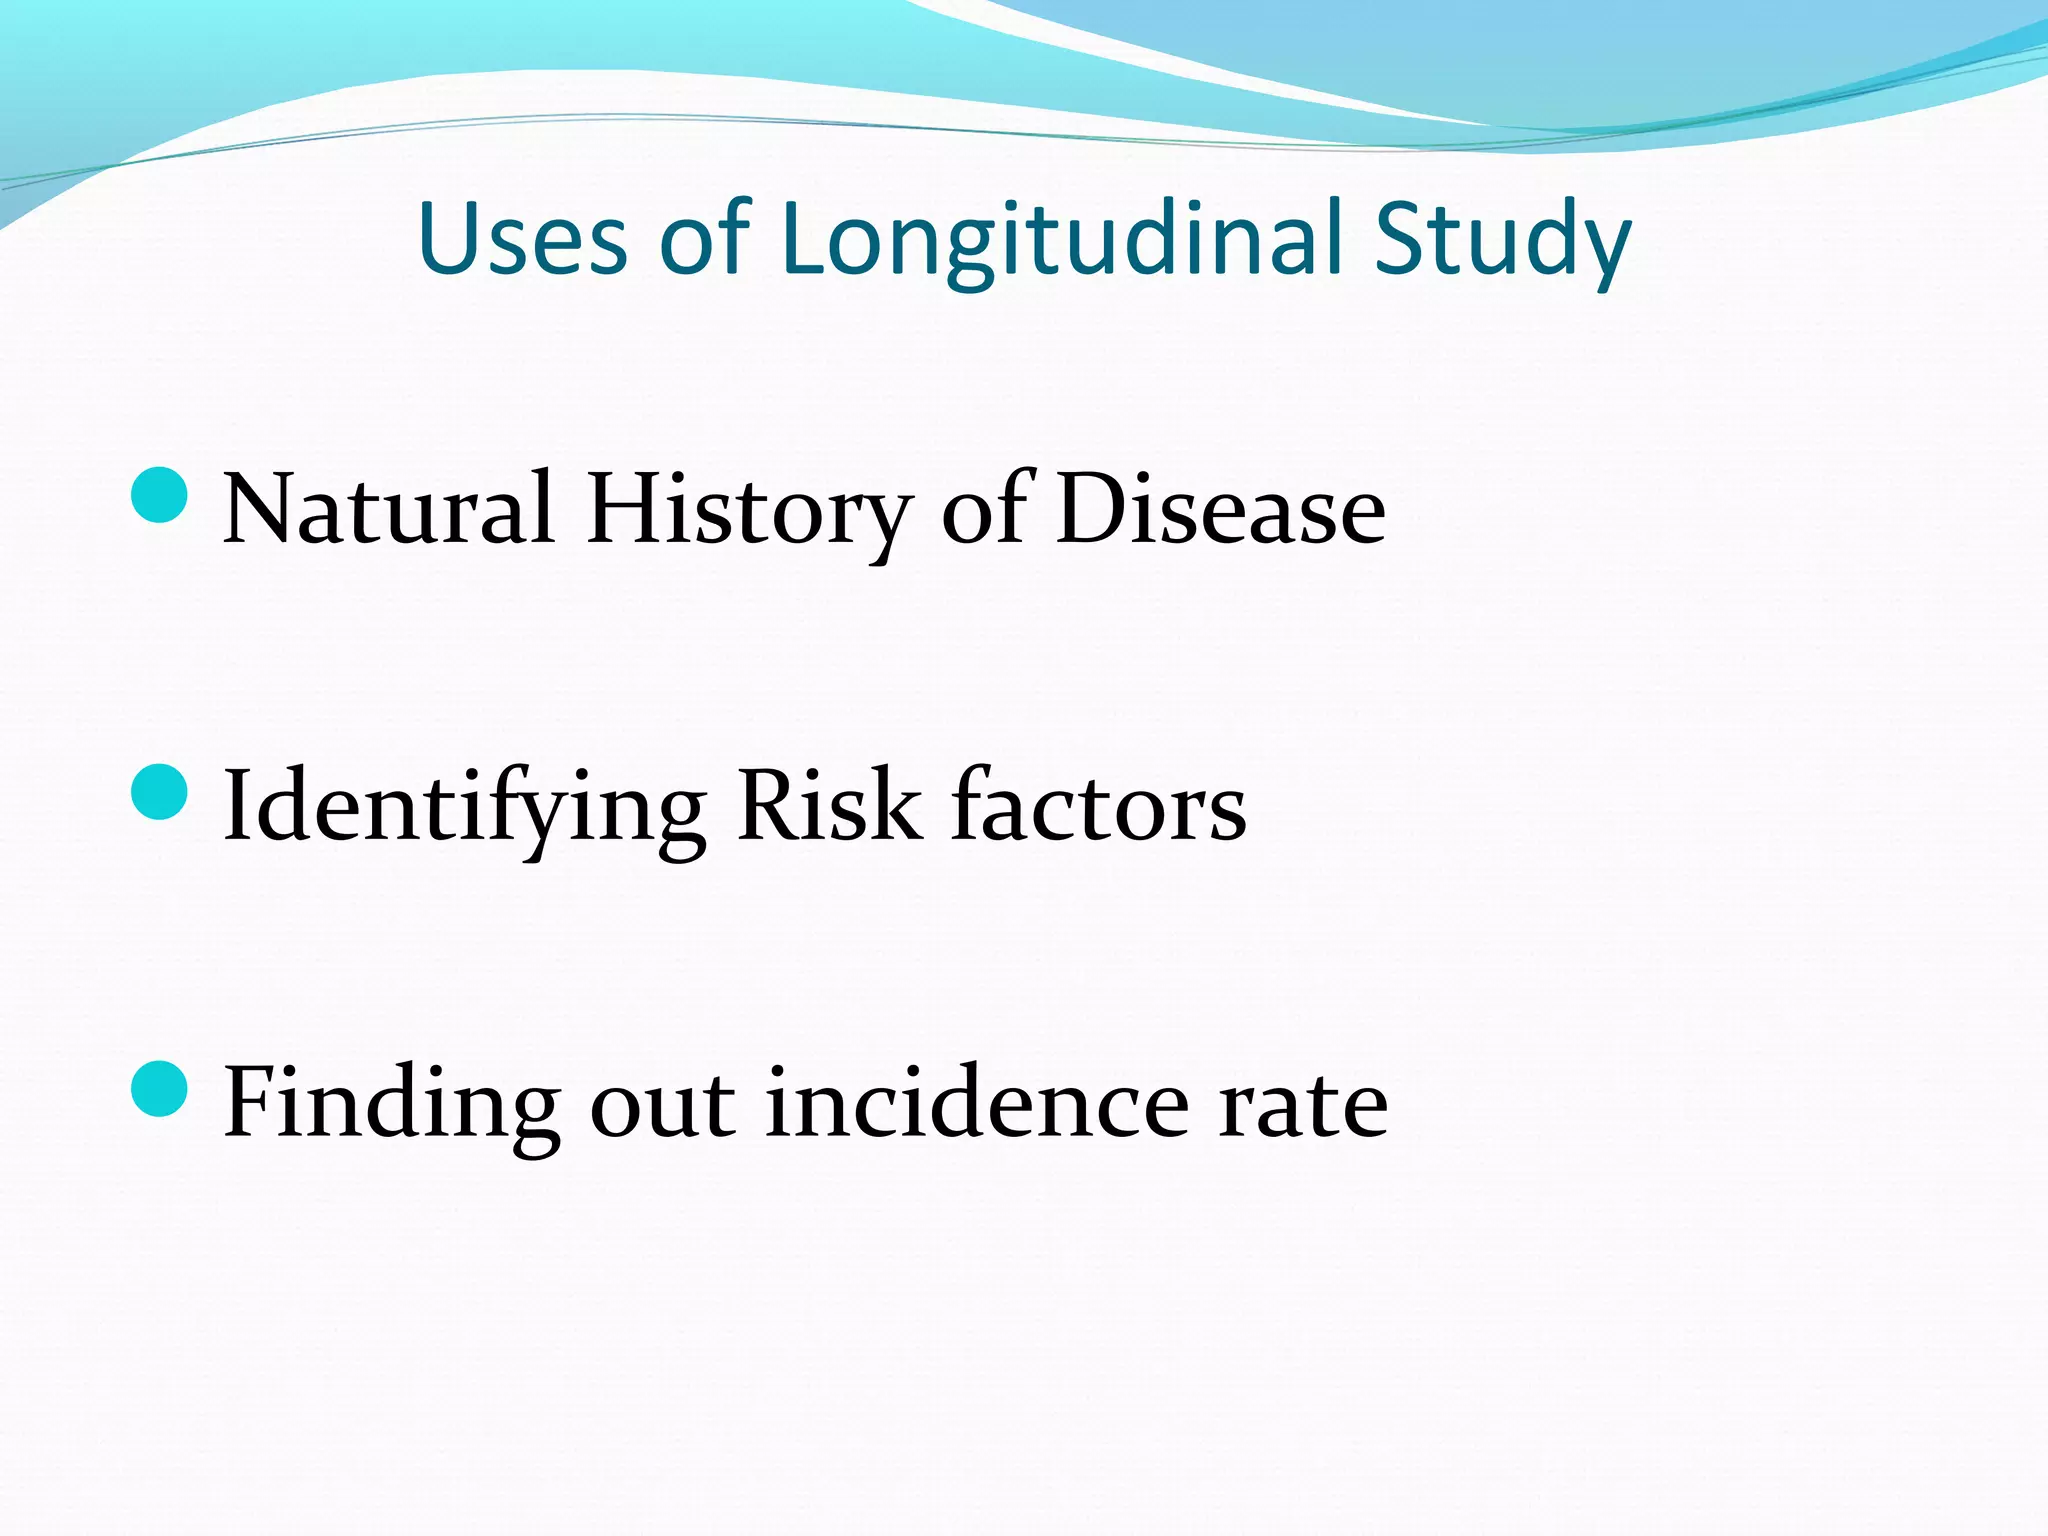


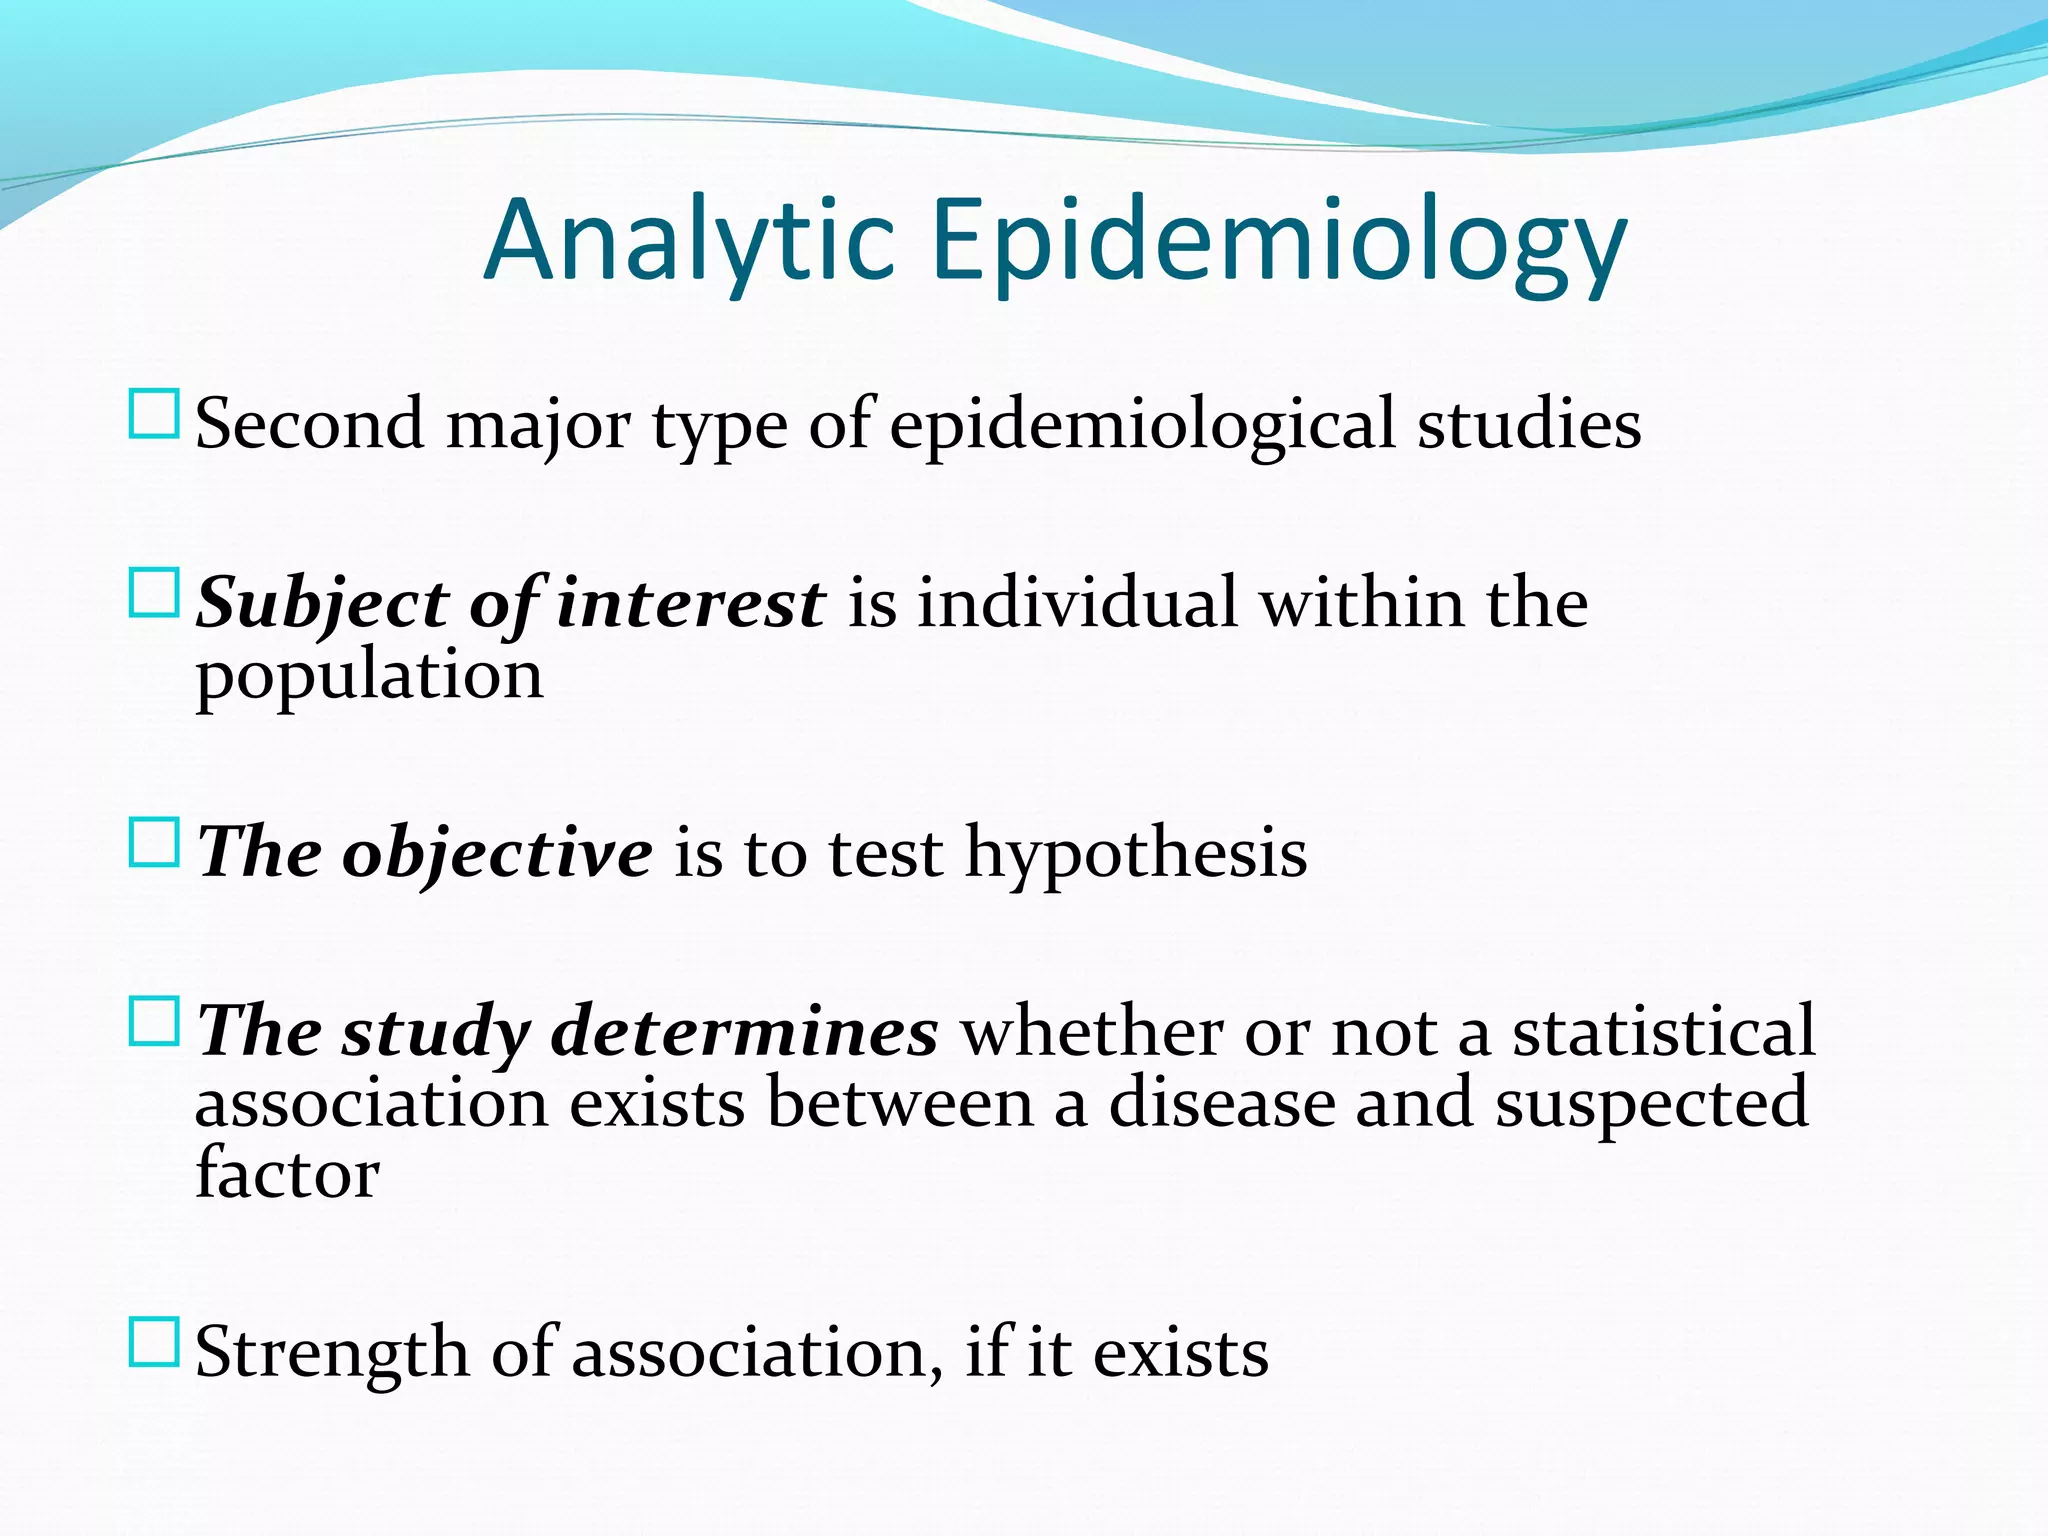


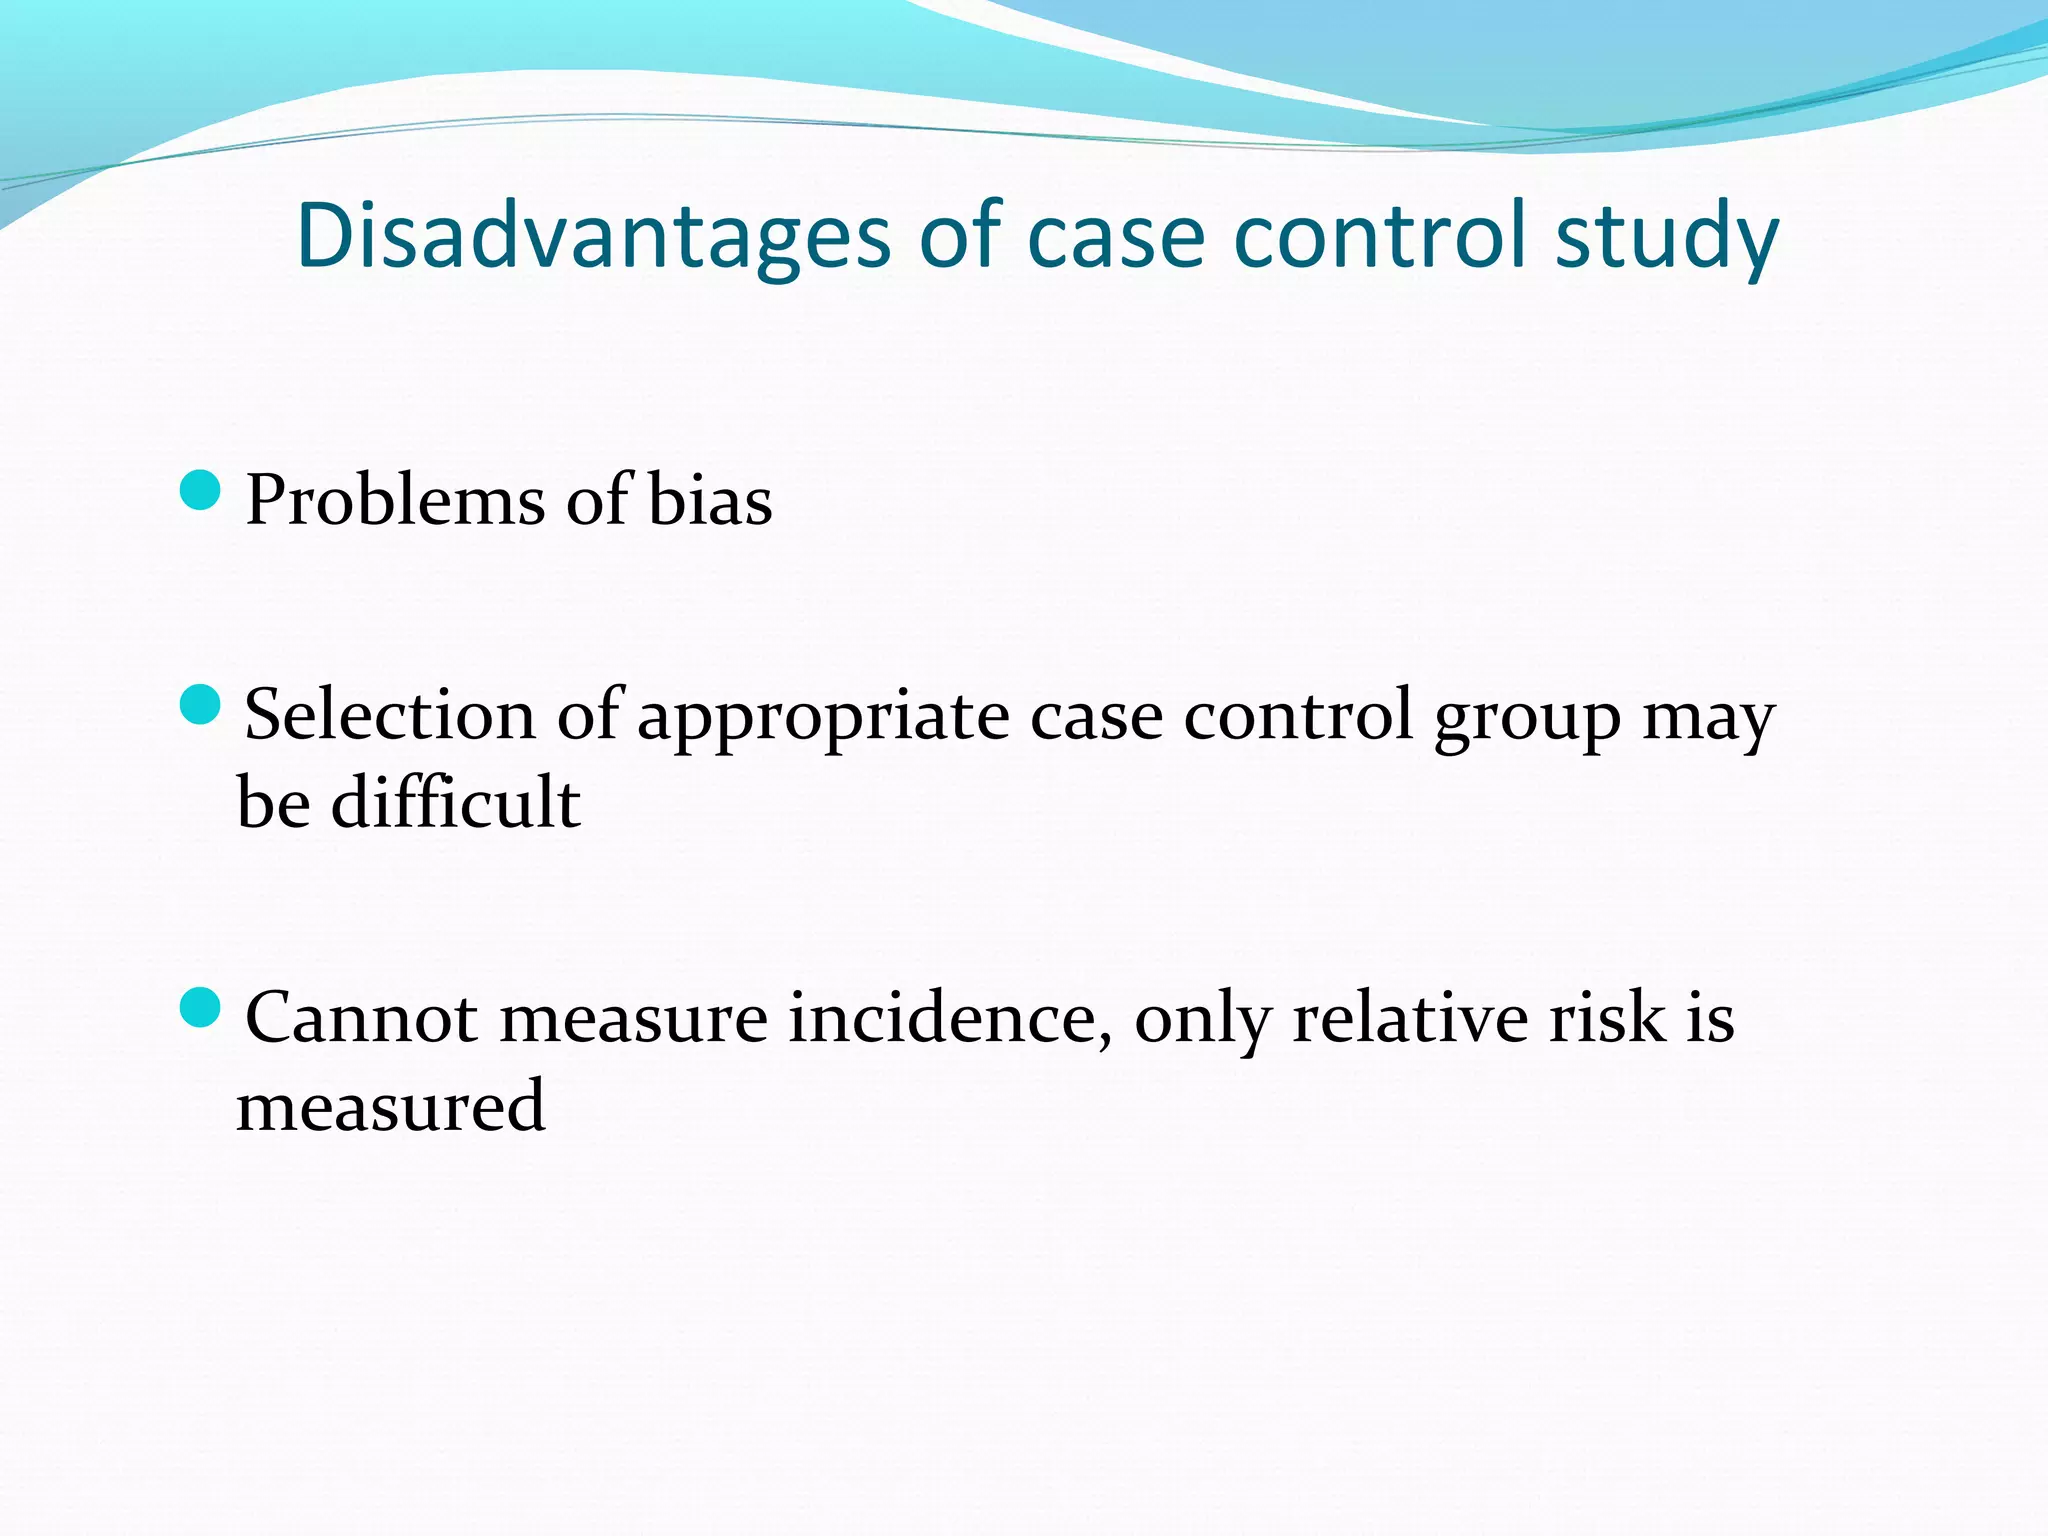

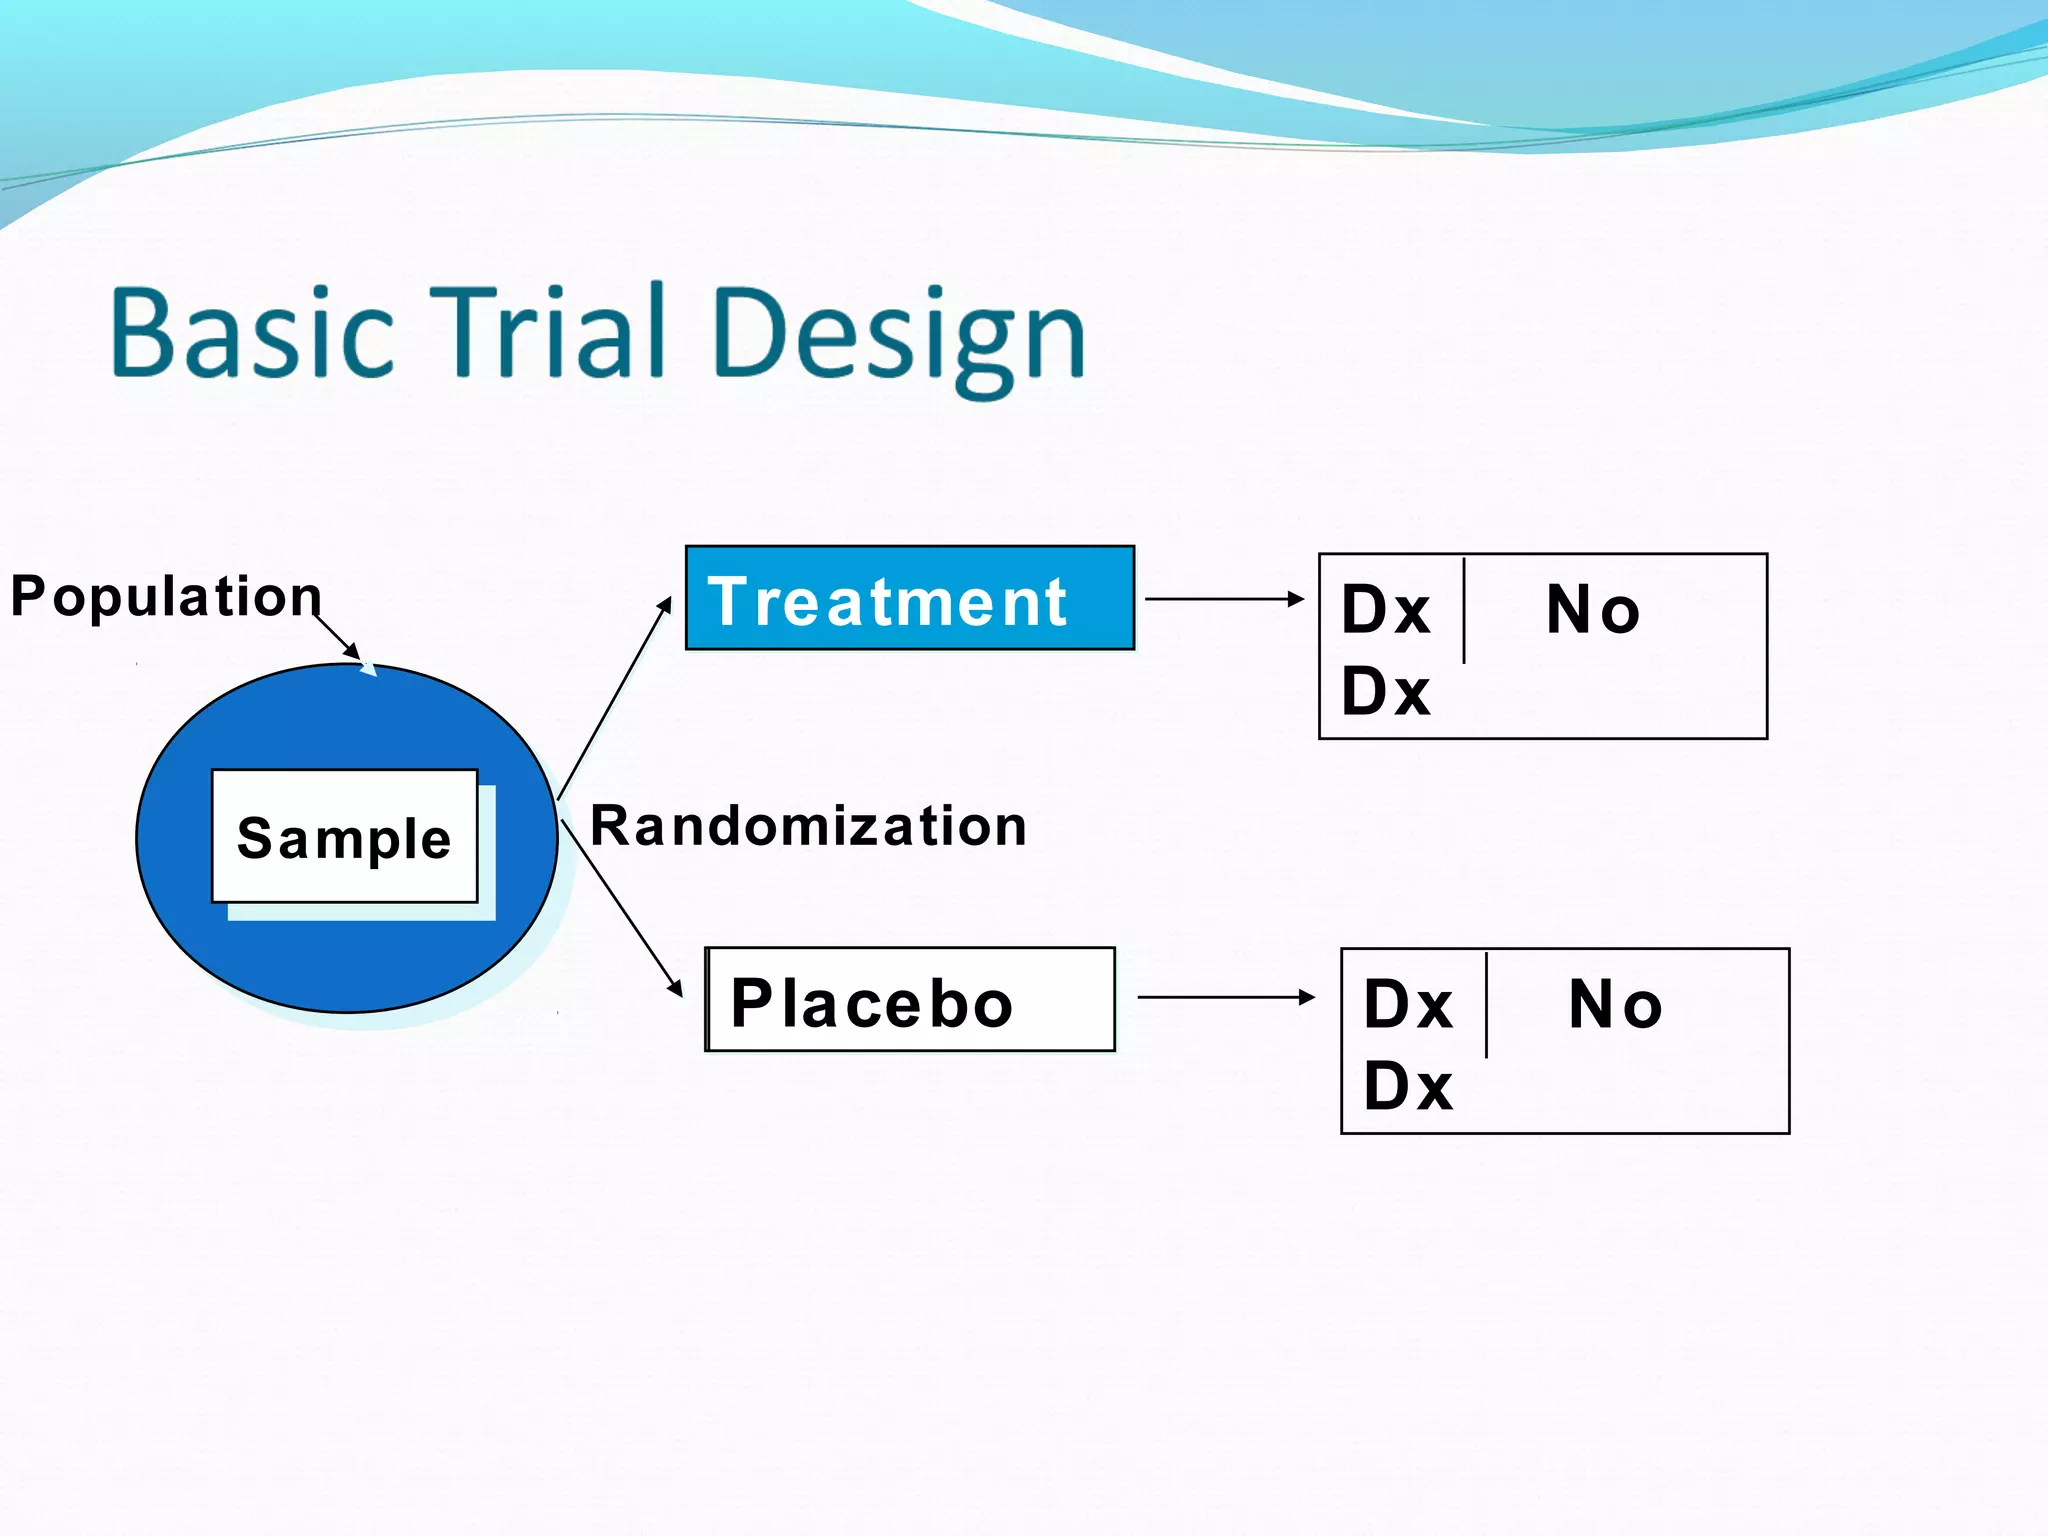
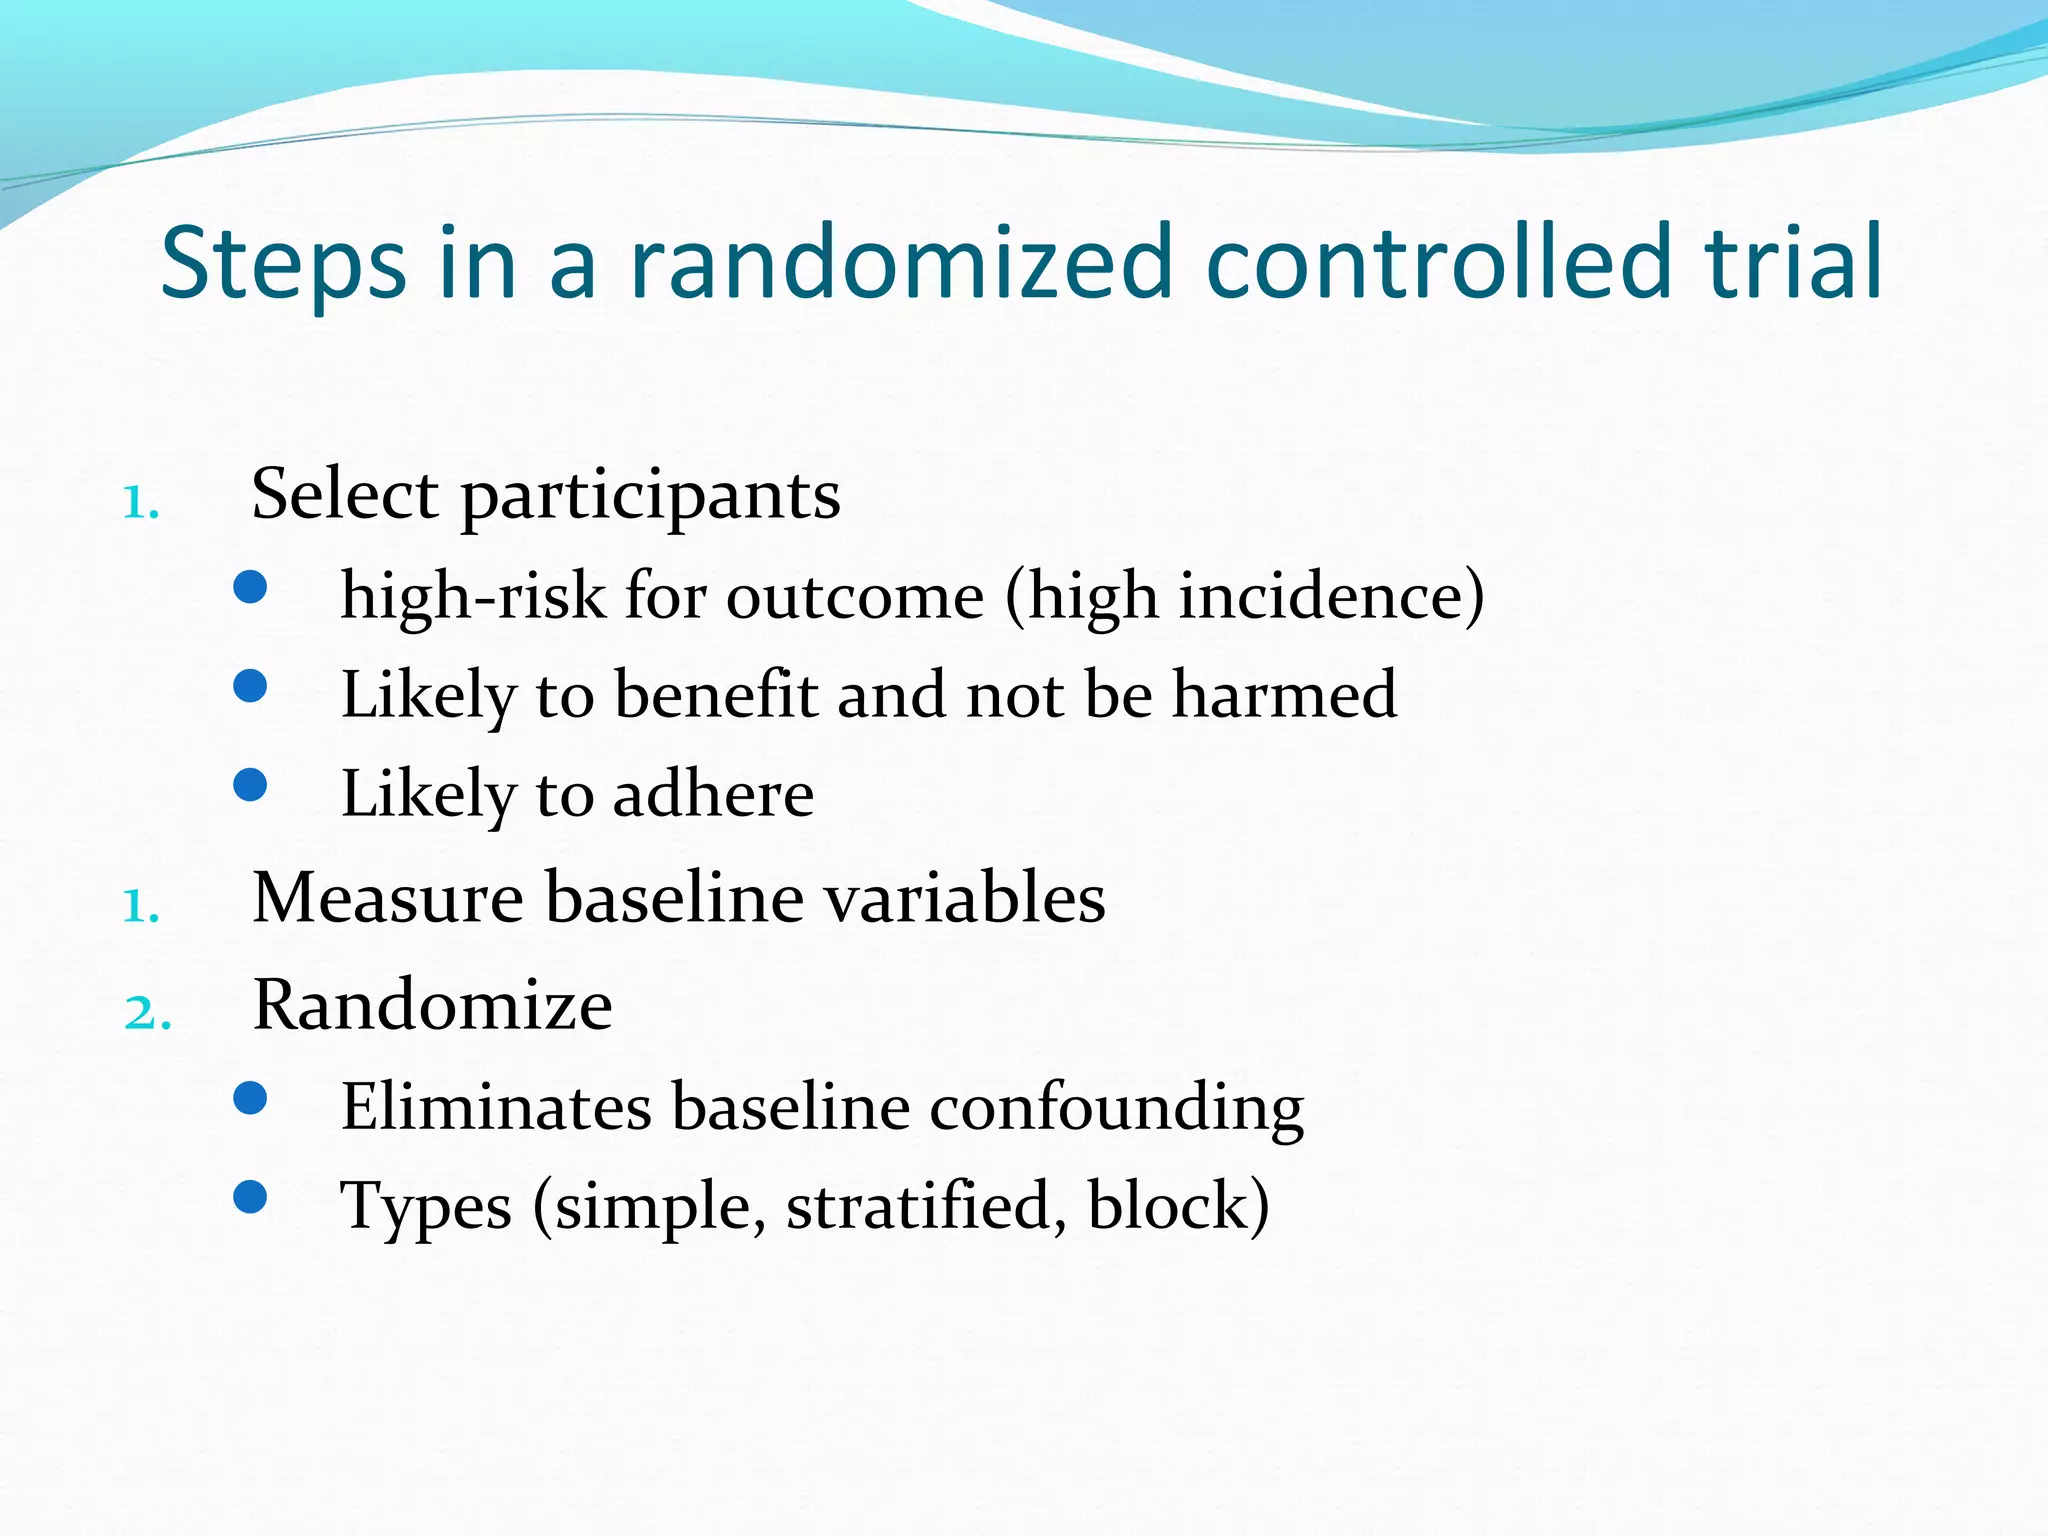
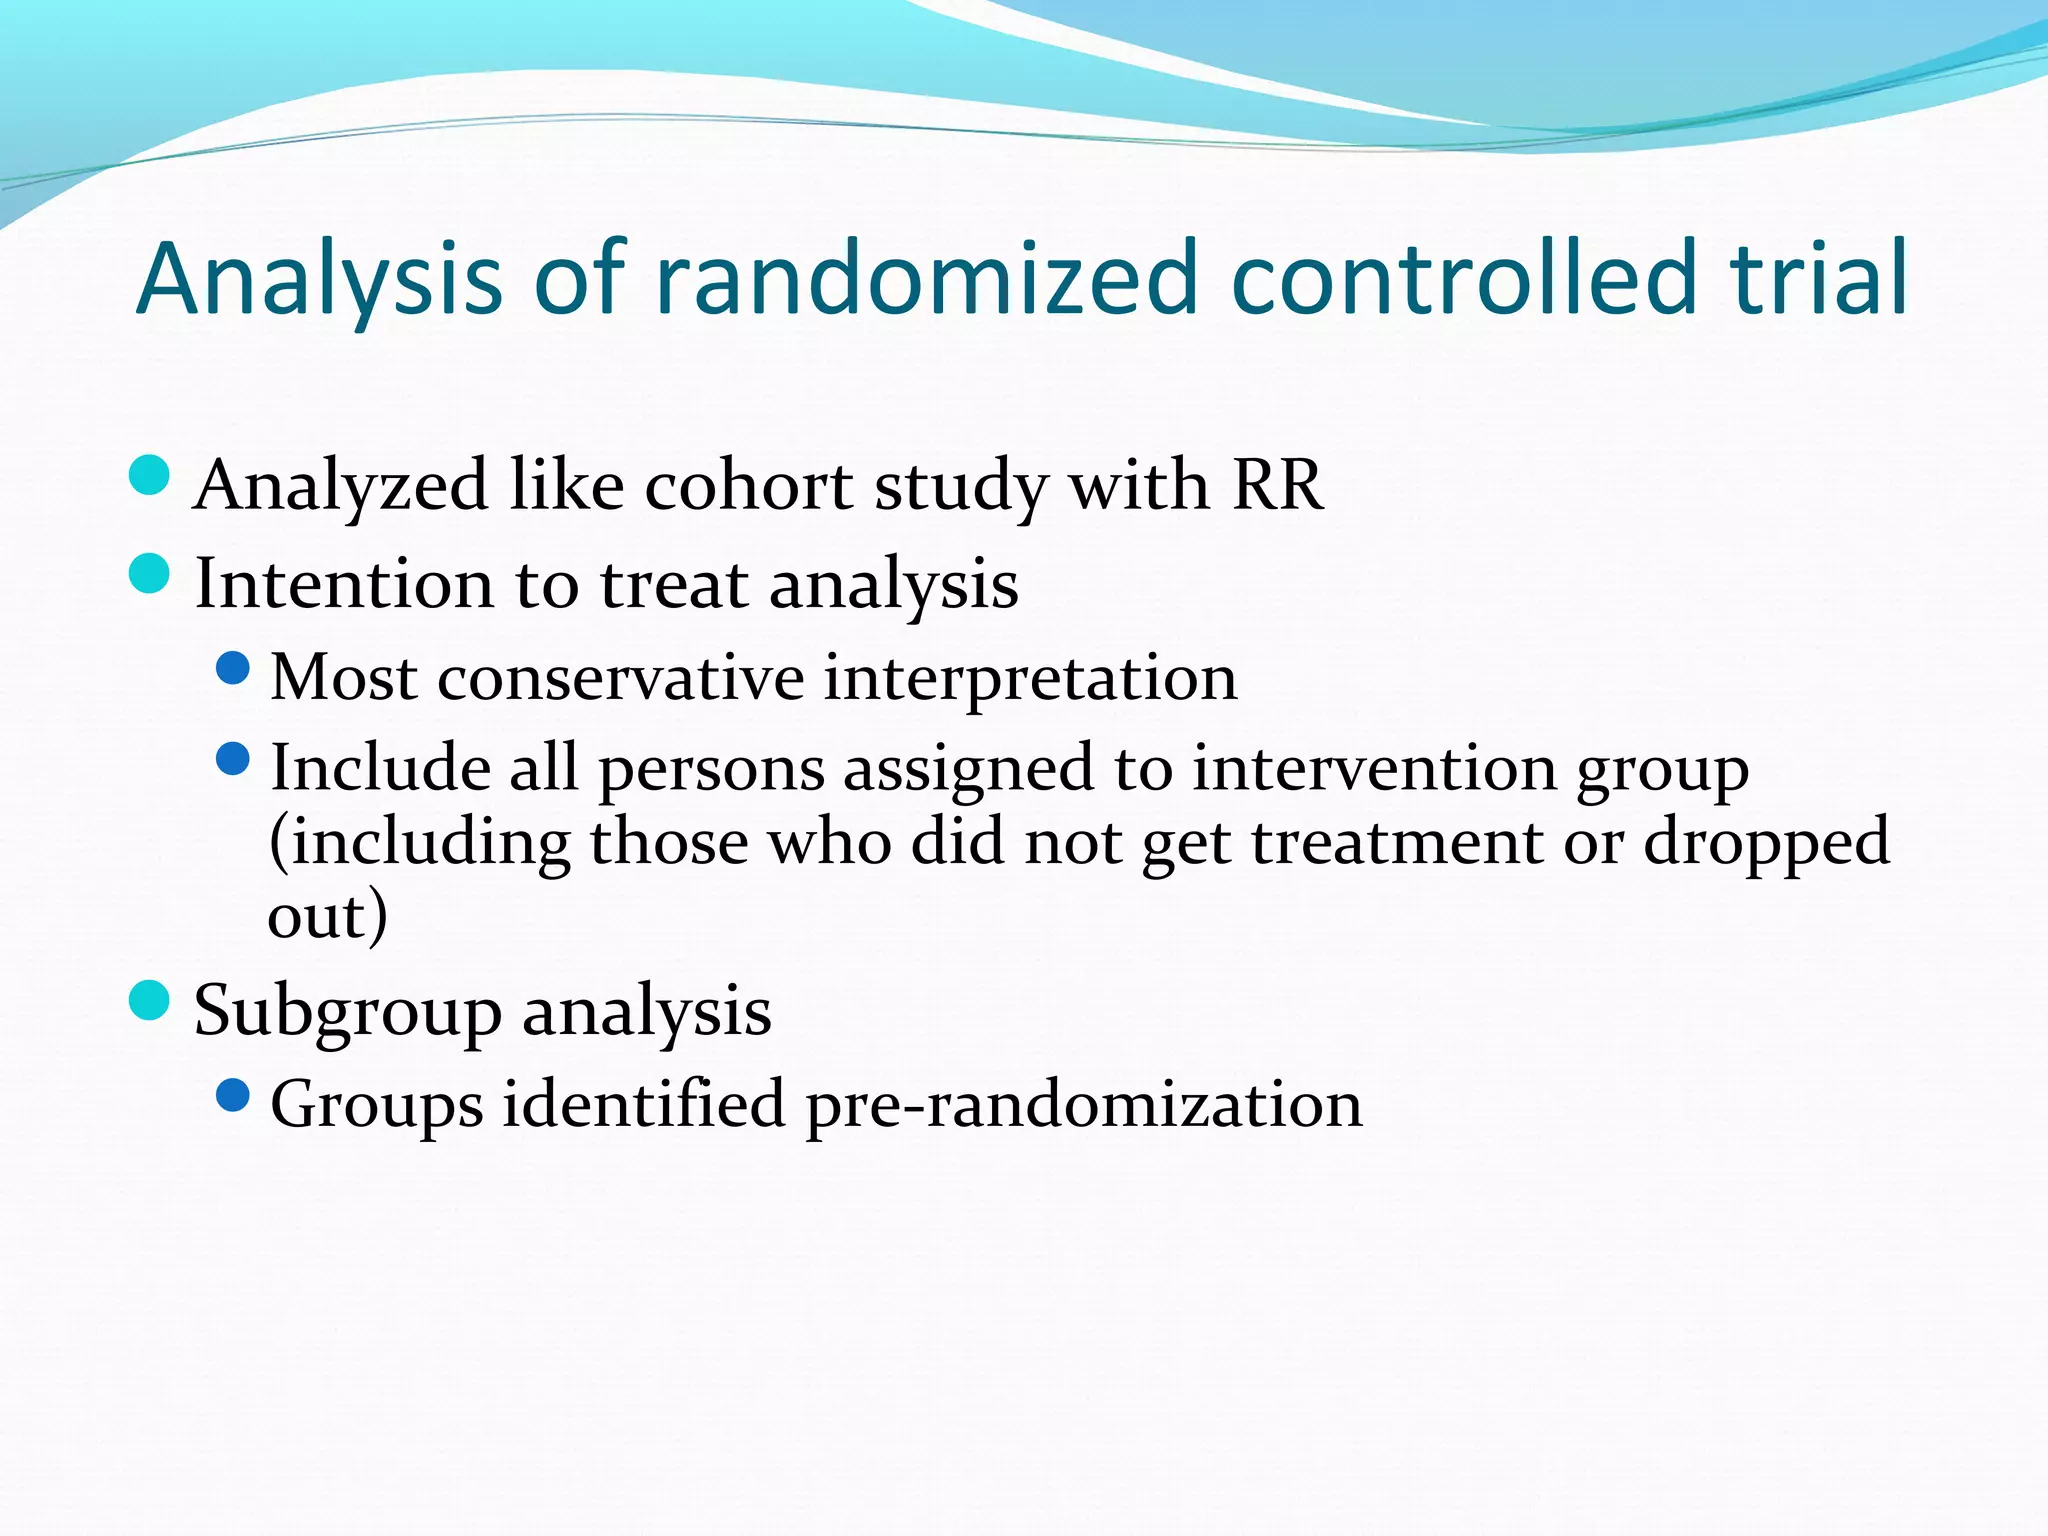

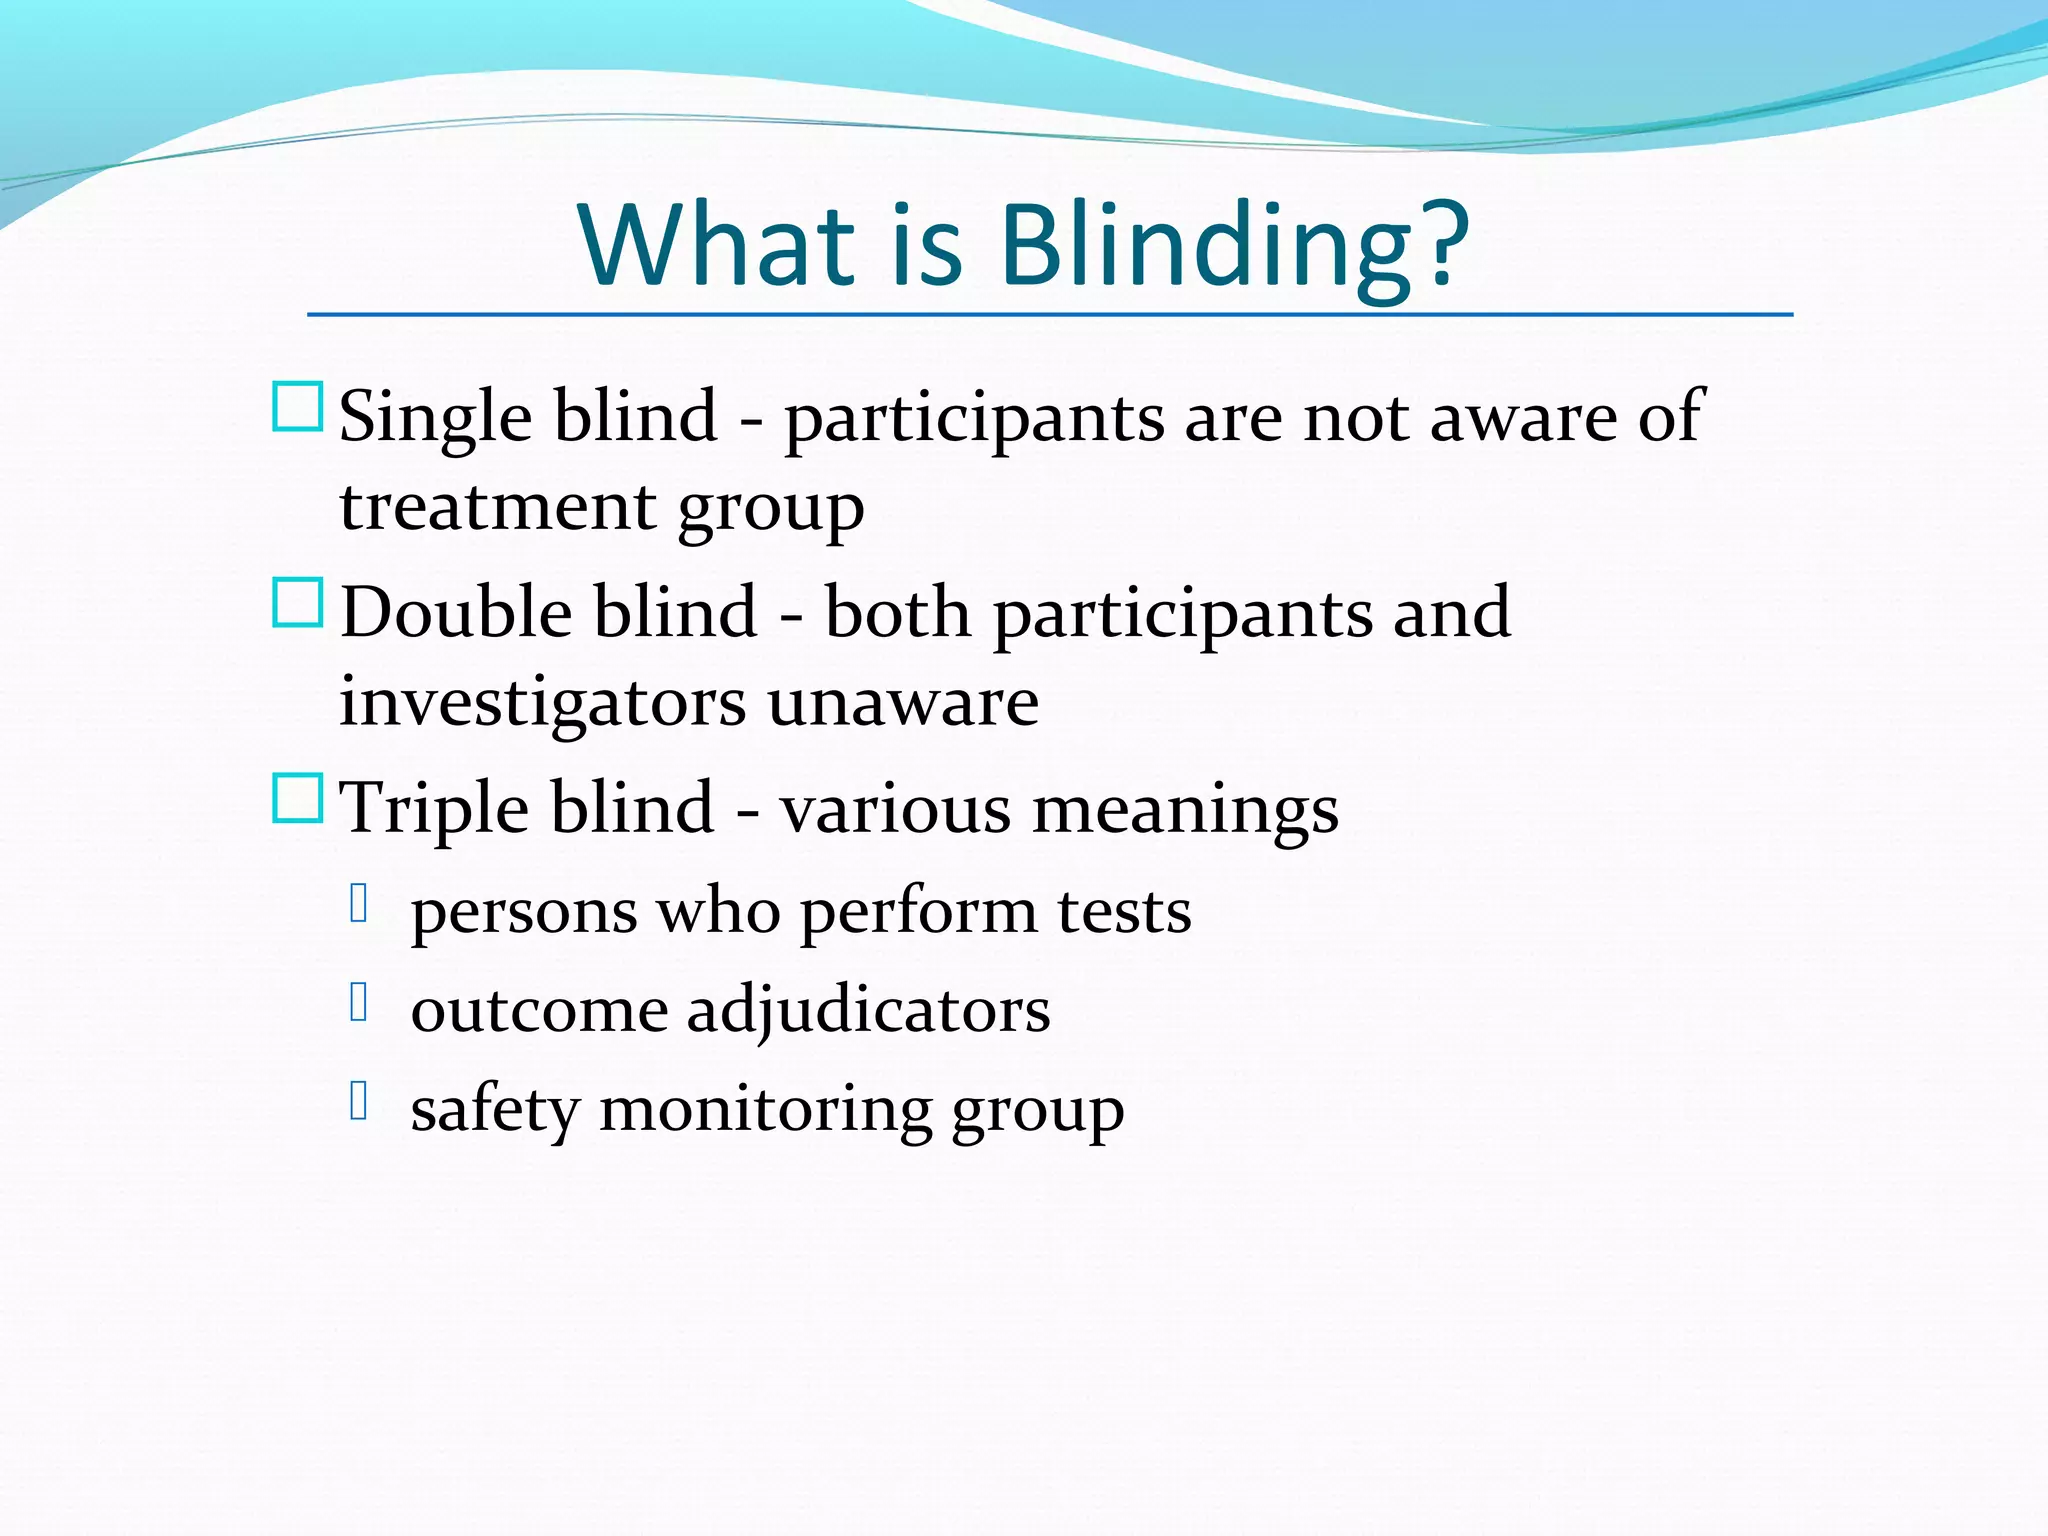
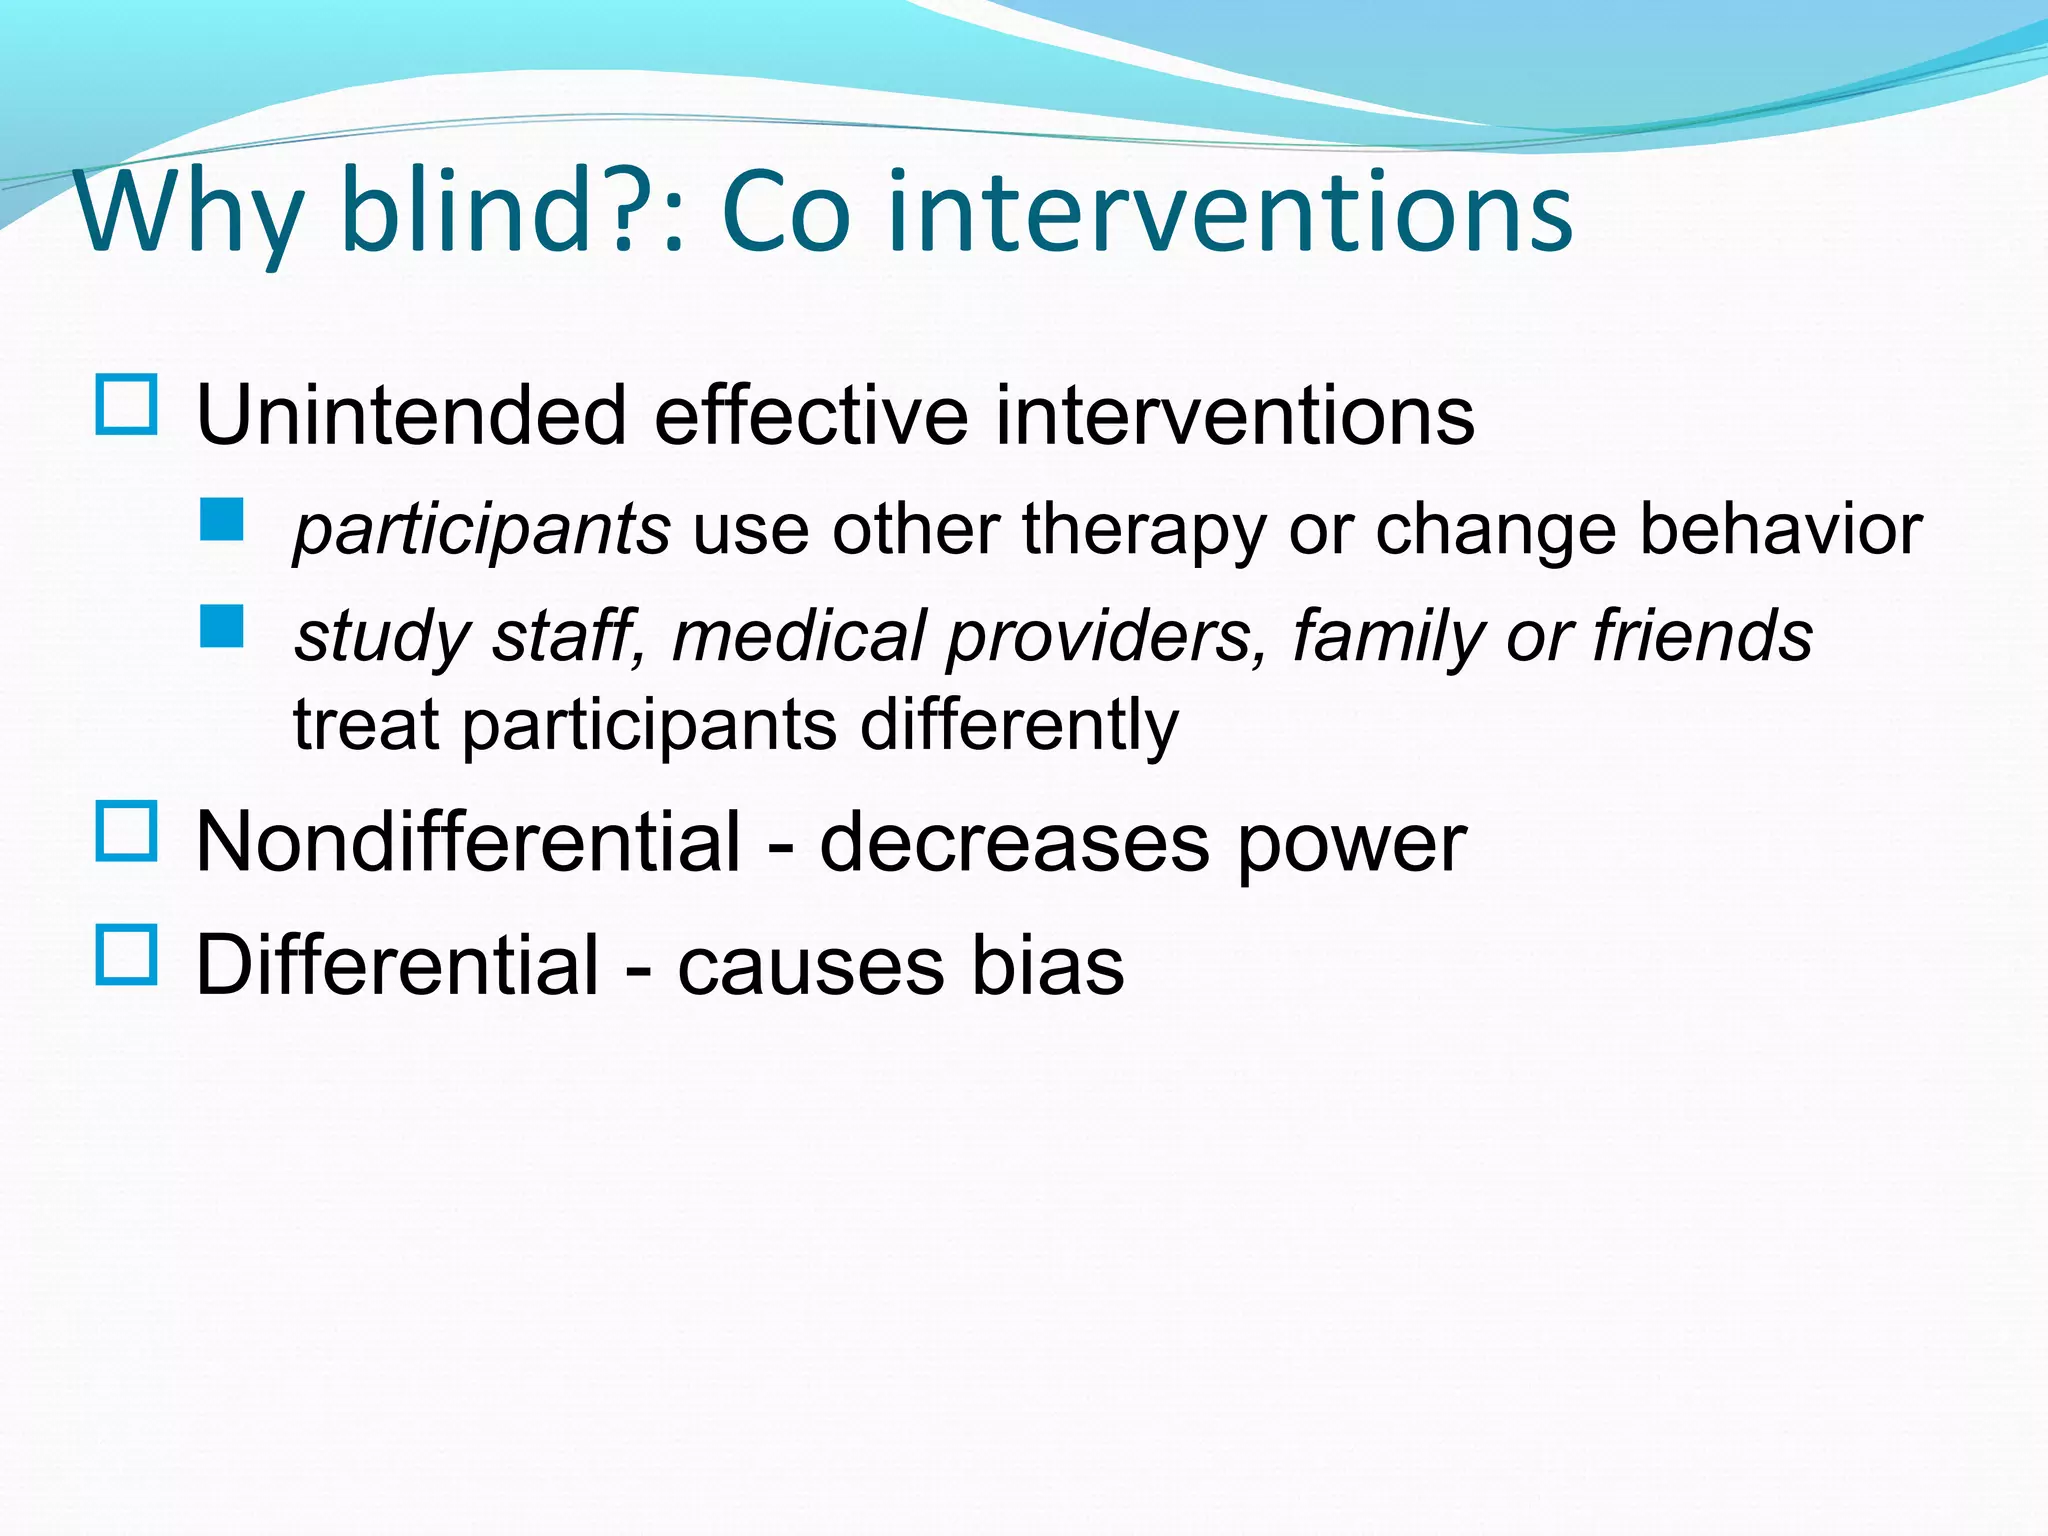


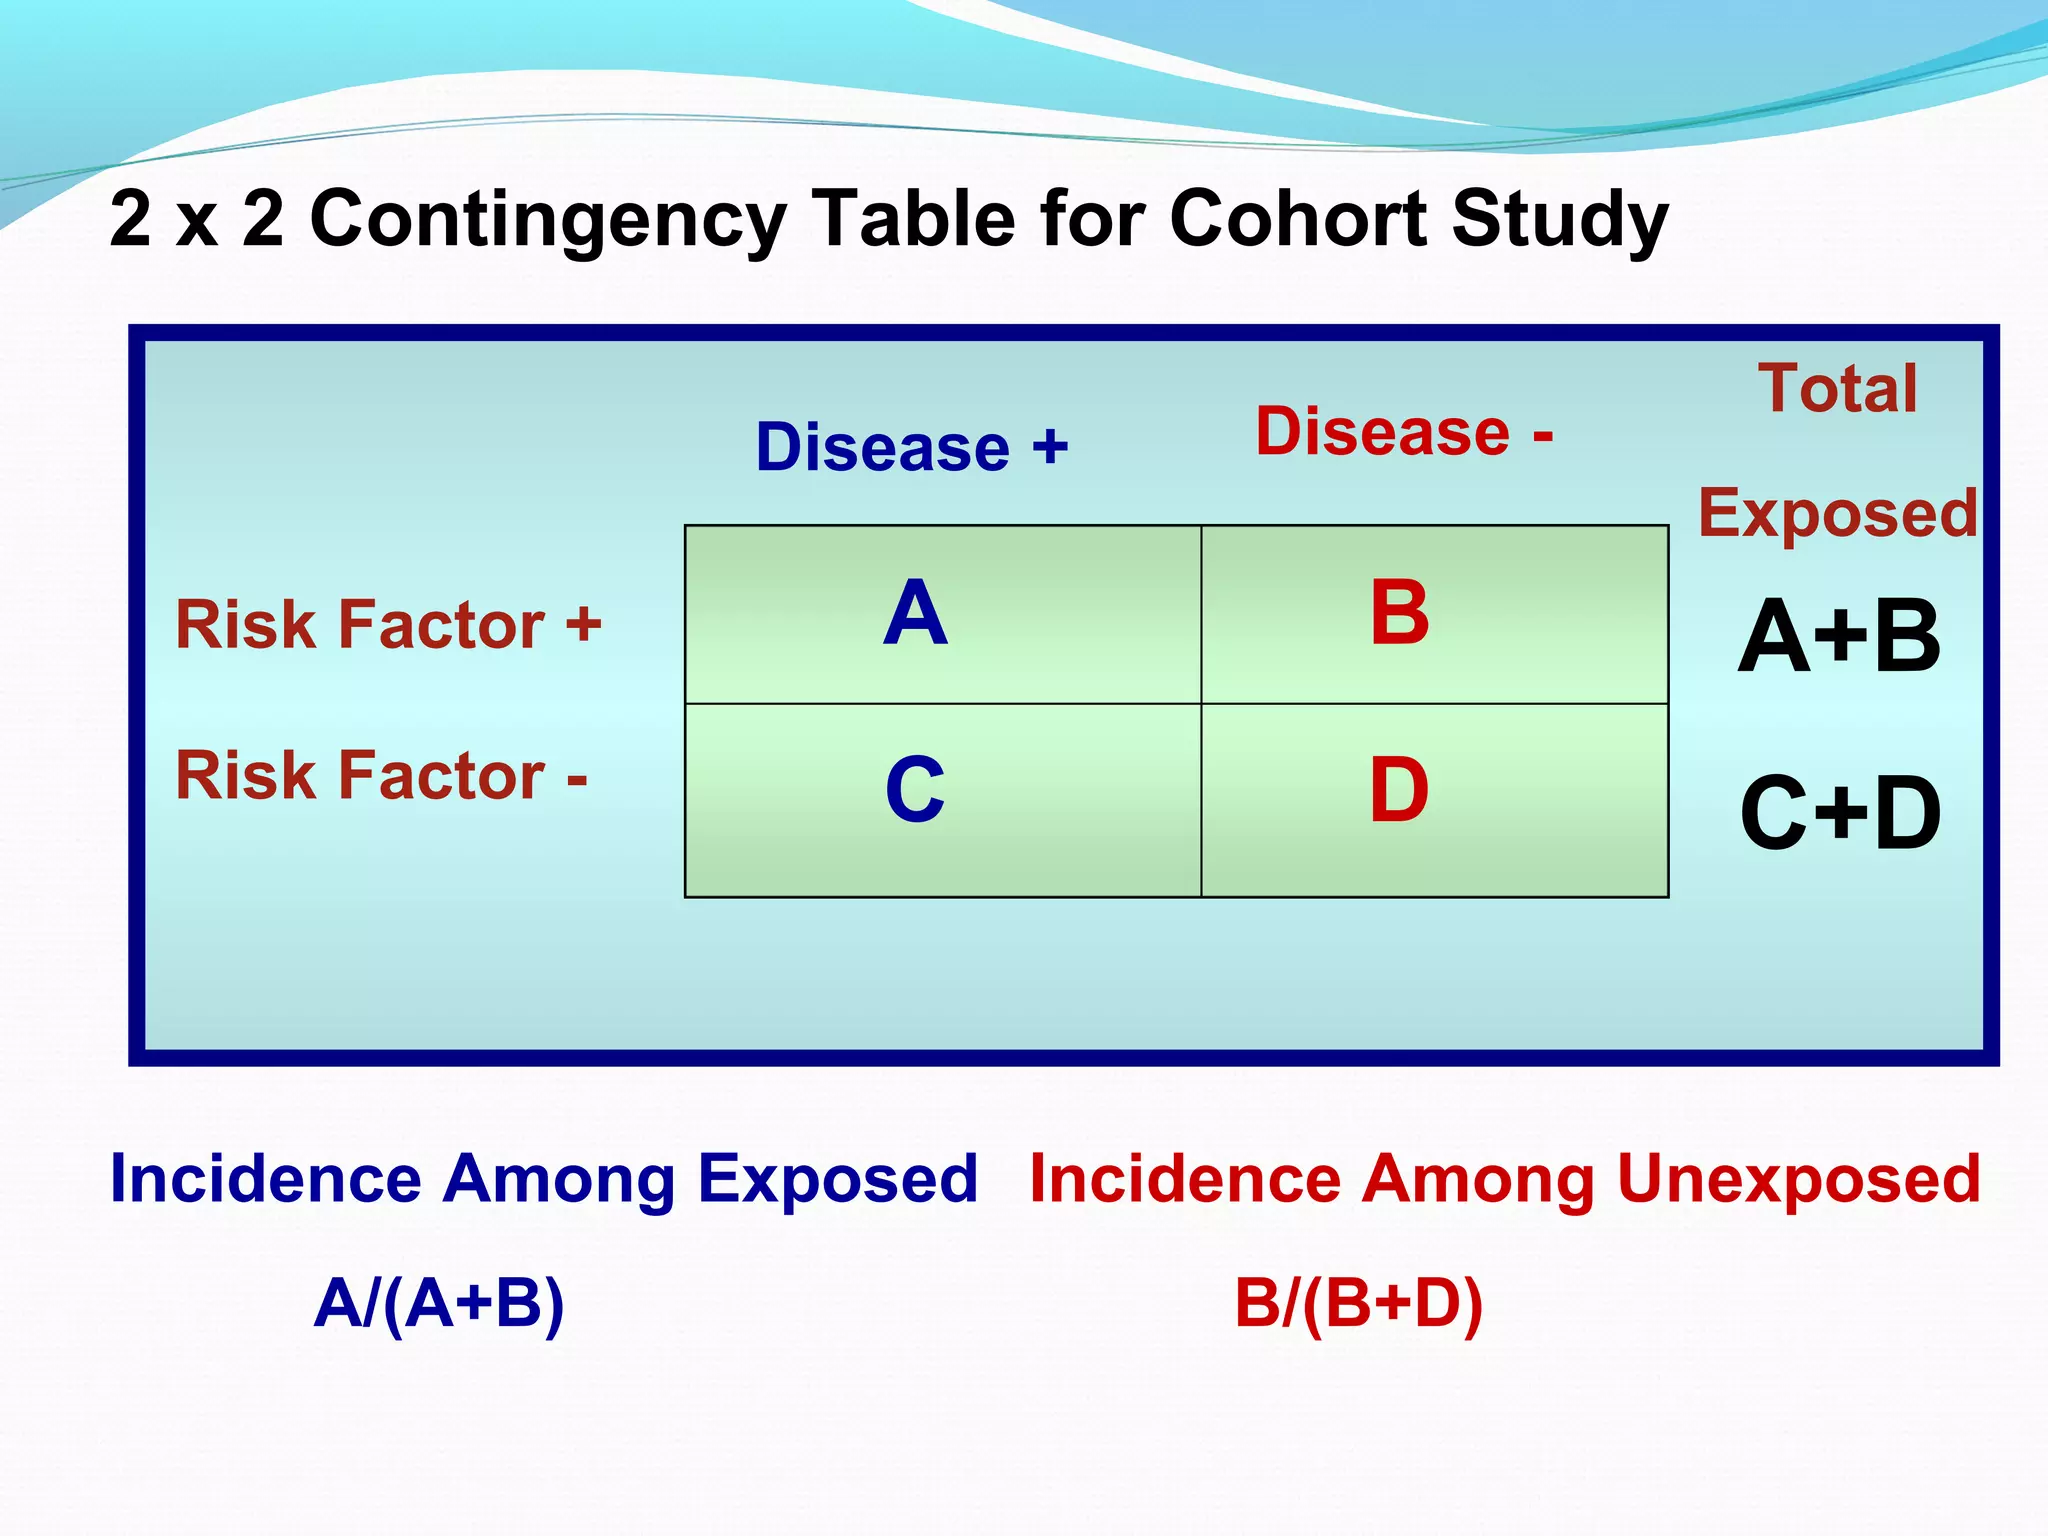


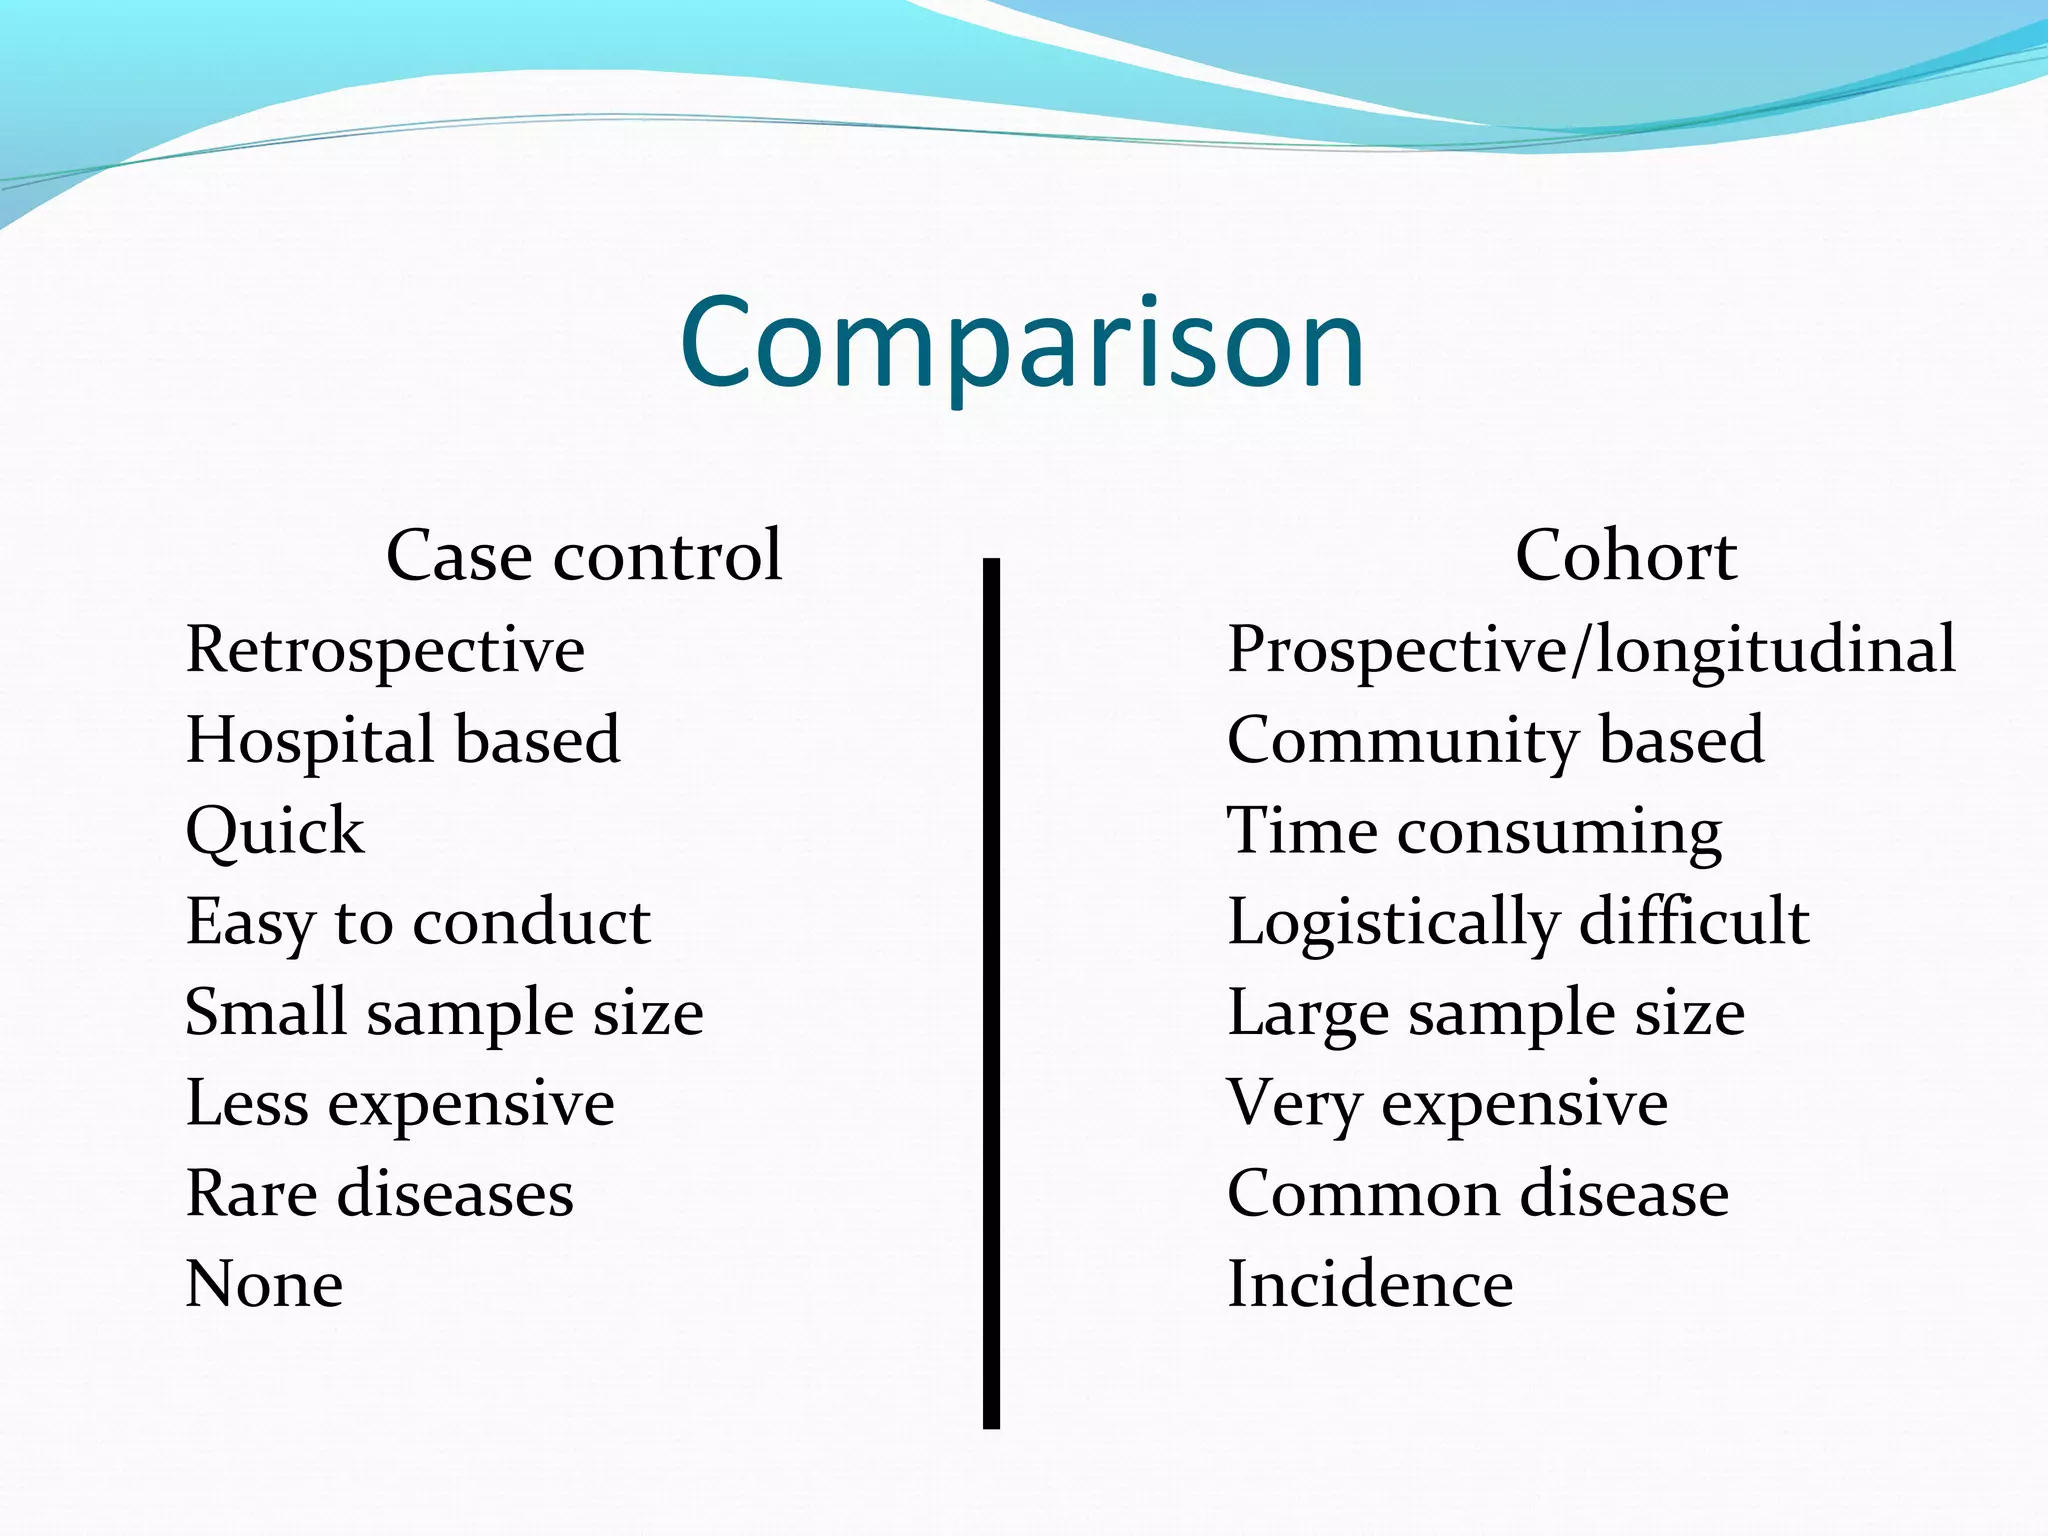
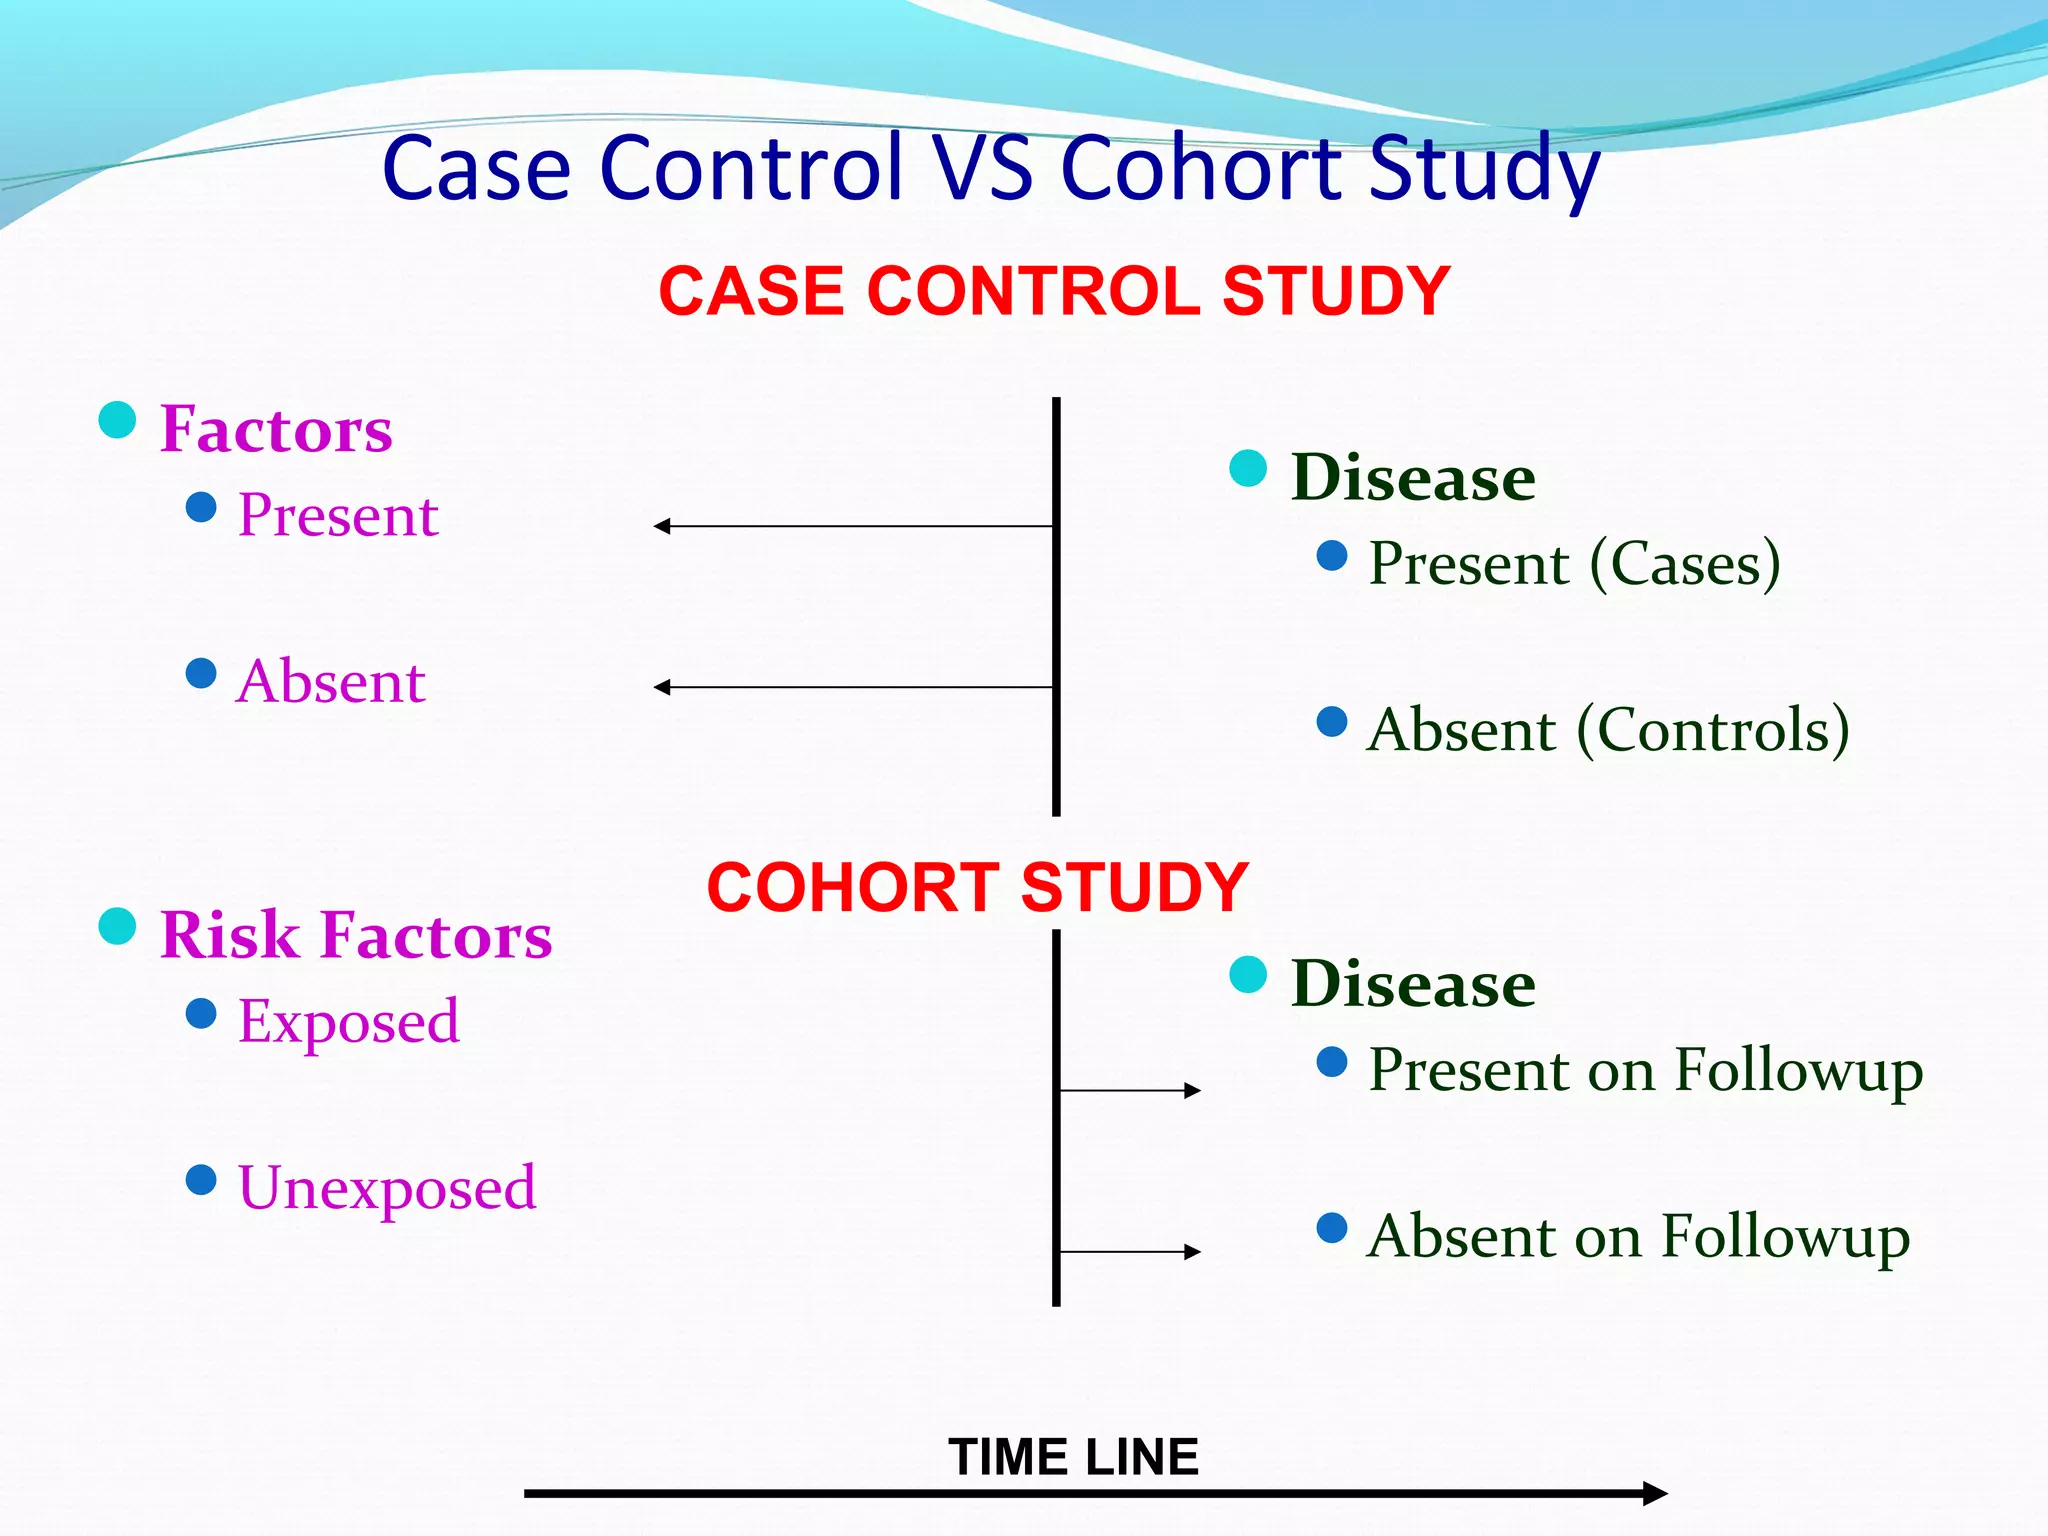


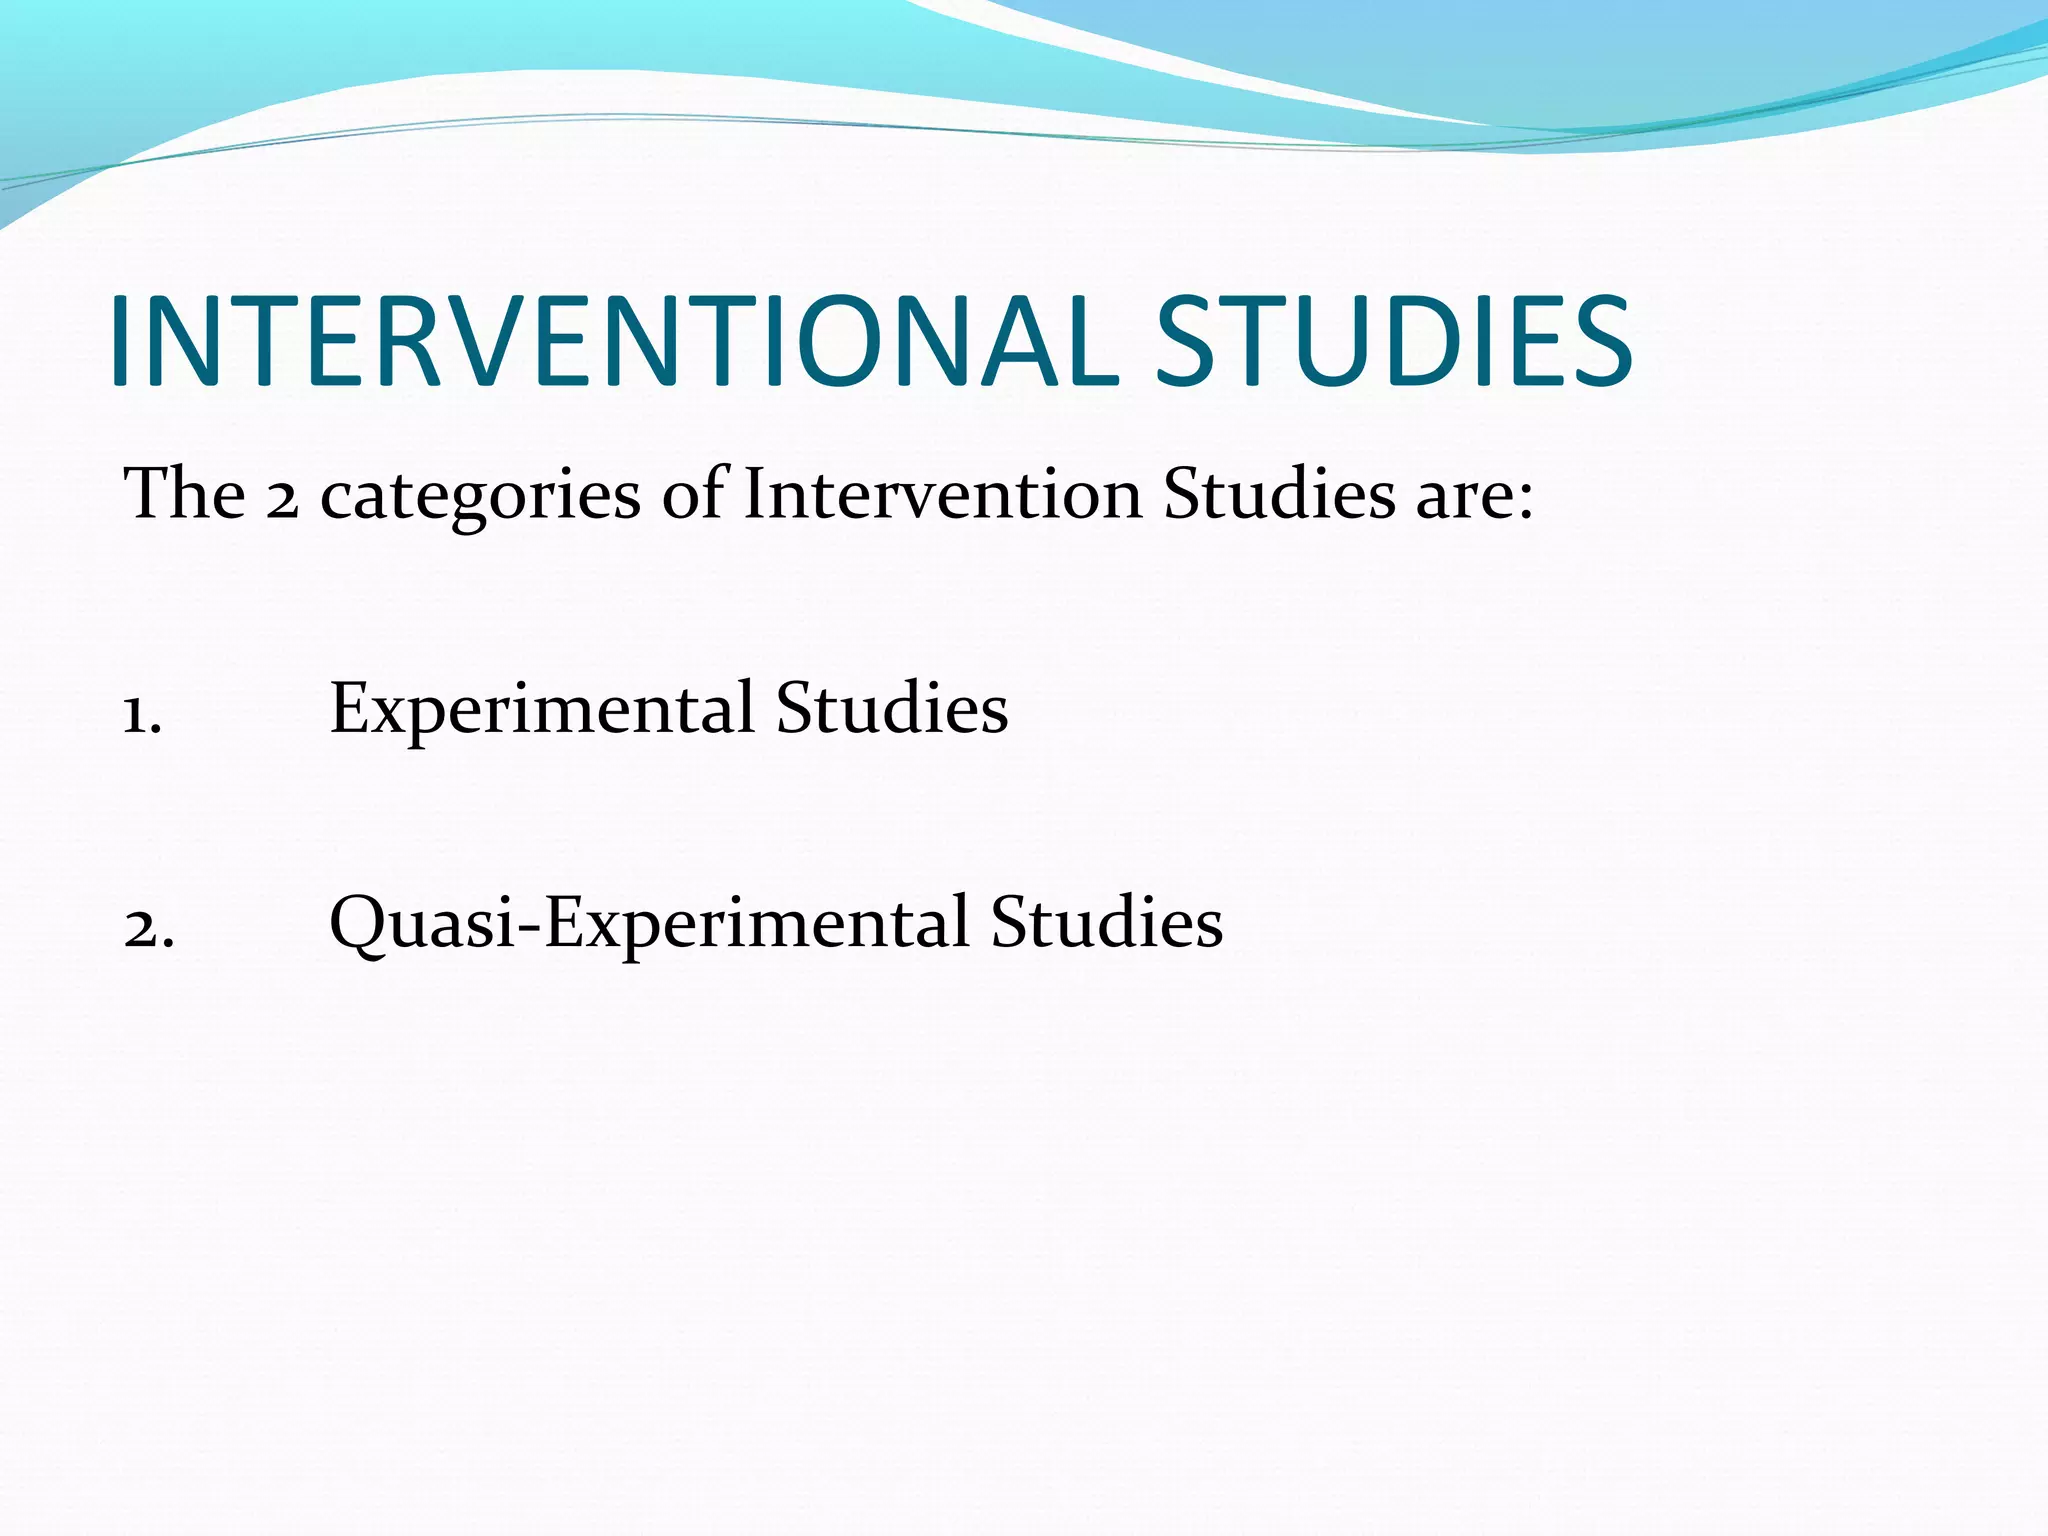

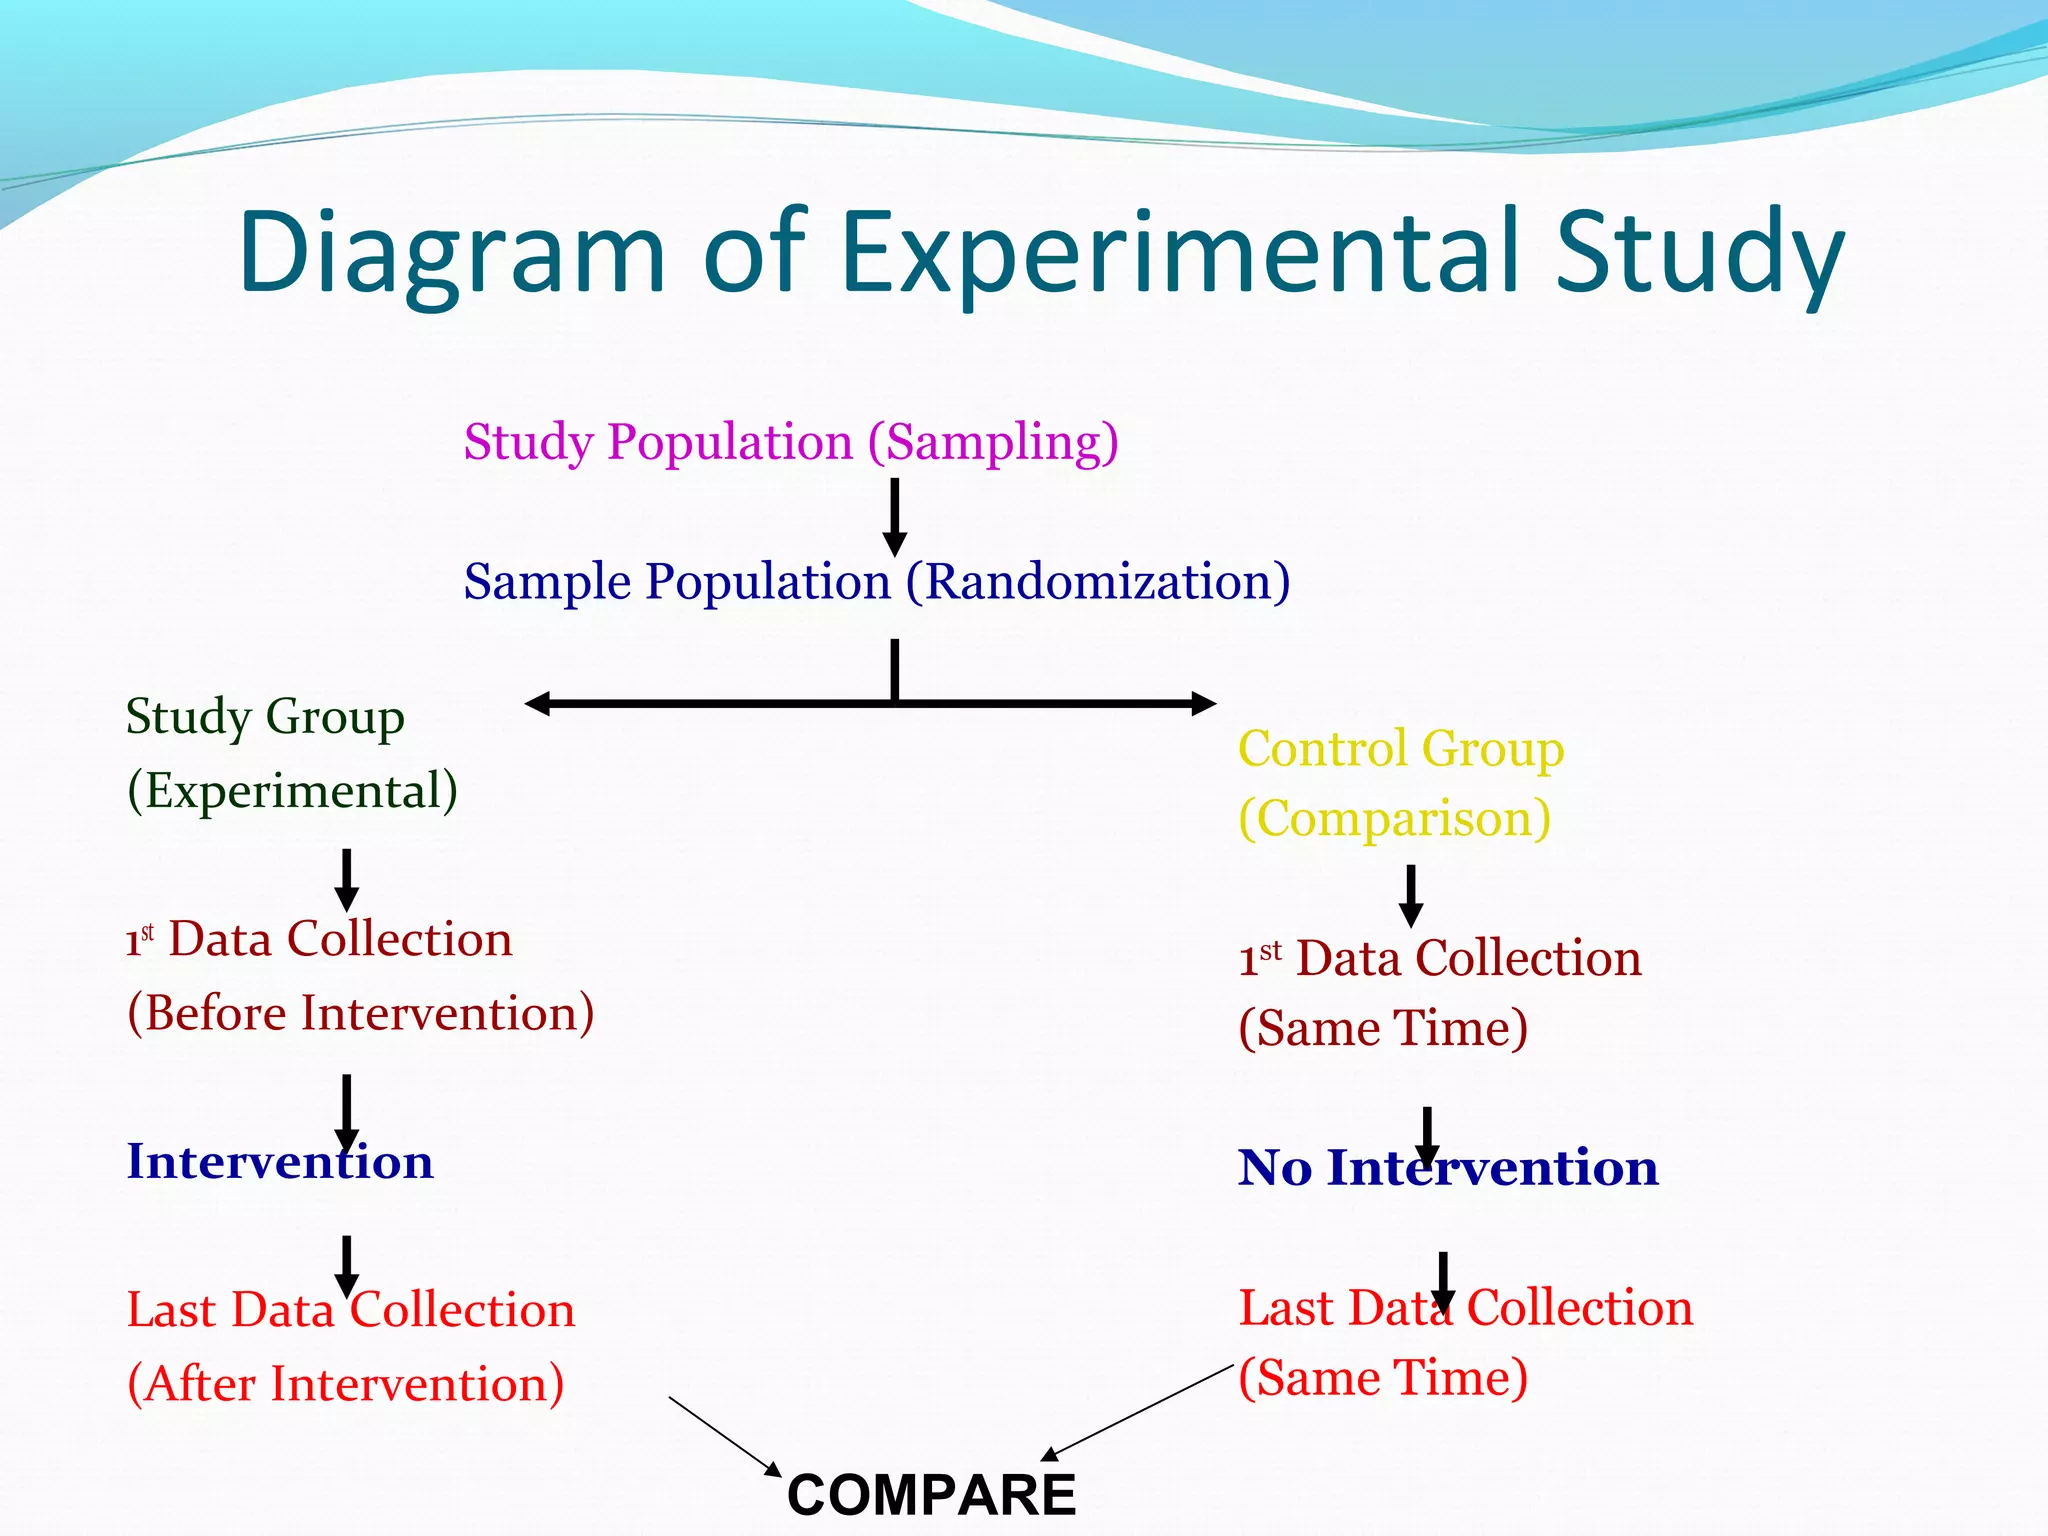


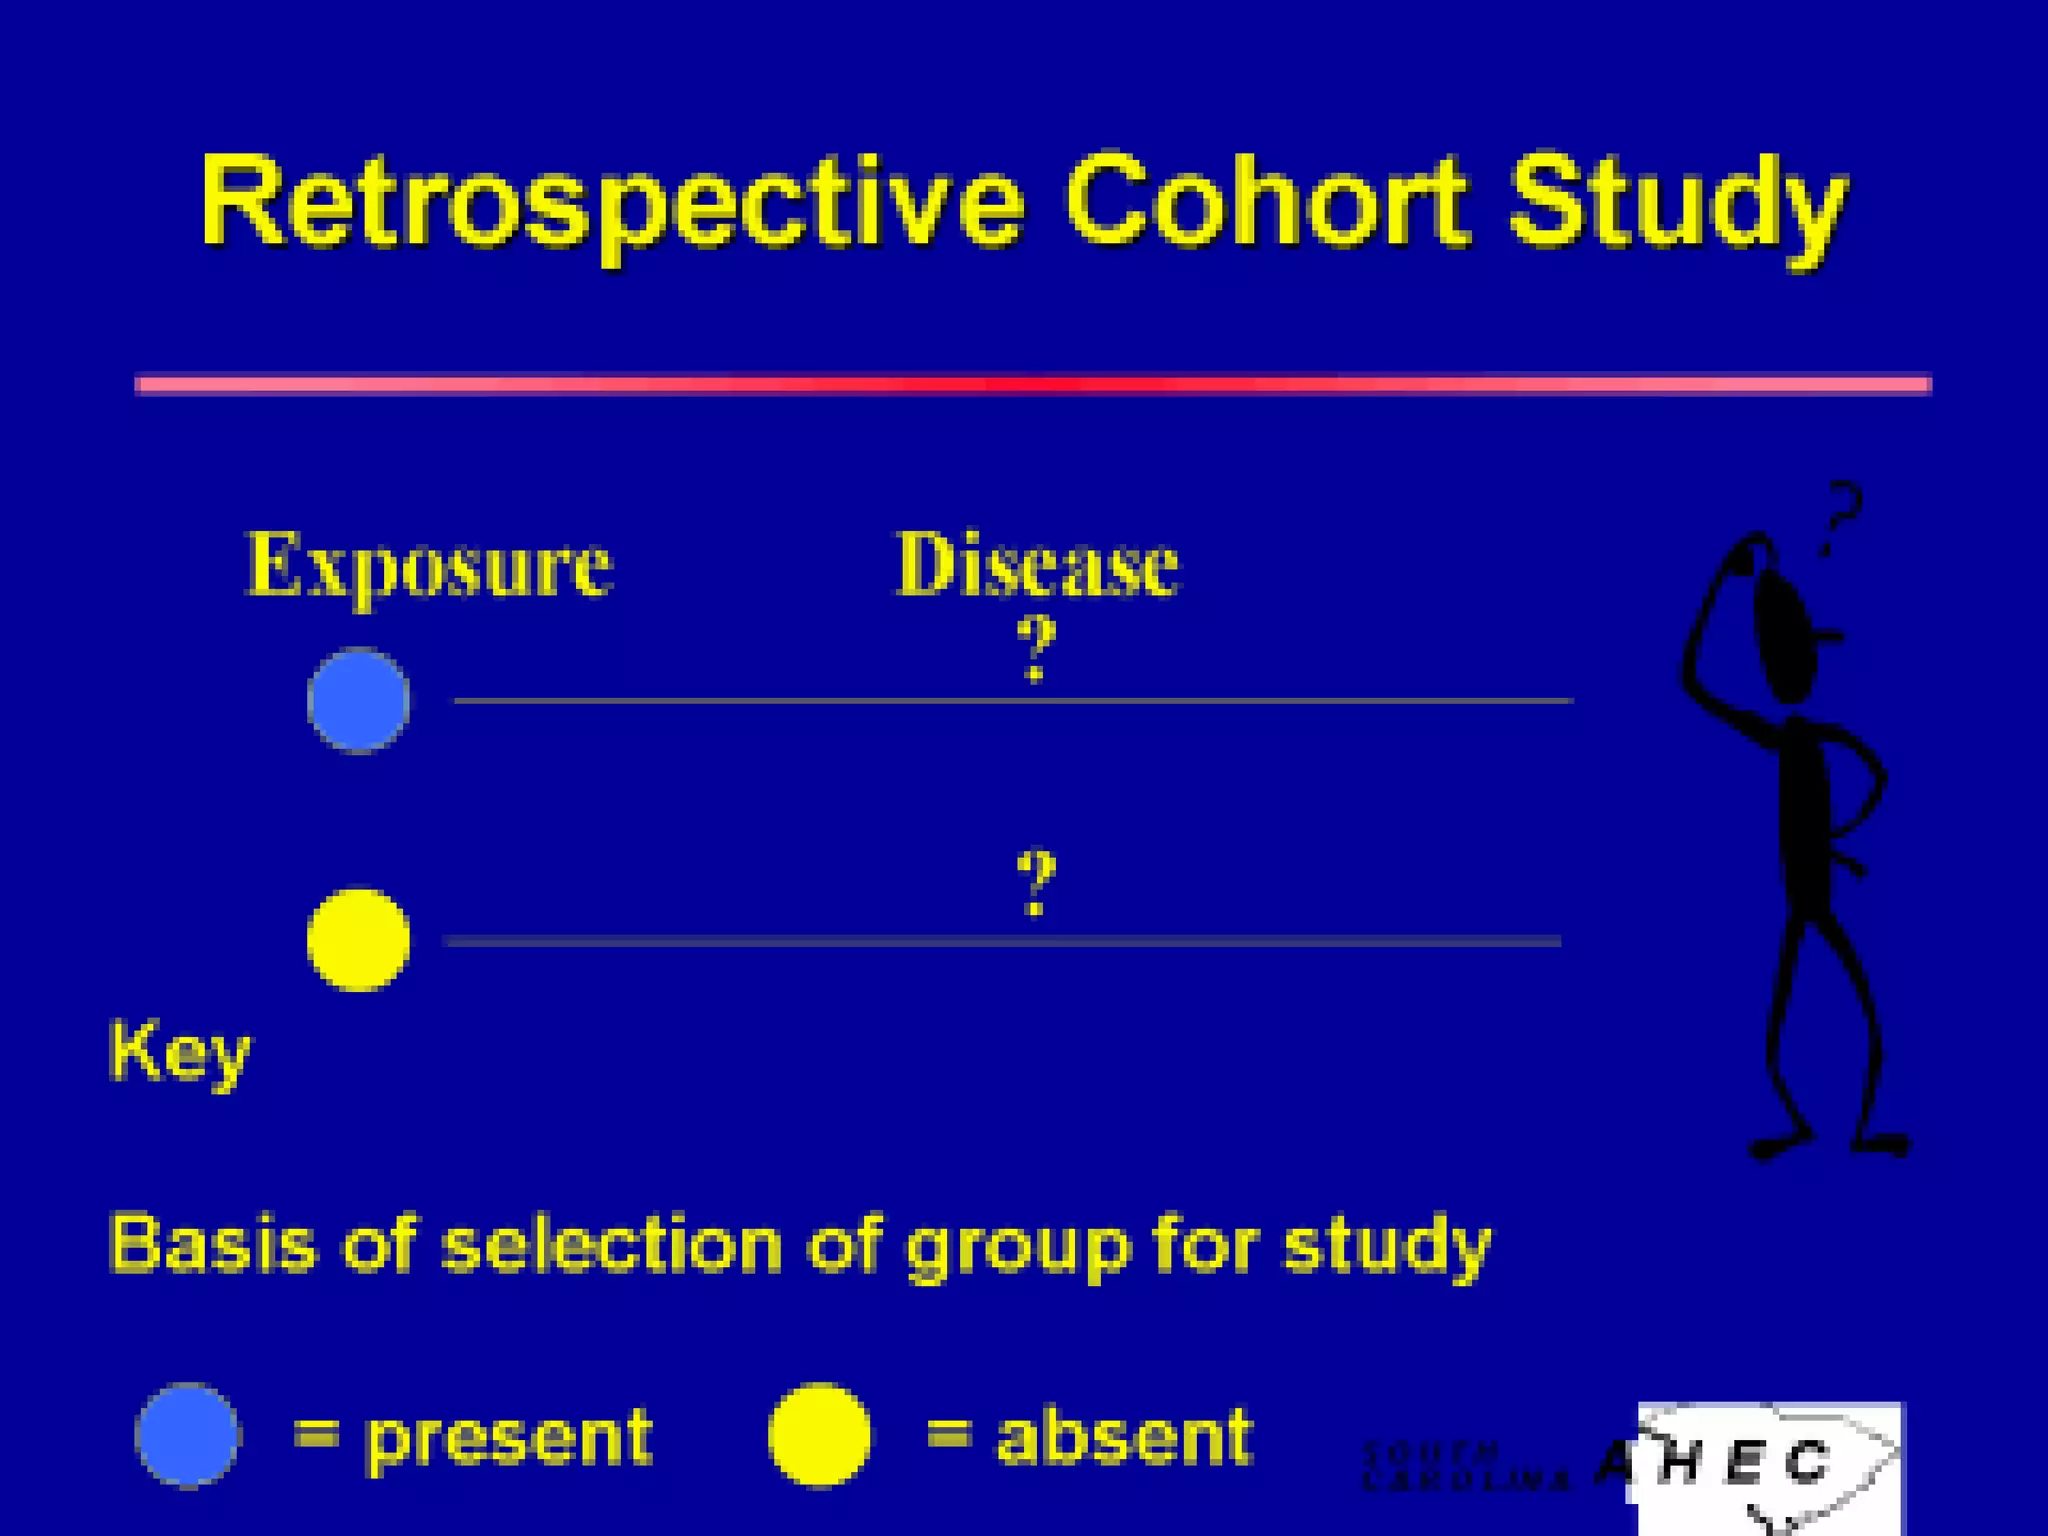


This document discusses various epidemiological study designs used to assess health outcomes and answer clinical questions. It begins by outlining the 6 D's of health outcomes - death, disease, discomfort, disability, dissatisfaction, and destitution. It then describes key clinical questions and types of epidemiological studies including descriptive studies, analytical observational studies, and experimental/interventional studies. Descriptive studies involve systematically collecting and presenting data to describe a situation, while analytical studies aim to establish causes or risk factors by comparing groups. Specific analytical study designs covered include case-control studies, cohort studies, and randomized controlled trials.


