2.1 frequency distribtuion
•
0 likes•393 views

Frequency distribtuion Engineering Statisitcs & Probability For Civil Engineer

Recommended
More Related Content
What's hot
What's hot (20)
Viewers also liked
Similar to 2.1 frequency distribtuion
Similar to 2.1 frequency distribtuion (20)
More from University of Salahaddin-Erbil
Recently uploaded
Recently uploaded (20)
2.1 frequency distribtuion
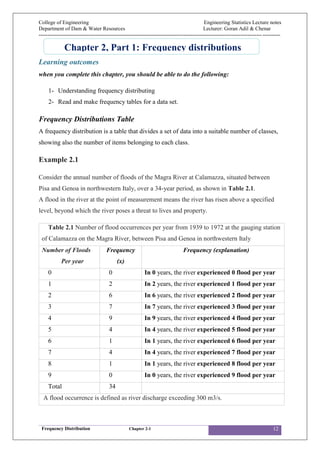
- 1. College of Engineering Engineering Statistics Lecture notes Department of Dam & Water Resources Lecturer: Goran Adil & Chenar --------------------------------------------------------------------------------------------------------------------------------------- Frequency Distribution Chapter 2-1 12 Learning outcomes when you complete this chapter, you should be able to do the following: 1- Understanding frequency distributing 2- Read and make frequency tables for a data set. Frequency Distributions Table A frequency distribution is a table that divides a set of data into a suitable number of classes, showing also the number of items belonging to each class. Example 2.1 Consider the annual number of floods of the Magra River at Calamazza, situated between Pisa and Genoa in northwestern Italy, over a 34-year period, as shown in Table 2.1. A flood in the river at the point of measurement means the river has risen above a specified level, beyond which the river poses a threat to lives and property. Table 2.1 Number of flood occurrences per year from 1939 to 1972 at the gauging station of Calamazza on the Magra River, between Pisa and Genoa in northwestern Italy Number of Floods Per year Frequency (x) Frequency (explanation) 0 0 In 0 years, the river experienced 0 flood per year 1 2 In 2 years, the river experienced 1 flood per year 2 6 In 6 years, the river experienced 2 flood per year 3 7 In 7 years, the river experienced 3 flood per year 4 9 In 9 years, the river experienced 4 flood per year 5 4 In 4 years, the river experienced 5 flood per year 6 1 In 1 years, the river experienced 6 flood per year 7 4 In 4 years, the river experienced 7 flood per year 8 1 In 1 years, the river experienced 8 flood per year 9 0 In 0 years, the river experienced 9 flood per year Total 34 A flood occurrence is defined as river discharge exceeding 300 m3/s. Chapter 2, Part 1: Frequency distributions
- 2. College of Engineering Engineering Statistics Lecture notes Department of Dam & Water Resources Lecturer: Goran Adil & Chenar --------------------------------------------------------------------------------------------------------------------------------------- Frequency Distribution Chapter 2-1 13 Sorting data There are two type of sorting:- 1- Ascending Order Numbers are said to be in ascending order when they are arranged from the smallest to the largest number. 2- Descending Order Numbers are said to be in descending order when they are arranged from the largest to the smallest number. Reasons for Constructing Frequency Distributions 1. Large data sets can be summarized. 2. Can gai n some insight into the nature of data. 3. Have a basis for constructing graphs. Example 2.2 The Annual maximum daily mean discharges (m3 s -1) for the River Thames at Kingston over the period 1884 to 1991 are presented in table 2.2 Table 2.2: Annual maximum daily mean discharges (m3 /s, naturalized) for the River Thames at Kingston (Teddington) (Data supplied by the National Rivers Authority) 231 229 244 284 207 237 204 171 339 299 173 789 201 351 171 262 533 200 162 386 517 229 249 220 375 204 231 428 366 255 256 585 373 327 351 334 251 240 198 231 298 522 370 374 526 235 551 228 274 479 94 227 478 437 247 369 410 384 298 457 115 261 256 714 227 299 324 384 376 263 222 452 315 314 316 375 308 456 344 285 369 122 324 313 600 369 224 362 330 266 396 559 152 334 326 324 393 289 314 345 286 270 408 304 402 262 427 220
- 3. College of Engineering Engineering Statistics Lecture notes Department of Dam & Water Resources Lecturer: Goran Adil & Chenar --------------------------------------------------------------------------------------------------------------------------------------- Frequency Distribution Chapter 2-1 14 Frequency Distribution Table 2.3: Frequency Table (Annual maximum flows in m3/s) Class limit (Annual maximum flows in m3/s) Frequency 00 - 99 1 100 - 199 8 200 - 299 42 300 - 399 36 400 - 499 11 500 - 599 7 600 - 699 1 700 - 799 2 Total 108 Definitions Lower Class Limits are the smallest numbers that can actually belong to different classes Upper Class Limits are the largest numbers that can actually belong to different classes. Table 2.3: Frequency Table (Annual maximum flows in m3/s) Class limits (m3/s) Frequency 00 99 1 100 199 8 200 299 42 300 399 36 400 499 11 500 599 7 600 699 1 700 799 2 Total 108 Lower Class Limits Upper Class Limits
- 4. College of Engineering Engineering Statistics Lecture notes Department of Dam & Water Resources Lecturer: Goran Adil & Chenar --------------------------------------------------------------------------------------------------------------------------------------- Frequency Distribution Chapter 2-1 15 Class Boundaries The numbers used to separate classes, but without the gaps created by class limits. Class Boundaries are the midpoints between the upper class limit of a class and the lower class limit of the next class in the sequence Table 2.3: Frequency Table (Annual maximum flows in m3/s) Lower Class Boundary Class limit Upper Class Boundary Frequency m3/s m3/s m3/s - 00-99 1 100-199 8 200-299 42 300-399 36 400-499 11 500-599 7 600-699 1 700-799 2 Total 108 Class Midpoints: are the values in the middle of the classes and can be found by adding the lower class limit to the upper class limit of the same class and dividing the sum by two Table 2.3: Frequency Table (Annual maximum flows in m3/s) Class limit Frequency Class Midpoint m3/s - m3/s 00-99 1 100-199 8 200-299 42 300-399 36 400-499 11 500-599 7 600-699 1 700-799 2 Total 108
- 5. College of Engineering Engineering Statistics Lecture notes Department of Dam & Water Resources Lecturer: Goran Adil & Chenar --------------------------------------------------------------------------------------------------------------------------------------- Frequency Distribution Chapter 2-1 16 Class Width: is the difference between two consecutive lower class limits or two consecutive class boundaries Table 2.3: Frequency Table (Annual maximum flows in m3/s) Class Width (m3/s) Class limits (m3/s) Frequency 00 99 1 100 199 8 200 299 42 300 399 36 400 499 11 500 599 7 600 699 1 700 799 2 Total 108 Class Intervals: is the difference between the upper and lower class boundaries of any class. Table 2.3: Frequency Table (Annual maximum flows in m3/s) Class Interval (m3/s) Class limits (m3/s) Frequency 00 99 1 100 199 8 200 299 42 300 399 36 400 499 11 500 599 7 600 699 1 700 799 2 Total 108 Class Width Class Interval
- 6. College of Engineering Engineering Statistics Lecture notes Department of Dam & Water Resources Lecturer: Goran Adil & Chenar --------------------------------------------------------------------------------------------------------------------------------------- Frequency Distribution Chapter 2-1 17 Rounding a numerical value means replacing it by another value that is approximately equal but has a shorter, simpler, or more explicit representation; for example, replacing £23.4476 with £23.45, or the fraction 312/937 with 1/3, or the expression √2 with 1.414. Rounding up, Rounding down Relative and Cumulative Frequency Table Table 2.3: Frequency Table (Annual maximum flows in m3/s) Class limits (m3/s) Cumulative Frequency Lower Upper Frequency Relative Frequency % Cumulative Frequency % 1 8 42 36 11 7 1 2 Total 108 100 class frequency Relative frequency sum of all frequencies
- 7. College of Engineering Engineering Statistics Lecture notes Department of Dam & Water Resources Lecturer: Goran Adil & Chenar --------------------------------------------------------------------------------------------------------------------------------------- Frequency Distribution Chapter 2-1 18 Table 2.3: Completed Frequency Table (Annual maximum flows in m3/s) Class limits Low Up Freq. Class Mid- point Lower Class Boundary Upper Class Boundary Relative Freq. % Cumulative Frequency Cumulative Frequency % Total 108
- 8. College of Engineering Engineering Statistics Lecture notes Department of Dam & Water Resources Lecturer: Goran Adil & Chenar --------------------------------------------------------------------------------------------------------------------------------------- Frequency Distribution Chapter 2-1 19 . Constructing a Frequency Table 1) Decide on the number of classes (should be between 5 and 20). Class Number : is the number of classes that we make frequency table. If it’s not limited we find it approximately by the following formula Number of Classes = 1+3.322 log N N= number of data (N between 5 to 20 is preferable). 2) Calculate Class width (round up). 3. Starting point: Begin by choose the lower limit of the first class (Choose a number equal or slightly less than the lowest number). 4. Determine the lower class limits of the successive classes by adding the class width value from step 2 to the previous lower limits successively. 5. List the lower class limits in a vertical column and proceed to enter the upper class limits. Example 2.3 Concrete cube test. The following 28-day compressive strengths, in newtons per sq –highest value lowest value class width number of classes
- 9. College of Engineering Engineering Statistics Lecture notes Department of Dam & Water Resources Lecturer: Goran Adil & Chenar --------------------------------------------------------------------------------------------------------------------------------------- Frequency Distribution Chapter 2-1 20 u]are millimeter, were obtained from test results on concrete cubes in England. The Results are shown in Table 2.4. Table 2.4: Concrete Cube Test Results 50.5 45.8 49.6 47.7 54.0 49.4 54.1 53.1 56.5 55.2 52.7 52.0 54.2 55.2 53.4 51.0 53.1 48.5 51.0 58.6 52.5 49.5 51.1 48.1 50.2 49.3 47.3 52.9 52.8 49.5 48.8 53.8 47.3 47.7 52.2 45.7 53.4 48.5 49.1 43.3 kk Table 2.3: Completed Frequency Table (Annual maximum flows in m3/s) Class limits Low Up Freq. Class Mid- point Lower Class Boundary Upper Class Boundary Relative Freq. % Annual maximum flows in m3/s Cumulative Frequency % Total 108
- 10. College of Engineering Engineering Statistics Lecture notes Department of Dam & Water Resources Lecturer: Goran Adil & Chenar --------------------------------------------------------------------------------------------------------------------------------------- Frequency Distribution Chapter 2-1 21
- 11. College of Engineering Engineering Statistics Lecture notes Department of Dam & Water Resources Lecturer: Goran Adil & Chenar --------------------------------------------------------------------------------------------------------------------------------------- Frequency Distribution Chapter 2-1 22