Ghulam Ali
Supervisor:
Prof. Dr. S. A. Siddiqi
Presenter:
Centre of Excellence in Solid State Physics
University of the Punjab, Lahore
Preparation and Characterization of
doped Multiferroic Materials
11-04-2010
Outline
oMultiferroics
oBiFeO3
oHistory
oWhy Bi0.9La0.1Fe1-xCoxO3
oExperiment
oResults and Discussion
o Conclusion
2
Multiferroic
multi ferroic
More than one
Ferromagnetic, ferr
oelectric, ferroelasti
c 3
• Multiferroic  Materials possess two or more of the following
• (Anti-)Ferromagnetism, (Anti-)Ferroelectricity,
(Anti-)Ferroelasticity
E
Hσ
M
P
ε
Magnetoelasticity
χE
χM
S
d α
Introduction to Multiferroics
•Coupling between order parameters
N. A. Spaldin and M. Fiebig, Science
309, 391 (2005).
4
Applications
Spintronics Devices (that includes a spin-based transistor)
Information Storage Devices (magnetic tape, floppy disk
etc)
Spin Valve (device consisting of two or more conducting magnetic
materials, that alternate its electrical resistance)
Quantum Electromagnets (electromagnets are wire coils or
loops, which tend to be bulky and difficult to fabricate)
Microelectronic Devices (MOSFETs, Bipolar Transistor etc)
Sensors (measures a physical quantity and converts it into a signal
which can be read by an instrument)
Spaldin N A and Fiebig M 2005 Science 309 391 5
D. Khmoski
Some common Multiferroic with their Tc, TN and Polarization
6
Among all above BiFeO3 is the only material that is
both magnetic and strong ferroelectric at room
temperature.
As a result, it has had an impact on the field of
multiferroics that is comparable to that of yttrium
barium copper oxide(YBCO) on superconductors, with
hundreds of publications devoted to it in the past few
years.
G.Catalan and J. F. Scott 2009
7
BiFeO3
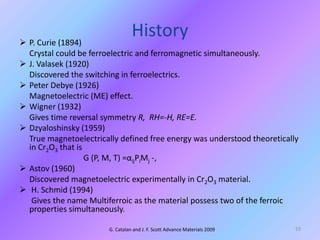
1. Distorted Rhombohedral Structure
2. Point Group R3c
3. Perovskite type unit cell with arh =
3.965Å and αrh=89.3°
4. Room temperature Polarization is
along [111]
G. catalan and F. Scot 2009
8
Fe
Bi
2P

3P

1P

4P

2P

1P

4P

3P

(001)
AFM
Ordering
FE
Ordering
Polarization points in one of
8 possible <111> directions.
Magnetic plane is
perpendicular to the
polarization direction.
P
Bi
Fe
O
M
M
BiFeO3, Polarization and Magnetization
TC ~ 1103K
TN ~ 643K
Ederer and Spaldin, PRB 71(2005)
9
History P. Curie (1894)
Crystal could be ferroelectric and ferromagnetic simultaneously.
 J. Valasek (1920)
Discovered the switching in ferroelectrics.
 Peter Debye (1926)
Magnetoelectric (ME) effect.
 Wigner (1932)
Gives time reversal symmetry R, RH=-H, RE=E.
 Dzyaloshinsky (1959)
True magnetoelectrically defined free energy was understood theoretically
in Cr2O3 that is
G (P, M, T) =αijPiMj -,
 Astov (1960)
Discovered magnetoelectric experimentally in Cr2O3 material.
 H. Schmid (1994)
Gives the name Multiferroic as the material possess two of the ferroic
properties simultaneously.
G. Catalan and J. F. Scott Advance Materials 2009 10
Why Bi0.9La0.1Fe1-xCoxO3 ?
Where x=0, 0.03, 0.05, 0.07, 0.09
11
Effect of La doping
1. La doping contents indicate that it stabilize the structure of
BiFeO3 while the mechanism for the stabilization of BiFeO3 by La
doping is not known and also leakage current can be reduced at
high applied fields by adding a small amount of La doping.
Ju Hong Miao et al J.Am.Ceram.Soc.92 (2009)
2. It was established that even a small fraction of rare-earth (La)
additives significantly increases the magnetoelectric and
magnetodielectric affects at room temperature.
A. A. Amirov et al Technical Physics Letters, 2008
12
Effect of Co doping
 The magnetic property of BiFeO3 are greatly
enhanced due to Co ions doping at Fe sites.
Yonggang Wang et al Material Letters (2008)
 The undoped BiFeO3 was antiferromagnetic but
with the subsitution of Co it becomes
ferromagnetic.
Feridoon Azough et al. Journaln of European Ceramin Society (2010)
 Addition of Co improve significantly the
ferromagnetic properties of bulk BiFeO3.
Hai-Xia Lu et. Al. Progress in Electromagnetic Research symposium, China, (2008)
13
Experimental Procedure
Sol-gel auto combustion route is adopted to
prepare BiFeO3.
Raw materials are
Fe(NO3)3.9H2O, 4BiNO3(OH)2.BiO(OH) and
La(NO3)3.6H2O.
Dissolved in 75ml of distilled water with
addition of Metal nitrate to Glysin in 1:1
14
Sol gel auto-combustion method
 Sol-gel auto-combustion method is one of the most
widely used methods to prepare the BFO like materials.
 Citric acid, glycine or urea is used as fuel agent in this
chemical reaction method.
15
 Self-purification due to the high
exothermic temperatures involvement.
 To obtain the products in the desired size
and shape.
 Simple and cost effective.
 To get the homogeneous and very fine
crystalline nano-powders.
 Synthesis of single phase materials at very low
temperatures and short reaction times.
Experimental
Pure and Co doped Bi0.9La0.1FeO3 (Bi0.9La0.1Fe1-xCoxO3, x = 0, 0.03, 0.05, 0.07, 0.09) samples
were synthesized using sol gel auto-combustion method. Lanthanum nitrate, bismuth
subnitrate, and iron nitrate were taken in appropriate ratios.
4BiNO3
(OH)2.Bi(OH)
Fe(NO3). 9H2O
Mixedsolutionin
deionizedwater
Glycine
Heatedona hot plate at 120-
1300Cwithmagnetic stirring
Viscous gel
Combustion
Fluffypowderis
heatedfor30
minutes at 1300
C
La(NO3)3.
6H2O
Flow chart of
experimental
method
16
Results and
Discussions
17
The phase identification in powder form was performed on an
X-ray diffractometer (X’PERT PRO of PANalytical
Company Ltd., Holland) with Cu Kα radiation.
 Fig. 1 shows the XRD pattern of Bi0.9La0.1Fe1-xCoxO3 (x =
0, 0.03, 0.05, 0.07, 0.09) samples.
 No impurity phase was detected in the composition
with x = 0.
 The only peak observed for Bi2Fe4O9 impurity phase
has been marked by (*) on these diffraction patterns.
18
Figure 1 XRD patterns of all compounds of Bi0.9La0.1Fe1-XCoXO3 (for x = 0, 0. 03, 0.05, 0.07, 0.09). The
impurity phase (Bi2Fe4O9) peak is marked with *.
The hkl values of Bi0.9La0.1FeO3 were matched with X.Zheng et al. J.of Alloy and Compound 499(2010)
20 30 40 50 60 70
220
208
300
214018
122
116
024
202
110
104
Intensity(arb.units)
2 (Degree)
X = 0012
19
20 30 40 50 60 70
Intensity(arb.units)
2 (Degree)
X = 0.03
20 30 40 50 60 70
Intensity(arb.units)
2 (Degree)
X = 0.05
20 30 40 50 60 70
Intensity(arb.units)
2 (Degree)
X = 0.07
20 30 40 50 60 70
Intensity(arb.units)
2 (Degree)
X = 0.09
Calculation of Crystallite Size
• The crystallite size is calculated by Scherrer formula which is
t =kλ/BcosѲB and instrumental broadening is not subtracted.
• where, k is constant with value 0.94, λ is wavelength with
1.542Å, B is full width half maximum and ѲB is Bragg angle.
20
Figure 2 Crystallite size (in nanometer) versus doping concentration with X = 0, 3,5,7,9 percent.
-1 0 1 2 3 4 5 6 7 8 9 10
18
20
Crystallitesize(nm)
Doping concentration in %
The lattice parameters “a” and “c” of the hexagonal unit cell were
calculated using the equation
Sin2θ = λ2/3a2(h2 + hk + k2) +λ2l2 /4c2
The strongest peaks (012) and (110) were employed for such
calculations.
The lattice parameters a and c, the volume of hexagonal unit cell V, and
the ratio c/a are listed in Table 4.1 and are in good agreement with
values reported by X.Zheng et al. J. of Alloy and Compound 499(2010)
.
Compositions a(Å) c(Å) c/a V(Å3)
Bi0.9La0.1FeO3 5.5872 13.7077 2.4534 370.5706
Bi0.9La0.1Fe0.97Co0.03 O3 5.6601 13.8359 2.4445 383.8606
Bi0.9La0.1Fe0.95Co0.05 O3 5.7309 13.5610 2.3663 385.705
Bi0.9La0.1Fe0.93Co0.07 O3 5.7166 13.7134 2.3989 388.0955
Bi0.9La0.1Fe0.91Co0.09 O3 5.7149 13.7576 2.4073 389.1149
Table 1 Lattice parameters (a, c), ratio c/a, and volume of hexagonal unit cell is shown for the
samples of Bi0.9La0.1Fe1-XCoXO3 (for x = 0, 0. 03, 0.05, 0.07, 0.09). 21
MAGNETIZATION MEASUREMENT
Magnetic properties were investigated using Lake Shore-7407, vibrating sample
magnetometer
-5000 -2500 0 2500 5000
-4
-2
0
2
4
Magnetization(emu/g)
Magnetic field (Oe)
x = 0
x = 0.03
x = 0.05
x = 0.07
x = 0.09
M-H loops of Bi0.9La0.1Fe1-XCoXO3 (for x = 0, 0.03, 0.05, 0.07, 0.09) samples.
For undoped sample
Ms = 0.98 emu/g and
Hc = 57 Oe
For x = 0.09
Ms = 4.18 emu/g and
Hc = 220 Oe
22
17.5 18.0 18.5 19.0 19.5 20.0
0.5
1.0
1.5
2.0
2.5
3.0
3.5
4.0
4.5
Ms
(emu/g)
Estimated crystallite size (nm)
Saturation magnetization plotted against
estimated crystallite size of Bi0.9La0.1Fe1-
XCoXO3 (for x = 0.09, 0.07, 0.05, 0.03, 0)
samples respectively
Saturation
magnetization
increases with the
decrease of
crystallite size.
The saturation
magnetization also
increases with the
concentration of
cobalt which is in
good agreement as
reported in
literature.
23
Microstructural analysis of Bi0.9La0.1Fe1-XCoXO3 (for x =
0, 0.03, 0.05, 0.07, 0.09) samples were carried out by using
S-3400N SEM HITACHI EMAX scanning electron microscope
operated at 30.00kV in its secondary electron image mode.
24
Figure 3: SEM images of the Bi0.9La0.1Fe1-xCoxO3 (x =
0, 0.03, 0.05, 0.07, 0.09) samples at magnification of 5.00 × K.
25
The morphology of all these samples
is almost similar. Two types of grains
can easily be identified. Larger
volume of the sample comprises of
the larger sized well shaped grains
( ~ 5 μm) and a small proportion of
grains consists of well defined
shaped equi-axed crystals with
0.5 μm size.
Dielectric constant, loss factor, and tangent loss measurements of
Bi0.9La0.1Fe1-XCoXO3 series have been carried out in the frequency range
from 20 Hz to 1M Hz at room temperature by using 1920 Precision LCR
Meter manufactured by QuadTech.
10k 100k 1M
0
50
100
150
200
250
300
350
400
450
500
550
Dielectriccostant(
/
)
log f (Hz)
X = 0.09
X = 0.07
X = 0.05
X = 0.03
X = 0
(a)
10k 100k 1M
0
20
40
Tangentofdielectriclossangle(tan)
log f (Hz)
X = 0.09
X = 0.07
X = 0.05
X = 0.03
X = 0
(b)
10k 100k 1M
0
1000
2000
3000
4000
5000
6000
7000
Dielectriclossfactor(
//
)
log f (Hz)
X = 0.09
X = 0.07
X = 0.05
X = 0.03
X = 0
(c)
Figure 4 (a) Dielectric constant (ε'), (b)
Tangent of dielectric loss angle (Tanδ), and
(c) Dielectric loss factor (ε'') are shown
against log f (Hz). Colored lines with
different symbols shows different
concentration as mentioned in small box on
the top-right of the figures.
26
The temperature dependent DC electrical resistivity of the
Bi0.9La0.1Fe1-XCoXO3 (for x = 0, 0. 03, 0.05, 0.07, 0.09) samples was
evaluated by using a Two Point Probe set up.
150 200 250 300 350
0.0
2.0x10
3
4.0x10
3
6.0x10
3
8.0x10
3
Resistivity(M-cm)
Temperature ( C)
x = 0
x = 0.03
x = 0.05
x = 0.07
x = 0.09
Compositions Volume resistivity (Ω-
cm)
Bi0.9La0.1FeO3 1.6333 x 10⁹
Bi0.9La0.1Fe0.97Co0.03 O3 4.3556 x 10⁸
Bi0.9La0.1Fe0.95Co0.05 O3 9.1467 x 10⁸
Bi0.9La0.1Fe0.93Co0.07 O3 1.2815 x 10⁹
Bi0.9La0.1Fe0.91Co0.09 O3 9.0462 x 10⁸
Table 2: Volume
resistivity (Ω-cm) of
samples Bi0.9La0.1Fe1-
XCoXO3 (for x = 0, 0.
03, 0.05, 0.07, 0.09)
at room temperature.
Figure 4.6 Resistivity (MΩ-cm) against temperature (˚C) of
the samples Bi0.9La0.1Fe1-XCoXO3 (for x = 0, 0.
03, 0.05, 0.07, 0.09). 27
In order to study the Ferroelectric behavior of Co doped Bi0.9La0.1FeO3 multiferroic, manually designed
Sawyer-Tower circuit was used to measure ferroelectric hysteresis loop. All the measurements were taken at
room temperature and a maximum of 100KV/m field was applied. Hysteresis loops for Bi0.9La0.1Fe1-xCoxO3 (x
= 0, 0.03, 0.05, 0.07, 0.09) are shown in Figure 6.
28
Figure 6 P-E loops for Bi0.9La0.1Fe1-xCoxO3 (x = 0, 0.03, 0.05, 0.07, 0.09) samples and table with
Coercive field and Saturation Polarization.
Compositions Coercive field
Ec (KV/m)
Saturation polarization
(μC.cm-2)
Bi0.9La0.1FeO3 49 0.0508
Bi0.9La0.1Fe0.97Co0.03 O3 55 0.0184
Bi0.9La0.1Fe0.95Co0.05 O3 80 0.0393
Bi0.9La0.1Fe0.93Co0.07 O3 45 0.0246
Bi0.9La0.1Fe0.91Co0.09 O3 73 0.0477
Conclusion
29
An impurity phase of Bi2Fe4O9 was detected in all the Co doped
compositions.
Lattice parameters and crystallite size were significantly changed
with the substitution of Co at the Fe sites.
For x = 0, the estimated crystallite size was 19.76 nm, decreases
with cobalt concentration and for x = 0.09, it became 17.58 nm.
The saturation magnetization and coercive field for undoped
sample was observed as low as Ms = 0.98 emu/g and Hc = 57 Oe
respectively and both these saturation magnetization and coercive
field increases with cobalt concentration and becomes Ms = 4.18
emu/g and Hc = 220 Oe for x = 0.09.
30
The dielectric constant for undoped sample is found 540 at log
2, decreases with the increase in frequency and becomes 148 at log
5.5.
The dielectric constant also decreases with increasing cobalt
concentration and found 312 at log 2 for x = 0.09 composition and
then decreases with frequency and becomes 11.93 at log 5.5.
The un-doped sample showed a maximum value of resistivity of
8.40 109 Ω-cm at 160˚C, which decreased gradually with the
increase in temperature and became 1.11 x 10⁶ Ω-cm at a
temperature of 350 ˚C.
The values of resistivity were decreased as the amount of Co
contents was increased and becomes 0.16 109 Ω-cm at 160˚C for
x = 0.09.
P-E loops provide a clear indication of the ferroelectric behavior
of the both undoped and Co doped Bi0.9La0.1FeO3.
The saturation polarization has been found maximum for un-
doped sample (0.0508 μC.cm-2) which is very low compared to the
literature.
THANK YOU
31

Multiferroic materials

  • 1.
    Ghulam Ali Supervisor: Prof. Dr.S. A. Siddiqi Presenter: Centre of Excellence in Solid State Physics University of the Punjab, Lahore Preparation and Characterization of doped Multiferroic Materials 11-04-2010
  • 2.
  • 3.
    Multiferroic multi ferroic More thanone Ferromagnetic, ferr oelectric, ferroelasti c 3
  • 4.
    • Multiferroic Materials possess two or more of the following • (Anti-)Ferromagnetism, (Anti-)Ferroelectricity, (Anti-)Ferroelasticity E Hσ M P ε Magnetoelasticity χE χM S d α Introduction to Multiferroics •Coupling between order parameters N. A. Spaldin and M. Fiebig, Science 309, 391 (2005). 4
  • 5.
    Applications Spintronics Devices (thatincludes a spin-based transistor) Information Storage Devices (magnetic tape, floppy disk etc) Spin Valve (device consisting of two or more conducting magnetic materials, that alternate its electrical resistance) Quantum Electromagnets (electromagnets are wire coils or loops, which tend to be bulky and difficult to fabricate) Microelectronic Devices (MOSFETs, Bipolar Transistor etc) Sensors (measures a physical quantity and converts it into a signal which can be read by an instrument) Spaldin N A and Fiebig M 2005 Science 309 391 5
  • 6.
    D. Khmoski Some commonMultiferroic with their Tc, TN and Polarization 6
  • 7.
    Among all aboveBiFeO3 is the only material that is both magnetic and strong ferroelectric at room temperature. As a result, it has had an impact on the field of multiferroics that is comparable to that of yttrium barium copper oxide(YBCO) on superconductors, with hundreds of publications devoted to it in the past few years. G.Catalan and J. F. Scott 2009 7
  • 8.
    BiFeO3 1. Distorted RhombohedralStructure 2. Point Group R3c 3. Perovskite type unit cell with arh = 3.965Å and αrh=89.3° 4. Room temperature Polarization is along [111] G. catalan and F. Scot 2009 8
  • 9.
    Fe Bi 2P  3P  1P  4P  2P  1P  4P  3P  (001) AFM Ordering FE Ordering Polarization points inone of 8 possible <111> directions. Magnetic plane is perpendicular to the polarization direction. P Bi Fe O M M BiFeO3, Polarization and Magnetization TC ~ 1103K TN ~ 643K Ederer and Spaldin, PRB 71(2005) 9
  • 10.
    History P. Curie(1894) Crystal could be ferroelectric and ferromagnetic simultaneously.  J. Valasek (1920) Discovered the switching in ferroelectrics.  Peter Debye (1926) Magnetoelectric (ME) effect.  Wigner (1932) Gives time reversal symmetry R, RH=-H, RE=E.  Dzyaloshinsky (1959) True magnetoelectrically defined free energy was understood theoretically in Cr2O3 that is G (P, M, T) =αijPiMj -,  Astov (1960) Discovered magnetoelectric experimentally in Cr2O3 material.  H. Schmid (1994) Gives the name Multiferroic as the material possess two of the ferroic properties simultaneously. G. Catalan and J. F. Scott Advance Materials 2009 10
  • 11.
    Why Bi0.9La0.1Fe1-xCoxO3 ? Wherex=0, 0.03, 0.05, 0.07, 0.09 11
  • 12.
    Effect of Ladoping 1. La doping contents indicate that it stabilize the structure of BiFeO3 while the mechanism for the stabilization of BiFeO3 by La doping is not known and also leakage current can be reduced at high applied fields by adding a small amount of La doping. Ju Hong Miao et al J.Am.Ceram.Soc.92 (2009) 2. It was established that even a small fraction of rare-earth (La) additives significantly increases the magnetoelectric and magnetodielectric affects at room temperature. A. A. Amirov et al Technical Physics Letters, 2008 12
  • 13.
    Effect of Codoping  The magnetic property of BiFeO3 are greatly enhanced due to Co ions doping at Fe sites. Yonggang Wang et al Material Letters (2008)  The undoped BiFeO3 was antiferromagnetic but with the subsitution of Co it becomes ferromagnetic. Feridoon Azough et al. Journaln of European Ceramin Society (2010)  Addition of Co improve significantly the ferromagnetic properties of bulk BiFeO3. Hai-Xia Lu et. Al. Progress in Electromagnetic Research symposium, China, (2008) 13
  • 14.
    Experimental Procedure Sol-gel autocombustion route is adopted to prepare BiFeO3. Raw materials are Fe(NO3)3.9H2O, 4BiNO3(OH)2.BiO(OH) and La(NO3)3.6H2O. Dissolved in 75ml of distilled water with addition of Metal nitrate to Glysin in 1:1 14
  • 15.
    Sol gel auto-combustionmethod  Sol-gel auto-combustion method is one of the most widely used methods to prepare the BFO like materials.  Citric acid, glycine or urea is used as fuel agent in this chemical reaction method. 15  Self-purification due to the high exothermic temperatures involvement.  To obtain the products in the desired size and shape.  Simple and cost effective.  To get the homogeneous and very fine crystalline nano-powders.  Synthesis of single phase materials at very low temperatures and short reaction times.
  • 16.
    Experimental Pure and Codoped Bi0.9La0.1FeO3 (Bi0.9La0.1Fe1-xCoxO3, x = 0, 0.03, 0.05, 0.07, 0.09) samples were synthesized using sol gel auto-combustion method. Lanthanum nitrate, bismuth subnitrate, and iron nitrate were taken in appropriate ratios. 4BiNO3 (OH)2.Bi(OH) Fe(NO3). 9H2O Mixedsolutionin deionizedwater Glycine Heatedona hot plate at 120- 1300Cwithmagnetic stirring Viscous gel Combustion Fluffypowderis heatedfor30 minutes at 1300 C La(NO3)3. 6H2O Flow chart of experimental method 16
  • 17.
  • 18.
    The phase identificationin powder form was performed on an X-ray diffractometer (X’PERT PRO of PANalytical Company Ltd., Holland) with Cu Kα radiation.  Fig. 1 shows the XRD pattern of Bi0.9La0.1Fe1-xCoxO3 (x = 0, 0.03, 0.05, 0.07, 0.09) samples.  No impurity phase was detected in the composition with x = 0.  The only peak observed for Bi2Fe4O9 impurity phase has been marked by (*) on these diffraction patterns. 18
  • 19.
    Figure 1 XRDpatterns of all compounds of Bi0.9La0.1Fe1-XCoXO3 (for x = 0, 0. 03, 0.05, 0.07, 0.09). The impurity phase (Bi2Fe4O9) peak is marked with *. The hkl values of Bi0.9La0.1FeO3 were matched with X.Zheng et al. J.of Alloy and Compound 499(2010) 20 30 40 50 60 70 220 208 300 214018 122 116 024 202 110 104 Intensity(arb.units) 2 (Degree) X = 0012 19 20 30 40 50 60 70 Intensity(arb.units) 2 (Degree) X = 0.03 20 30 40 50 60 70 Intensity(arb.units) 2 (Degree) X = 0.05 20 30 40 50 60 70 Intensity(arb.units) 2 (Degree) X = 0.07 20 30 40 50 60 70 Intensity(arb.units) 2 (Degree) X = 0.09
  • 20.
    Calculation of CrystalliteSize • The crystallite size is calculated by Scherrer formula which is t =kλ/BcosѲB and instrumental broadening is not subtracted. • where, k is constant with value 0.94, λ is wavelength with 1.542Å, B is full width half maximum and ѲB is Bragg angle. 20 Figure 2 Crystallite size (in nanometer) versus doping concentration with X = 0, 3,5,7,9 percent. -1 0 1 2 3 4 5 6 7 8 9 10 18 20 Crystallitesize(nm) Doping concentration in %
  • 21.
    The lattice parameters“a” and “c” of the hexagonal unit cell were calculated using the equation Sin2θ = λ2/3a2(h2 + hk + k2) +λ2l2 /4c2 The strongest peaks (012) and (110) were employed for such calculations. The lattice parameters a and c, the volume of hexagonal unit cell V, and the ratio c/a are listed in Table 4.1 and are in good agreement with values reported by X.Zheng et al. J. of Alloy and Compound 499(2010) . Compositions a(Å) c(Å) c/a V(Å3) Bi0.9La0.1FeO3 5.5872 13.7077 2.4534 370.5706 Bi0.9La0.1Fe0.97Co0.03 O3 5.6601 13.8359 2.4445 383.8606 Bi0.9La0.1Fe0.95Co0.05 O3 5.7309 13.5610 2.3663 385.705 Bi0.9La0.1Fe0.93Co0.07 O3 5.7166 13.7134 2.3989 388.0955 Bi0.9La0.1Fe0.91Co0.09 O3 5.7149 13.7576 2.4073 389.1149 Table 1 Lattice parameters (a, c), ratio c/a, and volume of hexagonal unit cell is shown for the samples of Bi0.9La0.1Fe1-XCoXO3 (for x = 0, 0. 03, 0.05, 0.07, 0.09). 21
  • 22.
    MAGNETIZATION MEASUREMENT Magnetic propertieswere investigated using Lake Shore-7407, vibrating sample magnetometer -5000 -2500 0 2500 5000 -4 -2 0 2 4 Magnetization(emu/g) Magnetic field (Oe) x = 0 x = 0.03 x = 0.05 x = 0.07 x = 0.09 M-H loops of Bi0.9La0.1Fe1-XCoXO3 (for x = 0, 0.03, 0.05, 0.07, 0.09) samples. For undoped sample Ms = 0.98 emu/g and Hc = 57 Oe For x = 0.09 Ms = 4.18 emu/g and Hc = 220 Oe 22
  • 23.
    17.5 18.0 18.519.0 19.5 20.0 0.5 1.0 1.5 2.0 2.5 3.0 3.5 4.0 4.5 Ms (emu/g) Estimated crystallite size (nm) Saturation magnetization plotted against estimated crystallite size of Bi0.9La0.1Fe1- XCoXO3 (for x = 0.09, 0.07, 0.05, 0.03, 0) samples respectively Saturation magnetization increases with the decrease of crystallite size. The saturation magnetization also increases with the concentration of cobalt which is in good agreement as reported in literature. 23
  • 24.
    Microstructural analysis ofBi0.9La0.1Fe1-XCoXO3 (for x = 0, 0.03, 0.05, 0.07, 0.09) samples were carried out by using S-3400N SEM HITACHI EMAX scanning electron microscope operated at 30.00kV in its secondary electron image mode. 24 Figure 3: SEM images of the Bi0.9La0.1Fe1-xCoxO3 (x = 0, 0.03, 0.05, 0.07, 0.09) samples at magnification of 5.00 × K.
  • 25.
    25 The morphology ofall these samples is almost similar. Two types of grains can easily be identified. Larger volume of the sample comprises of the larger sized well shaped grains ( ~ 5 μm) and a small proportion of grains consists of well defined shaped equi-axed crystals with 0.5 μm size.
  • 26.
    Dielectric constant, lossfactor, and tangent loss measurements of Bi0.9La0.1Fe1-XCoXO3 series have been carried out in the frequency range from 20 Hz to 1M Hz at room temperature by using 1920 Precision LCR Meter manufactured by QuadTech. 10k 100k 1M 0 50 100 150 200 250 300 350 400 450 500 550 Dielectriccostant( / ) log f (Hz) X = 0.09 X = 0.07 X = 0.05 X = 0.03 X = 0 (a) 10k 100k 1M 0 20 40 Tangentofdielectriclossangle(tan) log f (Hz) X = 0.09 X = 0.07 X = 0.05 X = 0.03 X = 0 (b) 10k 100k 1M 0 1000 2000 3000 4000 5000 6000 7000 Dielectriclossfactor( // ) log f (Hz) X = 0.09 X = 0.07 X = 0.05 X = 0.03 X = 0 (c) Figure 4 (a) Dielectric constant (ε'), (b) Tangent of dielectric loss angle (Tanδ), and (c) Dielectric loss factor (ε'') are shown against log f (Hz). Colored lines with different symbols shows different concentration as mentioned in small box on the top-right of the figures. 26
  • 27.
    The temperature dependentDC electrical resistivity of the Bi0.9La0.1Fe1-XCoXO3 (for x = 0, 0. 03, 0.05, 0.07, 0.09) samples was evaluated by using a Two Point Probe set up. 150 200 250 300 350 0.0 2.0x10 3 4.0x10 3 6.0x10 3 8.0x10 3 Resistivity(M-cm) Temperature ( C) x = 0 x = 0.03 x = 0.05 x = 0.07 x = 0.09 Compositions Volume resistivity (Ω- cm) Bi0.9La0.1FeO3 1.6333 x 10⁹ Bi0.9La0.1Fe0.97Co0.03 O3 4.3556 x 10⁸ Bi0.9La0.1Fe0.95Co0.05 O3 9.1467 x 10⁸ Bi0.9La0.1Fe0.93Co0.07 O3 1.2815 x 10⁹ Bi0.9La0.1Fe0.91Co0.09 O3 9.0462 x 10⁸ Table 2: Volume resistivity (Ω-cm) of samples Bi0.9La0.1Fe1- XCoXO3 (for x = 0, 0. 03, 0.05, 0.07, 0.09) at room temperature. Figure 4.6 Resistivity (MΩ-cm) against temperature (˚C) of the samples Bi0.9La0.1Fe1-XCoXO3 (for x = 0, 0. 03, 0.05, 0.07, 0.09). 27
  • 28.
    In order tostudy the Ferroelectric behavior of Co doped Bi0.9La0.1FeO3 multiferroic, manually designed Sawyer-Tower circuit was used to measure ferroelectric hysteresis loop. All the measurements were taken at room temperature and a maximum of 100KV/m field was applied. Hysteresis loops for Bi0.9La0.1Fe1-xCoxO3 (x = 0, 0.03, 0.05, 0.07, 0.09) are shown in Figure 6. 28 Figure 6 P-E loops for Bi0.9La0.1Fe1-xCoxO3 (x = 0, 0.03, 0.05, 0.07, 0.09) samples and table with Coercive field and Saturation Polarization. Compositions Coercive field Ec (KV/m) Saturation polarization (μC.cm-2) Bi0.9La0.1FeO3 49 0.0508 Bi0.9La0.1Fe0.97Co0.03 O3 55 0.0184 Bi0.9La0.1Fe0.95Co0.05 O3 80 0.0393 Bi0.9La0.1Fe0.93Co0.07 O3 45 0.0246 Bi0.9La0.1Fe0.91Co0.09 O3 73 0.0477
  • 29.
    Conclusion 29 An impurity phaseof Bi2Fe4O9 was detected in all the Co doped compositions. Lattice parameters and crystallite size were significantly changed with the substitution of Co at the Fe sites. For x = 0, the estimated crystallite size was 19.76 nm, decreases with cobalt concentration and for x = 0.09, it became 17.58 nm. The saturation magnetization and coercive field for undoped sample was observed as low as Ms = 0.98 emu/g and Hc = 57 Oe respectively and both these saturation magnetization and coercive field increases with cobalt concentration and becomes Ms = 4.18 emu/g and Hc = 220 Oe for x = 0.09.
  • 30.
    30 The dielectric constantfor undoped sample is found 540 at log 2, decreases with the increase in frequency and becomes 148 at log 5.5. The dielectric constant also decreases with increasing cobalt concentration and found 312 at log 2 for x = 0.09 composition and then decreases with frequency and becomes 11.93 at log 5.5. The un-doped sample showed a maximum value of resistivity of 8.40 109 Ω-cm at 160˚C, which decreased gradually with the increase in temperature and became 1.11 x 10⁶ Ω-cm at a temperature of 350 ˚C. The values of resistivity were decreased as the amount of Co contents was increased and becomes 0.16 109 Ω-cm at 160˚C for x = 0.09. P-E loops provide a clear indication of the ferroelectric behavior of the both undoped and Co doped Bi0.9La0.1FeO3. The saturation polarization has been found maximum for un- doped sample (0.0508 μC.cm-2) which is very low compared to the literature.
  • 31.