Download to read offline
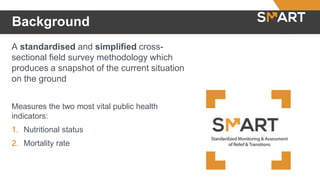

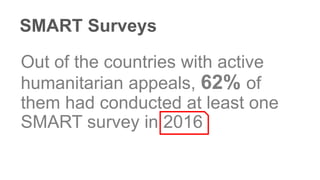
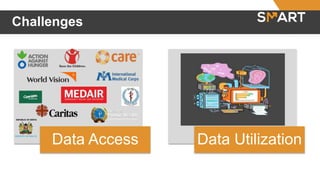
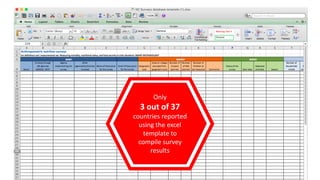
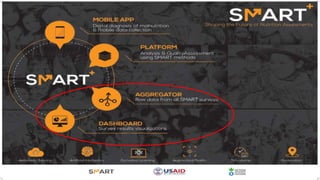
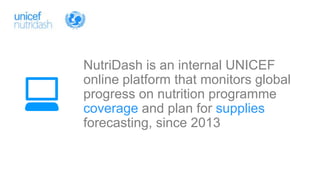
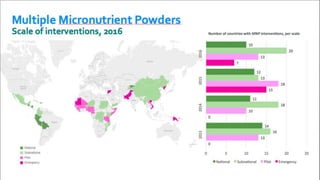
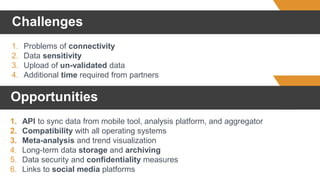

This document discusses global nutrition monitoring efforts. Standardized surveys called SMART surveys measure key indicators like nutritional status and mortality rates in countries with humanitarian crises. In 2016, 62% of countries with humanitarian appeals conducted at least one SMART survey. However, challenges remain around data access and utilization, as only 3 out of 37 countries reported using standardized templates to compile and share survey results. An internal UNICEF platform called NutriDash has monitored nutrition program coverage and supply planning since 2013, but faces challenges regarding data connectivity, sensitivity, validation, and integration with other systems and platforms. Opportunities exist to improve data synchronization, analysis, visualization, storage, and security.