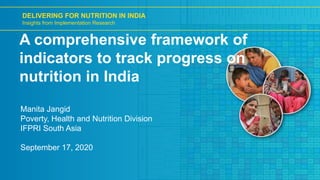
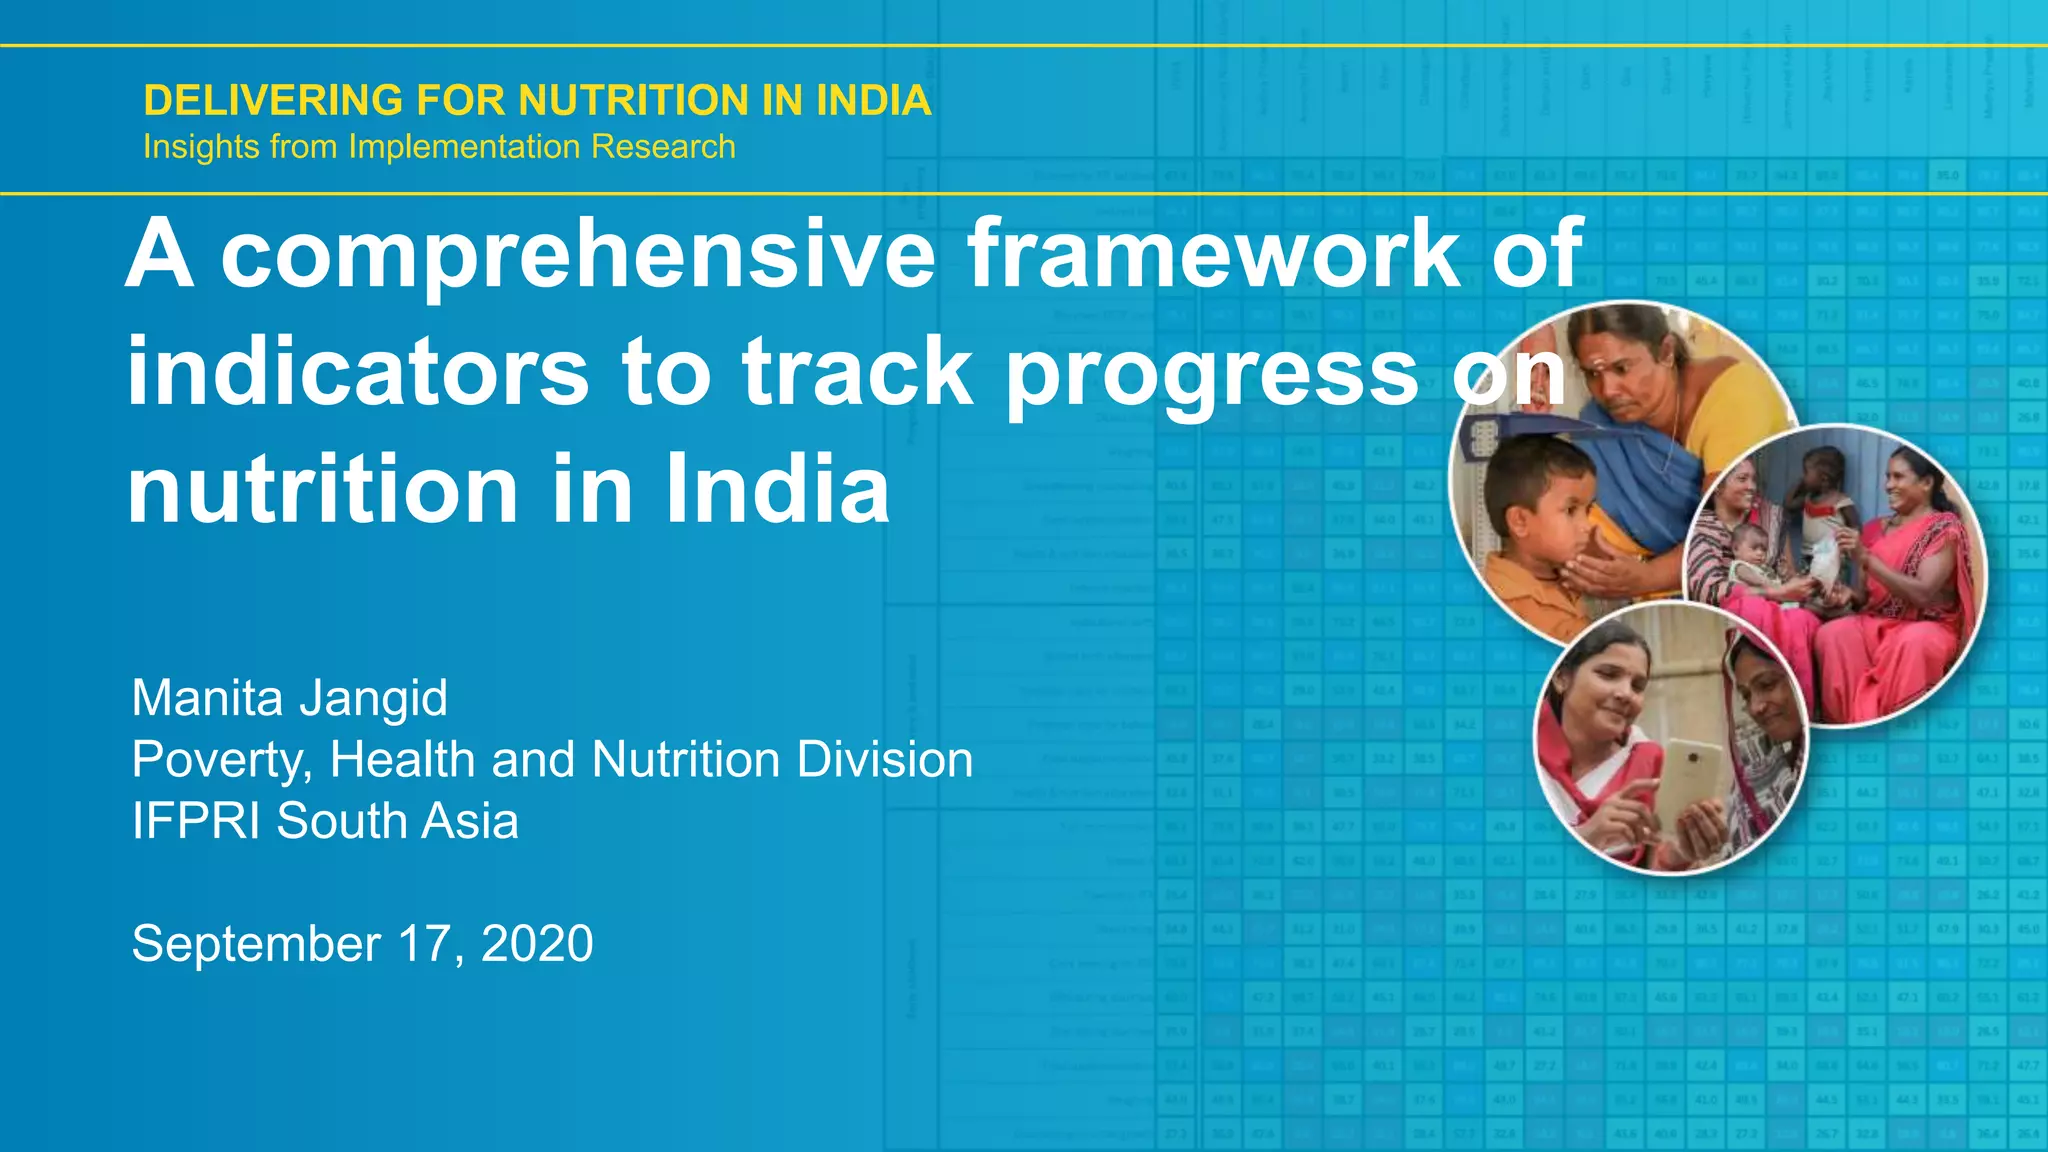
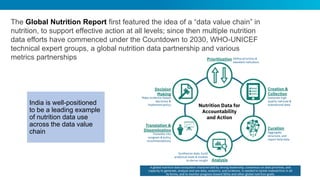
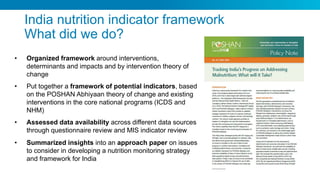
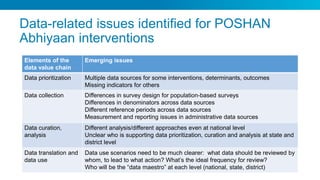
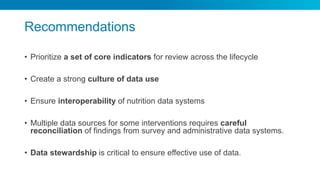
DELIVERING FOR NUTRITION IN INDIA
Insights from Implementation Research
A comprehensive framework of
indicators to track progress on
nutrition in India
Manita Jangid
Poverty, Health and Nutrition Division
IFPRI South Asia
September 17, 2020
The Global Nutrition Report first featured the idea of a ā€œdata value chainā€ in
nutrition, to support effective action at all levels; since then multiple nutrition
data efforts have commenced under the Countdown to 2030, WHO-UNICEF
technical expert groups, a global nutrition data partnership and various
metrics partnerships
India is well-positioned
to be a leading example
of nutrition data use
across the data value
chain
What are some uses of data in India’s
nutrition efforts?
Tracking progress,
reporting & assessing
impact
• Interventions
• Immediate determinants
• Underlying determinants
• Outcomes
Using data for strategy
refinement at different
levels
• Intervention reach,
convergence, continuity
• Immediate determinants
• Underlying determinants
• Outcomes
Using data for program
refinements
• Intervention inputs (HR,
supplies, etc.)
• Intervention reach,
quality, continuity,
uptake
• Convergence of different
interventions
Review mechanisms/groups for POSHAN Abhiyaan exist but guidance for effective data use at
multiple levels is currently limited
Population-based household
surveys
• National Family Health Surveys (NFHS)
• Comprehensive National Nutrition Survey
(CNNS)
• Surveys conducted by NIN, IDInsight, Tata
Trusts and others
• New POSHAN Abhiyaan survey being
planned/designed
Administrative data systems
• Data systems from the core ministries and
departments – national and state-specific
• ICDS (MPR, CAS)
• NHM (HMIS)
• Other sectors
• POSHAN Abhiyaan dashboards (Jan
Andolan, governance, other)
Data aplenty: how to bring data together for
relevant progress tracking and to create insights
for action?
Key question: How to ensure availability of data on relevant indicators to assess coverage, determinants and
outcomes and to do so in time frames and geographic representativeness that are meaningful?
India nutrition indicator framework
What did we do?
• Organized framework around interventions,
determinants and impacts and by intervention theory of
change
• Put together a framework of potential indicators, based
on the POSHAN Abhiyaan theory of change and existing
interventions in the core national programs (ICDS and
NHM)
• Assessed data availability across different data sources
through questionnaire review and MIS indicator review
• Summarized insights into an approach paper on issues
to consider in developing a nutrition monitoring strategy
and framework for India
• Of the 55 interventions, six interventions had data
across all data sources.
• For nine interventions, no data was available
from any source. For the remaining 46
interventions, data is available from at least one
data source.
• Surveys had data on 36 interventions and
administrative systems had data on 42
interventions.
• Data definitions and denominators vary by
source, making comparisons challenging.
What did we find?
Figure: Interventions, immediate and underlying determinants targeted by POSHAN Abhiyaan
• For adolescents, coverage data is scarce
• For pregnancy, multiple data sources are
available on antenatal care
• For delivery and postnatal care, data is
available on institutional deliveries and
postnatal care
• Data is very limited for newborn care
• For early childhood, 9 of 13 interventions
are available from different data sources.
Data availability across life stages
Table: Potential indicators and data availability on interventions during adolescence
Data-related issues identified for POSHAN
Abhiyaan interventions
Elements of the
data value chain
Emerging issues
Data prioritization Multiple data sources for some interventions, determinants, outcomes
Missing indicators for others
Data collection Differences in survey design for population-based surveys
Differences in denominators across data sources
Different reference periods across data sources
Measurement and reporting issues in administrative data sources
Data curation,
analysis
Different analysis/different approaches even at national level
Unclear who is supporting data prioritization, curation and analysis at state and
district level
Data translation and
data use
Data use scenarios need to be much clearer: what data should be reviewed by
whom, to lead to what action? What’s the ideal frequency for review?
Who will be the ā€œdata maestroā€ at each level (national, state, district)
• Prioritize a set of core indicators for review across the lifecycle
• Create a strong culture of data use
• Ensure interoperability of nutrition data systems
• Multiple data sources for some interventions requires careful
reconciliation of findings from survey and administrative data systems.
• Data stewardship is critical to ensure effective use of data.
Recommendations

A comprehensive framework of indicators to track progress on nutrition in India; Manita Jangid, IFPRI

  • 1.
    DELIVERING FOR NUTRITIONIN INDIA Insights from Implementation Research A comprehensive framework of indicators to track progress on nutrition in India Manita Jangid Poverty, Health and Nutrition Division IFPRI South Asia September 17, 2020
  • 2.
    The Global NutritionReport first featured the idea of a ā€œdata value chainā€ in nutrition, to support effective action at all levels; since then multiple nutrition data efforts have commenced under the Countdown to 2030, WHO-UNICEF technical expert groups, a global nutrition data partnership and various metrics partnerships India is well-positioned to be a leading example of nutrition data use across the data value chain
  • 3.
    What are someuses of data in India’s nutrition efforts? Tracking progress, reporting & assessing impact • Interventions • Immediate determinants • Underlying determinants • Outcomes Using data for strategy refinement at different levels • Intervention reach, convergence, continuity • Immediate determinants • Underlying determinants • Outcomes Using data for program refinements • Intervention inputs (HR, supplies, etc.) • Intervention reach, quality, continuity, uptake • Convergence of different interventions Review mechanisms/groups for POSHAN Abhiyaan exist but guidance for effective data use at multiple levels is currently limited
  • 4.
    Population-based household surveys • NationalFamily Health Surveys (NFHS) • Comprehensive National Nutrition Survey (CNNS) • Surveys conducted by NIN, IDInsight, Tata Trusts and others • New POSHAN Abhiyaan survey being planned/designed Administrative data systems • Data systems from the core ministries and departments – national and state-specific • ICDS (MPR, CAS) • NHM (HMIS) • Other sectors • POSHAN Abhiyaan dashboards (Jan Andolan, governance, other) Data aplenty: how to bring data together for relevant progress tracking and to create insights for action? Key question: How to ensure availability of data on relevant indicators to assess coverage, determinants and outcomes and to do so in time frames and geographic representativeness that are meaningful?
  • 5.
    India nutrition indicatorframework What did we do? • Organized framework around interventions, determinants and impacts and by intervention theory of change • Put together a framework of potential indicators, based on the POSHAN Abhiyaan theory of change and existing interventions in the core national programs (ICDS and NHM) • Assessed data availability across different data sources through questionnaire review and MIS indicator review • Summarized insights into an approach paper on issues to consider in developing a nutrition monitoring strategy and framework for India
  • 6.
    • Of the55 interventions, six interventions had data across all data sources. • For nine interventions, no data was available from any source. For the remaining 46 interventions, data is available from at least one data source. • Surveys had data on 36 interventions and administrative systems had data on 42 interventions. • Data definitions and denominators vary by source, making comparisons challenging. What did we find? Figure: Interventions, immediate and underlying determinants targeted by POSHAN Abhiyaan
  • 7.
    • For adolescents,coverage data is scarce • For pregnancy, multiple data sources are available on antenatal care • For delivery and postnatal care, data is available on institutional deliveries and postnatal care • Data is very limited for newborn care • For early childhood, 9 of 13 interventions are available from different data sources. Data availability across life stages Table: Potential indicators and data availability on interventions during adolescence
  • 8.
    Data-related issues identifiedfor POSHAN Abhiyaan interventions Elements of the data value chain Emerging issues Data prioritization Multiple data sources for some interventions, determinants, outcomes Missing indicators for others Data collection Differences in survey design for population-based surveys Differences in denominators across data sources Different reference periods across data sources Measurement and reporting issues in administrative data sources Data curation, analysis Different analysis/different approaches even at national level Unclear who is supporting data prioritization, curation and analysis at state and district level Data translation and data use Data use scenarios need to be much clearer: what data should be reviewed by whom, to lead to what action? What’s the ideal frequency for review? Who will be the ā€œdata maestroā€ at each level (national, state, district)
  • 9.
    • Prioritize aset of core indicators for review across the lifecycle • Create a strong culture of data use • Ensure interoperability of nutrition data systems • Multiple data sources for some interventions requires careful reconciliation of findings from survey and administrative data systems. • Data stewardship is critical to ensure effective use of data. Recommendations