3. • Year 5: $110
Projections about the future are inherently inaccurate, since no
one has a crystal ball. You also
know that the cash flows you expect to receive in year five can't
possibly be worth as much as a
dollar received in year one, because you have to wait a longer
time to receive that ‘year 5’ money.
You want to know what the hot dog business is theoretically
worth. You believe that the hot-dog
stand is a relatively low-risk venture, and assume that the cash
flows should be discounted at a rate
of 10% per year (our cost of capital). We will use a discount
rate of 10% and the projections for free
cash flows (listed above). The next step is to start doing the
math.
Suppose you own the exclusive right to sell hot dogs at the
neighborhood Little League ballfield. Your exclusive contract
expires
in five years, so you don't know what will happen exactly six
years
from now. However, you do have a very good idea of what your
sales, profits, and free cash flows should look like for the next
five
4. years in which you are the exclusive hot-dog vendor.
You thus project that the stand will produce the following free
cash
flows in each year:
I have intentionally used lighter and
lighter ink to show that the confidence
and value drops as we go into the
future…
C Financial Management and Decision Making – An
Introduction
4
Discounting the cash flows
To calculate the present value of any cash flow, you need the
formula
Thus, for year one, the math would look like this:
Present value = $50 ÷ (1 + .10)^1, which is = $50 ÷ (1.10)^1,
which is = $50 ÷ 1.10
Present value = $45.45
In completing the steps, you learn that the present value of $50
9. will be exactly
5.0000000000
days? NO.
We vary all of the
durations based on the
probability distribution
info we have on each
of them… and look at
the net effect on the
project’s overall
duration.
Click through to see
each one vary – click
fast if you get bored.
Deriving data for the Monte Carlo Simulation
NOTE: this can be done for duration and/or budget. In this
animation, we look at duration.
5 days
So…
13. scenarios.
The grey bars represent the
number of samples of the
total duration at each of the
possible completion dates on
the horizontal axis.
Each sample
result builds
up the bar a
notch.
Then we add a cumulative
percentage axis (the 0 to 100%
on the right side). It’s
represented here by the dotted
line which will take on an s-
shape as it rises slowly at first,
quickly in the middle (as the
middle dates have more
samples per date) and slowly
again (the very late dates have
few samples also).
C
Financial Management and Decision Making:
16. r
e
s
u
lt
)
0
100
200
300
400
Completion Date
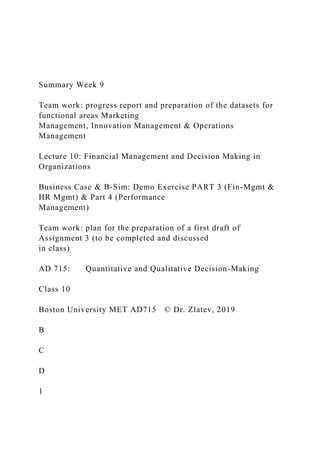
Effect of Risk on your schedule!
After simulating the project thousands of times
Project Risk Tools – Monte Carlo
In what completion date do we have 90% confidence?
90%
Now we can use
this chart to answer
questions. The first
is: In what date do
we have 90%
confidence that
20. Completion Date
Effect of Risk on your schedule!
After simulating the project thousands of times
Project Risk Tools – Monte Carlo
30%
How confident are we that we’ll finish by 4-July?
We can do this the
other way as well. We
can pick a date and ask,
“how confident are we
that we’ll finish by that
date?”
Here we simply start at
the date and read up to
the dotted line and
then over to the
cumulative probability.
We are 30% confident
of meeting 4-July-2017.
C
Financial Management and Decision Making:
Let’s talk about risk, projects, and Monte Carlo Simulation
24. Need of a
Decision
Step 2:
Generate
Alternative
Step 3:
Assess
Alternative
Step 4:
Choose Among
Alternatives
Step 5:
Implement the
Chosen Alternative
Step 6:
Learn from
Feedback
Decision
Making
Process
Assess Different Alternatives:
TAB ‘Fin-Mgt’
1. Office Assistance (FY-1) only
2. Salesmen (FY-1) only
3. Executive Salaries (FY-1) only
4. Growth Rate FY-2 only
5. Growth Rate FY-3 only
Note: (4 & 5) for 1 and/or 2 and/or 3
26. • Overall goals on objectives of the report
• Structure of the report
2. Managerial decision making process for selected functional
areas of the
new business unit
2.1. Selected functional area #1:
3. Application of decision support tools
3.1. Selected functional area #1:
>>> Decision support tool #1.1:
>>> Decision support tool #1.2:
3.3. Selected functional area #3:
>>> Decision support tool #3.1:
>>> Decision support tool #3.2:
4. Evaluation of the results of the business simulation
5. Summary of the results, recommendations, and conclusions
2.2. Selected functional area #2:
2.3. Selected functional area #3:
2.5. Selected functional area #5:
27. 2.4. Selected functional area #4:
Define the location of the restaurant
Define the current status:
Who are your customers
Who are your competitors
Why change is needed
Define the size of the restaurant
Investing in a New Brew Pub: owner’s objectives
1
2
3
4
Demo Exercise PART 1
Business Running Case (page 3)
Before confirming/rejecting the offer, the owner would like to
prepare
a conceptual study, structured as a managerial report that will
address
the following questions:
1. Define the overall goals and objectives of the new business
unit.
28. 2. Based on the federal and state’s specific legal rules and
regulations,
to determine ….
3. Define the business strategy for the next three years of
operation …
4. …. 20
1. Introduction:
• Overall goals on objectives of the report
• Structure of the report
2. Managerial decision making process for selected functional
areas of the
new business unit
2.1. Selected functional area #1:
3. Application of decision support tools
3.1. Selected functional area #1:
>>> Decision support tool #1.1:
>>> Decision support tool #1.2:
3.3. Selected functional area #3:
>>> Decision support tool #3.1:
>>> Decision support tool #3.2:
30. • Problem statement
• Overall goals on objectives of the report
• Structure of the report
2. Managerial decision making process for selected functional
areas of the
new business unit
FUNCTIONAL
AREA
For each one of the functional area’s, describe the process and
answer the following four questions:
1. Integration of the functional
strategy and plans with the company
strategies and resources
2. Opportunity analysis (business
model, core competency,
competitors, differentiators)
3. Developing of three years plans
for successful operations per
functional area
4. Implementation, management,
and control of the functional area
three year program
MKTG MGMT
32. 3. Application of decision support tools
3.1. Selected functional area #1:
>>> Decision support tool #1.1:
>>> Decision support tool #1.2:
3.3. Selected functional area #3:
>>> Decision support tool #3.1:
>>> Decision support tool #3.2:
4. Evaluation of the results of the business simulation
5. Summary of the results, recommendations, and conclusions
2.2. Selected functional area #2:
2.3. Selected functional area #3:
2.5. Selected functional area #5:
2.4. Selected functional area #4:
3.2. Selected functional area #2:
>>> Decision support tool #2.1:
>>> Decision support tool #2.2:
3.4. Selected functional area #4:
>>> Decision support tool #4.1: