McKinsey & Company 1
Brazil Digital Report
1st Edition
April 2019
McKinsey & Company 2
About this report
The Objective
This report presents an overview of Brazil’s economy, including its innovation, digital and entrepreneurial landscape. The facts show that Brazil
offers many exciting opportunities and has many challenges – opportunities for innovation – to drive productivity, growth and social advances.
The Audience
This report is intended for all those who can play a part in driving the innovation agenda in the country – entrepreneurs, investors, public and
private institutions and business leaders around the world, and digitally savvy, intellectually curious Brazilians.
The methodology
This is a curated compilation of public information and selected proprietary McKinsey data. It can be revised annually, and we hope it will
generate many years of editions that will tell the ongoing story of Brazil’s digital and innovation evolution.
Acknowledgments:
McKinsey thanks the support it has received from Brazil at Silicon Valley, a student-led movement that started at Stanford
University and whose mission is to improve Brazil’s competitiveness and global relevance through technology and innovation.
More information at www.brazilatsiliconvalley.com. “
McKinsey & Company 3
Disclaimer
The Brazil Digital Report (“Report”) is based on information that has not been generated by McKinsey & Company, Inc. / Brasil Consultoria
Ltda. (“McKinsey”), and has not been subject to McKinsey´s independent verification. McKinsey does not attest that the information in this
Report is accurate or complete in every respect.
The analyses and conclusions contained in this Report do not purport to contain or incorporate all of the information that may be required
to make an informed decision. The reader should conduct a more detailed investigation and analysis before making any decisions or
entering into any transactions. McKinsey makes no representations or warranties regarding the accuracy or completeness of the
information in this Report and expressly disclaims any and all liabilities based on it.
This Report should not be considered and/or construed as strategic, financial, legal, tax or accounting advice and does not constitute legal,
accounting, tax, or similar professional advice normally provided by licensed or certified practitioners.
The analyses and conclusions in this Report are based on various assumptions that may or may not be correct, being based upon factors
and events subject to uncertainty. Future results or values could be materially different from any forecast or estimates contained in the
analyses.
McKinsey shall not be obliged to maintain, update or correct the report, nor shall it be liable, in any event, for any damage or loss caused
by the use of the Report, including, without limitation, lost profits or indirect damages.
McKinsey & Company 4
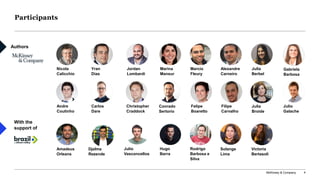
Participants
Authors
With the
support of
Nicola
Calicchio
Amadeus
Orleans
Christopher
Craddock
Hugo
Barra
Felipe
Boaretto
Marina
Mansur
Rodrigo
Barbosa e
Silva
Filipe
Carvalho
Marcio
Fleury
Solange
Lima
Carlos
Dare
Alexandre
Carneiro
Andre
Coutinho
Yran
Dias
Djalma
Rezende
Julio
Vasconcellos
Julio
Galache
Jordan
Lombardi
Victoria
Bertasoli
Julia
Berbel
Julia
Broide
Gabriela
Barbosa
Conrado
Sertorio
McKinsey & Company 5
Chapters
Sector Deep
Dives
Digital
Perspective
Entrepreneurship
Ecosystem
Macroeconomics
McKinsey & Company 6
Chapters
Sector Deep
Dives
Digital
Perspective
Entrepreneurship
Ecosystem
Macroeconomics
McKinsey & Company 7
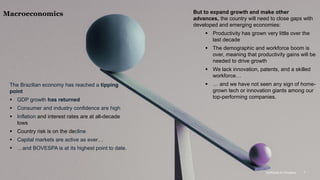
The Brazilian economy has reached a tipping
point
▪ GDP growth has returned
▪ Consumer and industry confidence are high
▪ Inflation and interest rates are at all-decade
lows
▪ Country risk is on the decline
▪ Capital markets are active as ever…
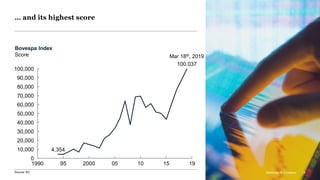
▪ …and BOVESPA is at its highest point to date.
But to expand growth and make other
advances, the country will need to close gaps with
developed and emerging economies:
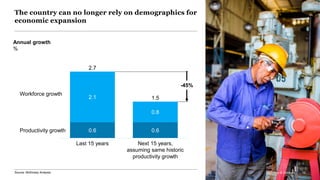
▪ Productivity has grown very little over the
last decade
▪ The demographic and workforce boom is
over, meaning that productivity gains will be
needed to drive growth
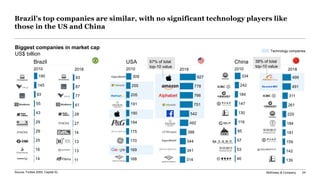
▪ We lack innovation, patents, and a skilled
workforce…
▪ … and we have not seen any sign of home-
grown tech or innovation giants among our
top-performing companies.
Macroeconomics
McKinsey & Company 7
McKinsey & Company 8
2005
2004
2001
2003
2006
2007
2008
2011
2012
2013
2014
2015
2019
2016
2017
2018
2020
-4
-3
5
2009
6
-2
-1
0
1
7
3
2002
4
2000
2010
8
2
-0.1
1.1
3.1
1.2
6.1
3.03.2
7.5
1.4
5.8
4.0 4.0
5.1
4.4
0.5
-3.6 -3.3
1.1 1.2
2.5 2.7
1.9
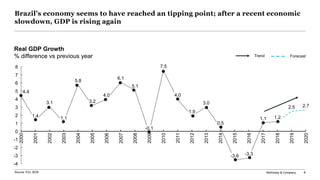
Real GDP Growth
% difference vs previous year Trend Forecast
Source: EIU, BCB
Brazil’s economy seems to have reached an tipping point; after a recent economic
slowdown, GDP is rising again
McKinsey & Company 9
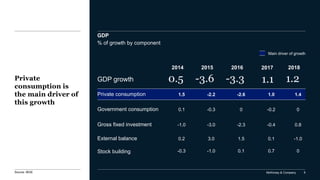
GDP
% of growth by component
Private
consumption is
the main driver of
this growth
2014 2016 2018
Government consumption
Private consumption
Gross fixed investment
External balance
Stock building
GDP growth
20172015
0.5 -3.3 1.21.1-3.6
1.5 -2.6
0.1 0
-1.0 -2.3
0.2 1.5
1.4
0
0.8
-1.0
-0.3 0.1 0
1.0
-0.2
-0.4
0.1
0.7
-2.2
-0.3
-3.0
3.0
-1.0
Main driver of growth
Source: IBGE
McKinsey & Company 10Source: FGV-Ibre, EIU
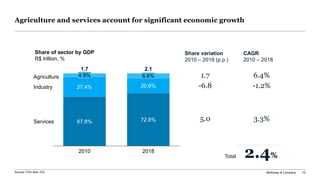
4.9%
72.8%
27.4%
2010
67.8%
6.6%
20.6%
1.7
2018
Agriculture
Industry
Services
2.1
1.7
-6.8
5.0
Share of sector by GDP
R$ trillion, %
Share variation
2010 – 2018 (p.p.)
6.4%
-1.2%
3.3%
CAGR
2010 – 2018
2.4%Total
Agriculture and services account for significant economic growth
McKinsey & Company 11
76
77
0
79
78
80
81
82
83
84
1716 18
% installed capacity usage
10 13 14 15
Source: CNI
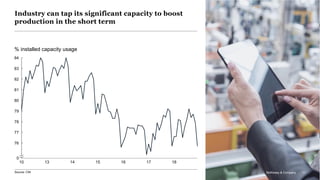
Industry can tap its significant capacity to boost
production in the short term
McKinsey & Company 11
McKinsey & Company 12
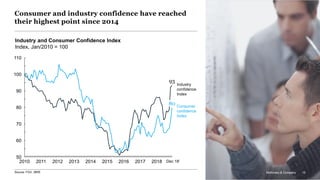
Consumer and industry confidence have reached
their highest point since 2014
Industry and Consumer Confidence Index
Index, Jan/2010 = 100
93
50
110
60
90
70
80
100
20172010 2011 2012 2013 2014 2015 2016 2018
80 Consumer
confidence
Index
Industry
confidence
Index
McKinsey & Company 12Source: FGV, IBRE
Dec 18’
McKinsey & Company 13
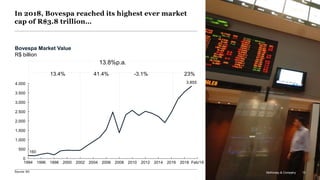
In 2018, Bovespa reached its highest ever market
cap of R$3.8 trillion…
160
1994 1996
2.500
500
2000
0
20102008 20122006 2014
3.500
2004 20182002
3.000
Feb/191998
4.000
1.000
1.500
2.000
2016
3.855
13.4% 41.4% -3.1% 23%
13.8%p.a.
Source: B3
Bovespa Market Value
R$ billion
McKinsey & Company 13
McKinsey & Company 14
1990 05
70,000
95 2000
40,000
10
60,000
15
100,000
19
0
10,000
20,000
30,000
50,000
80,000
90,000
4,354
100.037
Source: B3
… and its highest score
Bovespa Index
Score
McKinsey & Company 14
Mar 18th, 2019
McKinsey & Company 15
82%
5%
Corporate
bonds 70%
2012
13%
2013
140
2017
13%
10%
Certificates of
receivables
13%
77%
137
2014
1%
13%
2015
1%
9%
2016
27%
63%
177
67%
12%
11%
11%
3%
Equities (IPO)
Equities
(follow-ons)
16%
7%
71%
144
8% 112 113
+5% p.a.
Source: BCB; ANBIMA; press clippings; McKinsey analysis
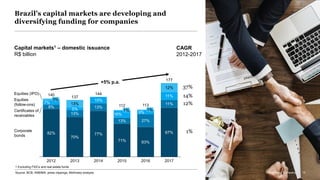
Capital markets1 – domestic issuance
R$ billion
CAGR
2012-2017
37%
14%
12%
1%
Brazil’s capital markets are developing and
diversifying funding for companies
McKinsey & Company 15
1 Excluding FIDCs and real estate funds
McKinsey & Company 16Source: B3
1 1
10
3
3
1
2018
1
17
2
2014 1615
2
12
6
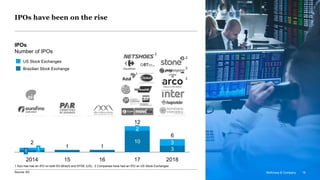
IPOs
Number of IPOs
Brazilian Stock Exchange
US Stock Exchanges
IPOs have been on the rise
McKinsey & Company 16
2
2
2
1
2
1 Azul has had an IPO on both B3 (Brazil) and NYSE (US). 2 Companies have had an IPO on US Stock Exchanges
McKinsey & Company 17
0
1,200
600
200
800
1,000
400
1,600
1,400
2,400
1613
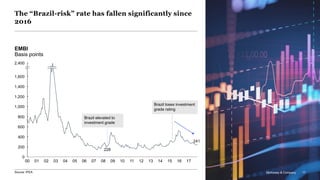
EMBI
Basis points
00 01 02 04 05 1407 08 1709 1006
228
03 11 1512
241
Source: IPEA
Brazil elevated to
investment grade
Brazil loses investment
grade rating
The “Brazil-risk” rate has fallen significantly since
2016
McKinsey & Company 17
McKinsey & Company 18
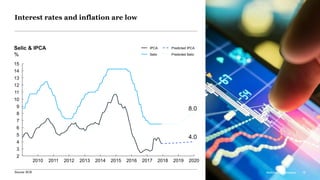
Interest rates and inflation are low
Selic & IPCA
%
2011
14
20152010
10
2012 2013
12
2017
13
2018
11
20192014
3
2020
2
4
5
6
7
8
9
15
2016
4.0
8.0
IPCA
Selic
Predicted IPCA
Predicted Selic
Source: BCB McKinsey & Company 18
McKinsey & Company 19
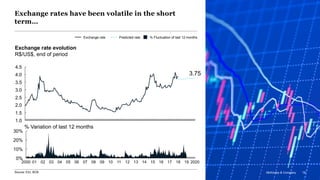
Exchange rates have been volatile in the short
term…
3.5
2.5
2.0
1.0
1.5
3.0
4.5
4.0 3.75
Exchange rate evolution
R$/US$, end of period
Exchange rate Predicted rate
0%
10%
30%
20%
1902 04012000 0703 05 06 08 09 10 11 12 13 14 15 16 17 18 2020
% Fluctuation of last 12 months
Source: EIU, BCB
% Variation of last 12 months
McKinsey & Company 19
McKinsey & Company 20
3.5
4.0
2.5
1.0
3.0
1.5
2.0
0.5
14
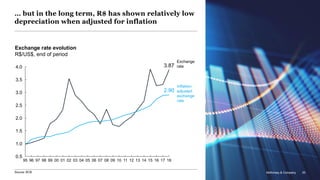
2.90
1895 96 97 98 99 01 02 03 04 05 06 07 0908 10
3.87
11 12 13 15 16 1700
Source: BCB
… but in the long term, R$ has shown relatively low
depreciation when adjusted for inflation
Exchange rate evolution
R$/US$, end of period
Inflation-
adjusted
exchange
rate
Exchange
rate
McKinsey & Company 20
McKinsey & Company 21
10
35
45
0
50
55
5
60
15
30
70
65
20
25
40
75
9695 16 201805 151208991990 91 92 93 94 97 98 00 01
China
02 03 140604 09 10 11
Russia
1307
India
Brazil
Chile
United States
France
17
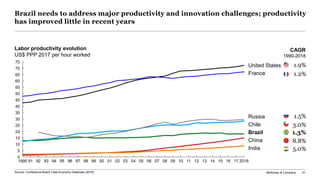
1.9%
CAGR
1990-2018
1.2%
Labor productivity evolution
US$ PPP 2017 per hour worked
5.0%
3.0%
1.3%
8.8%
1.5%
Source: Conference Board Total Economy Database (2018)
Brazil needs to address major productivity and innovation challenges; productivity
has improved little in recent years
McKinsey & Company 22
Workforce growth
Last 15 years Next 15 years,
assuming same historic
productivity growth
Productivity growth
2.7
1.5
0.6
2.1
0.6
0.8
-45%
The country can no longer rely on demographics for
economic expansion
Annual growth
%
Source: McKinsey Analysis McKinsey & Company 22
McKinsey & Company 23
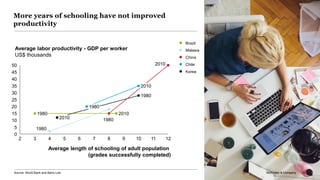
More years of schooling have not improved
productivity
23McKinsey & CompanySource: World Bank and Barro-Lee
Average labor productivity - GDP per worker
US$ thousands
0
102 63 4 5 7 8 9
30
11 12
45
5
50
10
15
20
25
35
40
Average length of schooling of adult population
(grades successfully completed)
2010
1980 2010
1980
1980
2010
1980
2010
1980
China
Brazil
Malasia
Chile
Korea
McKinsey & Company 24
Brazil’s top companies are similar, with no significant technology players like
those in the US and China
93
87
77
61
28
27
14
13
13
11
499
491
311
261
220
184
181
159
142
139
927
778
766
751
542
492
388
344
341
314
309
255
205
191
190
184
175
170
169
168
334
242
184
147
130
119
85
57
53
46
190
145
93
55
43
29
29
25
16
14
2010 2018
Brazil
Biggest companies in market cap
US$ billion
Technology companies
Source: Forbes 2000; Capital IQ
2010 2018
USA
2010 2018
China67% of total
top-10 value
38% of total
top-10 value
McKinsey & Company 25
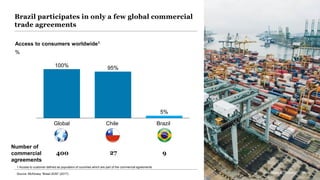
Brazil participates in only a few global commercial
trade agreements
Number of
commercial
agreements
Global Chile
100%
Brazil
5%
95%
400 27 9
Source: McKinsey “Brasil 2030” (2017)
Access to consumers worldwide1
%
1 Access to customer defined as population of countries which are part of the commercial agreements
McKinsey & Company 25
McKinsey & Company 26
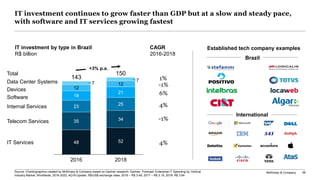
IT investment continues to grow faster than GDP but at a slow and steady pace,
with software and IT services growing fastest
Source: Charts/graphics created by McKinsey & Company based on Gartner research: Gartner, Forecast: Enterprise IT Spending by Vertical
Industry Market, Worldwide, 2016-2022, 4Q18 Update. R$/US$ exchange rates: 2016 – R$ 3.49, 2017 – R$ 3.19, 2018: R$ 3.64
IT investment by type in Brazil
R$ billion
CAGR
2016-2018
-1%
4%
4%
6%
-1%
1%
150
12
48
Internal Services
35
Data Center Systems
18
7
23
2016
7
2018
12
21
25
34
52
Devices
Software
IT Services
Telecom Services
143
+3% p.a.
Brazil
International
Established tech company examples
Total
McKinsey & Company 27
Chapters
Sector Deep
Dives
Digital
Perspective
Entrepreneurship
Ecosystem
Macroeconomics
McKinsey & Company 28
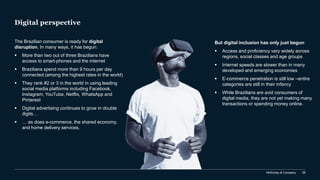
Digital perspective
The Brazilian consumer is ready for digital
disruption. In many ways, it has begun:
▪ More than two out of three Brazilians have
access to smart-phones and the internet
▪ Brazilians spend more than 9 hours per day
connected (among the highest rates in the world)
▪ They rank #2 or 3 in the world in using leading
social media platforms including Facebook,
Instagram, YouTube, Netflix, WhatsApp and
Pinterest
▪ Digital advertising continues to grow in double
digits…
▪ … as does e-commerce, the shared economy,
and home delivery services.
But digital inclusion has only just begun:
▪ Access and proficiency vary widely across
regions, social classes and age groups
▪ Internet speeds are slower than in many
developed and emerging economies
▪ E-commerce penetration is still low –entire
categories are still in their infancy
▪ While Brazilians are avid consumers of
digital media, they are not yet making many
transactions or spending money online.
McKinsey & Company 29
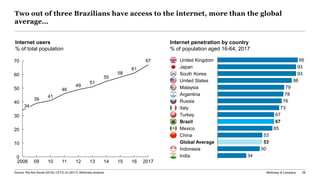
Internet users
% of total population
39
41
46
49
51
55
58
61
67
2008 09 10 1411 12 13
0
1615 2017
10
20
30
40
50
60
70
34
Internet penetration by country
% of population aged 16-64, 2017
Source: We Are Social (2018); CETIC.br (2017); McKinsey analysis.
95
93
93
88
79
78
76
73
67
65
53
50
34
Russia
Mexico
Indonesia
Brazil
South Korea
United Kingdom
Japan
Argentina
United States
Malaysia
Italy
Turkey
China
Global Average
India
67
53
Two out of three Brazilians have access to the internet, more than the global
average…
McKinsey & Company 30Source: Google’s The Connected Consumer Survey; CETIC; Statcounter; McKinsey analysis (2017)
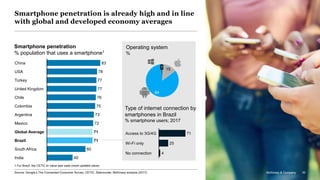
Smartphone penetration
% population that uses a smartphone1
71
25
4No connection
Wi-Fi only
Access to 3G/4G
Type of internet connection by
smartphones in Brazil
% smartphone users; 2017
83
78
77
77
76
75
73
72
60
40
South Africa
Argentina
China
USA
United Kingdom
71
Turkey
Chile
Colombia
Global Average
Mexico
Brazil
India
71
1 For Brazil, the CETIC.br value was used (most updated value)
15
84
1
Operating system
%
Smartphone penetration is already high and in line
with global and developed economy averages
McKinsey & Company 30
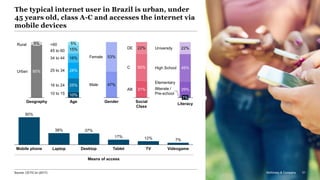
McKinsey & Company 31Source: CETIC.br (2017)
The typical internet user in Brazil is urban, under
45 years old, class A-C and accesses the internet via
mobile devices
95%Urban
5%
Geography
Rural
15%
16%
5%+60
25%
28%
10%
45 to 60
Age
34 to 44
25 to 34
10 to 15
16 to 24
Gender
53%Female
47%Male
Means of access
31%
50%
DE 22%
Social
Class
AB
C
38% 37%
17% 12% 7%
VideogameLaptopMobile phone Desktop Tablet TV
90%
29%
49%
University
High School
22%
Elementary
1%
Literacy
Illiterate /
Pre-school
McKinsey & Company 31
McKinsey & Company 32
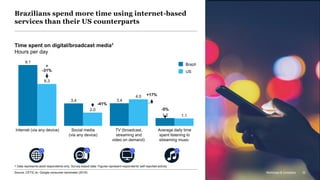
Time spent on digital/broadcast media1
Hours per day
Average daily time
spent listening to
streaming music
3.43.4
Internet (via any device)
9.1
Social media
(via any device)
TV (broadcast,
streaming and
video on demand)
6.3
2.0
4.0
1.2 1.1
-5%
-31%
-41%
+17%
Brazil
US
Source: CETIC.br; Google consumer barometer (2018)
1 Data represents adult respondents only; Survey-based data: Figures represent respondents' self-reported activity
Brazilians spend more time using internet-based
services than their US counterparts
McKinsey & Company 32
McKinsey & Company 33
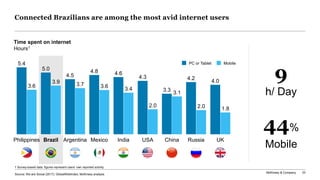
Connected Brazilians are among the most avid internet users
44%
Mobile
Source: We are Social (2017); GlobalWebIndex; McKinsey analysis
Philippines
3.3
USA
4.8
Brazil
3.1
Argentina RussiaMexico India China UK
5.4
3.6
5.0
4.34.5
3.9 3.7 3.6
4.6
3.4
2.0
4.2
2.0
4.0
1.8
Time spent on internet
Hours1
PC or Tablet Mobile
9
h/ Day
1 Survey-based data: figures represent users’ own reported activity
McKinsey & Company 34
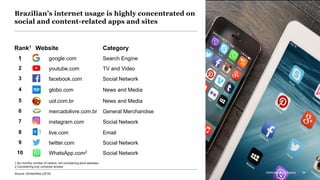
Brazilian’s internet usage is highly concentrated on
social and content-related apps and sites
Source: SimilarWeb (2019)
WebsiteRank1 Category
3 Social Network
7 Social Network
1 Search Engine
2 TV and Video
4 News and Media
5 News and Media
6 General Merchandise
8 Email
9 Social Network
10
facebook.com
instagrarn.com
google.com
youtube.com
globo.com
uol.com.br
mercadolivre.com.br
live.com
twitter.com
WhatsApp.com2 Social Network
1 By monthly number of visitors, not considering adult websites
2 Considering only computer access
McKinsey & Company 34
McKinsey & Company 35
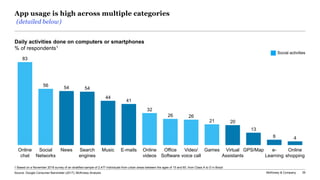
App usage is high across multiple categories
(detailed below)
Source: Google Consumer Barometer (2017); McKinsey Analysis
1 Based on a November 2018 survey of an stratified sample of 2,477 individuals from urban areas between the ages of 15 and 60, from Class A to D in Brazil
83
56 54 54
44
41
32
26 26
21 20
13
6 4
Online
chat
Social
Networks
Video/
voice call
News Virtual
Assistants
Office
Software
Search
engines
Music E-mails Online
videos
Games GPS/Map e-
Learning
Online
shopping
Daily activities done on computers or smartphones
% of respondents1
Social activities
McKinsey & Company 36
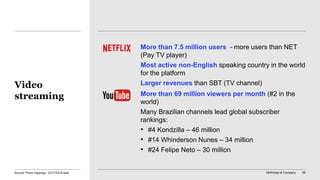
More than 7.5 million users - more users than NET
(Pay TV player)
Most active non-English speaking country in the world
for the platform
Larger revenues than SBT (TV channel)
More than 69 million viewers per month (#2 in the
world)
Many Brazilian channels lead global subscriber
rankings:
• #4 Kondzilla – 46 million
• #14 Whinderson Nunes – 34 million
• #24 Felipe Neto – 30 million
Video
streaming
Source: Press clippings, 2017/2018 data
McKinsey & Company 37
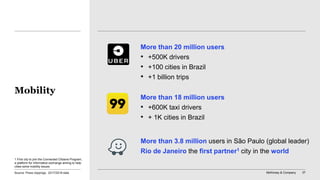
More than 20 million users
• +500K drivers
• +100 cities in Brazil
• +1 billion trips
More than 18 million users
• +600K taxi drivers
• + 1K cities in Brazil
More than 3.8 million users in São Paulo (global leader)
Rio de Janeiro the first partner1 city in the world
Mobility
1 First city to join the Connected Citizens Program,
a platform for information exchange aiming to help
cities solve mobility issues
Source: Press clippings, 2017/2018 data
McKinsey & Company 38
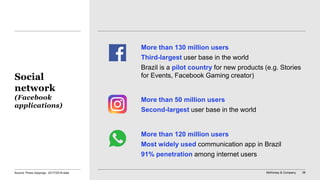
More than 130 million users
Third-largest user base in the world
Brazil is a pilot country for new products (e.g. Stories
for Events, Facebook Gaming creator)
More than 50 million users
Second-largest user base in the world
More than 120 million users
Most widely used communication app in Brazil
91% penetration among internet users
Social
network
(Facebook
applications)
Source: Press clippings, 2017/2018 data
McKinsey & Company 39
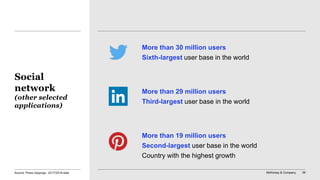
More than 30 million users
Sixth-largest user base in the world
More than 29 million users
Third-largest user base in the world
More than 19 million users
Second-largest user base in the world
Country with the highest growth
Social
network
(other selected
applications)
Source: Press clippings, 2017/2018 data
McKinsey & Company 40
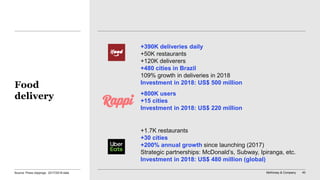
+390K deliveries daily
+50K restaurants
+120K deliverers
+480 cities in Brazil
109% growth in deliveries in 2018
Investment in 2018: US$ 500 million
+800K users
+15 cities
Investment in 2018: US$ 220 million
+1.7K restaurants
+30 cities
+200% annual growth since launching (2017)
Strategic partnerships: McDonald’s, Subway, Ipiranga, etc.
Investment in 2018: US$ 480 million (global)
Food
delivery
Source: Press clippings, 2017/2018 data
McKinsey & Company 41
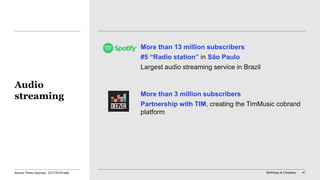
More than 13 million subscribers
#5 “Radio station” in São Paulo
Largest audio streaming service in Brazil
More than 3 million subscribers
Partnership with TIM, creating the TimMusic cobrand
platform
Audio
streaming
Source: Press clippings, 2017/2018 data
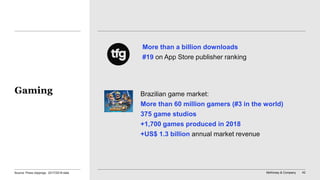
McKinsey & Company 42
More than a billion downloads
#19 on App Store publisher ranking
Brazilian game market:
More than 60 million gamers (#3 in the world)
375 game studios
+1,700 games produced in 2018
+US$ 1.3 billion annual market revenue
Gaming
Source: Press clippings, 2017/2018 data
McKinsey & Company 43
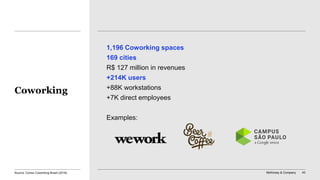
1,196 Coworking spaces
169 cities
R$ 127 million in revenues
+214K users
+88K workstations
+7K direct employees
Examples:
Coworking
Source: Censo Coworking Brasil (2018)
McKinsey & Company 44
97% of search engine market share
Most visited website
#5 in global online visitors
Only country apart from US with a complete Google
ecosystem infrastructure
Google
environment
Source: Press clippings, 2017/2018 data
McKinsey & Company 45
Mobile app
creation/usage
Source: Press clippings
More than 6 billion app downloads per year
#4 in the world in app downloads
Average of 83 installed apps and usage of 12
apps per day
#4 largest app producer in the world
McKinsey & Company 46
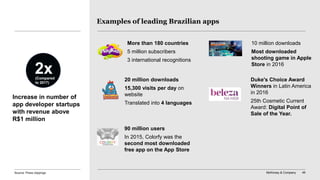
Examples of leading Brazilian apps
More than 180 countries
5 million subscribers
3 international recognitions
10 million downloads
Most downloaded
shooting game in Apple
Store in 2016
90 million users
In 2015, Colorfy was the
second most downloaded
free app on the App Store
Duke's Choice Award
Winners in Latin America
in 2016
25th Cosmetic Current
Award: Digital Point of
Sale of the Year.
20 million downloads
15,300 visits per day on
website
Translated into 4 languages
Increase in number of
app developer startups
with revenue above
R$1 million
(Compared
to 2017)
2x
Source: Press clippings
McKinsey & Company 47
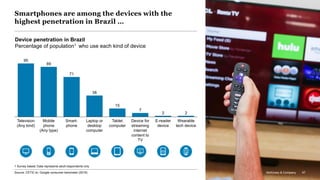
Device penetration in Brazil
Percentage of population1 who use each kind of device
Source: CETIC.br; Google consumer barometer (2018)
1 Survey based; Data represents adult respondents only
Smartphones are among the devices with the
highest penetration in Brazil …
95
89
71
38
15
7
2 2
E-reader
device
Smart-
phone
Mobile
phone
(Any type)
Tablet
computer
Television
(Any kind)
Laptop or
desktop
computer
Device for
streaming
internet
content to
TV
Wearable
tech device
McKinsey & Company 47
McKinsey & Company 48
71
38
15
95
7
2
90
78 77
46
89
28
10
14
2
Mobile
phone
(Any type)
Laptop or
desktop
computer
Tablet
computer
Smart-
phone
Television
(Any kind)
Device for
streaming
internet
content to
TV
E-reader
device
Wearable
tech device
89
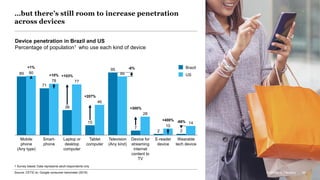
-6%
+400%
+207%
-86%
+10%
+1%
+300%
+103%
Brazil
US
Source: CETIC.br; Google consumer barometer (2018)
1 Survey based; Data represents adult respondents only
…but there’s still room to increase penetration
across devices
Device penetration in Brazil and US
Percentage of population1 who use each kind of device
McKinsey & Company 48
McKinsey & Company 49Source: Brazil Media Survey
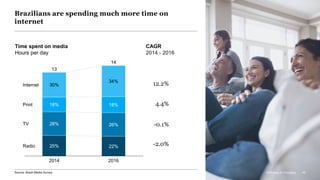
Time spent on media
Hours per day
-2.0%
-0.1%
4.4%
12.2%
26%28%
30%
18%
25%
2014
34%
18%
22%
13
2016
Internet
Print
TV
Radio
14
CAGR
2014 - 2016
Brazilians are spending much more time on
internet
McKinsey & Company 49
McKinsey & Company 50
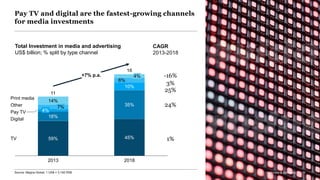
Pay TV and digital are the fastest-growing channels
for media investments
35%
6%
59%
7%
14%
4%
16%
16
2013
4%
10%
45%
2018
Print media
Other
Pay TV
Digital
TV
11
+7% p.a.
Total Investment in media and advertising
US$ billion; % split by type channel
CAGR
2013-2018
-16%
3%
25%
24%
1%
McKinsey & Company 50Source: Magna Global; 1 US$ = 3,192 RS$
McKinsey & Company 51
19%
13%
29%
4%
56%
4%
8%
2013
2%
Search
22%
43%
2018
Other
Social
Video
Display
1,87
5,55
35%
18%
39%
9%
3%
9 57
Share of
mobile media
%
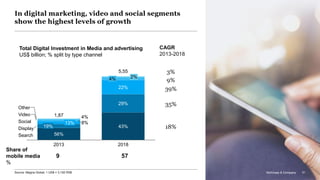
Total Digital Investment in Media and advertising
US$ billion; % split by type channel
CAGR
2013-2018
In digital marketing, video and social segments
show the highest levels of growth
McKinsey & Company 51Source: Magna Global; 1 US$ = 3,192 RS$
McKinsey & Company 52Source: Magna Global (2018); 1 US$ = 3,192 RS$ = 6.759 CNY = 58,32 RUB = 65,12 INR
45%
15%
22%
38%
10%
16%
9%
38%
36%
52% 58% 46%
21%
7%
31%
10% 9% 12% 9%
3%
Other
China
5%
Printed Media
4%
Brazil India
2%
1%
Russia
Digital
PayTV
Broadcast TV
69
US
2%
16 208 8 11
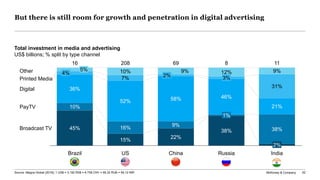
But there is still room for growth and penetration in digital advertising
Total investment in media and advertising
US$ billions; % split by type channel
McKinsey & Company 53
1514 20182013 16
10
0
20
17
40
30
50
60
70
Others
TV
Digital
Print
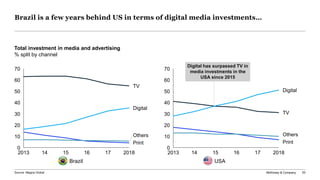
Brazil is a few years behind US in terms of digital media investments…
20182013 1614
10
1715
0
20
30
40
50
60
70
Others
TV
Digital
Print
Digital has surpassed TV in
media investments in the
USA since 2015
Total investment in media and advertising
% split by channel
Brazil USA
Source: Magna Global
McKinsey & Company 54
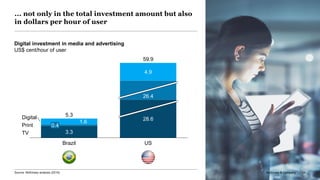
5.3
TV
1.6
0.4
3.3
Brazil
4.9
26.4
28.6
US
Digital
Print
59.9
... not only in the total investment amount but also
in dollars per hour of user
Digital investment in media and advertising
US$ cent/hour of user
McKinsey & Company 54Source: McKinsey analysis (2018)
McKinsey & Company 55
71
44
74
58
69
58
76
9
45
85
94
51
64
73
84
88
94
84
88
85
76
54
25
South
Midwest
Urban
1 to 2
Rural
Southeast
Northeast
North
Illiterate/Pre-school
Elementary
High School
University
Up to 1
2 to 3
5 to 10
3 to 5
>10
10 to 15
16 to 24
25 to 34
35 to 44
45 to 59 years old
>60
Geography
Region
Education
completed
Income
Number of
MW1
Age
Years
1 MW: Minimum Wage (monthly)
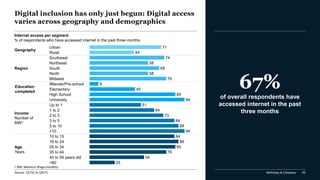
Digital inclusion has only just begun: Digital access
varies across geography and demographics
67%
of overall respondents have
accessed internet in the past
three months
Source: CETIC.br (2017)
Internet access per segment
% of respondents who have accessed internet in the past three months
McKinsey & Company 56
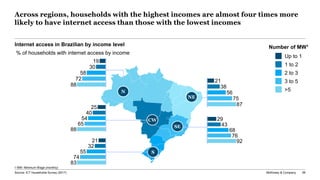
Across regions, households with the highest incomes are almost four times more
likely to have internet access than those with the lowest incomes
1 MW: Minimum Wage (monthly)
Internet access in Brazilian by income level
% of households with internet access by income
19
30
58
72
88
25
40
54
65
88
21
32
55
74
83
21
38
56
75
87
29
43
68
76
92
N
CW
S
SE
NE
Source: ICT households Survey (2017)
Up to 1
1 to 2
2 to 3
3 to 5
>5
Number of MW1
McKinsey & Company 57
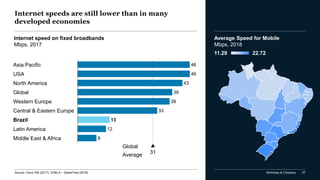
Internet speeds are still lower than in many
developed economies
46
46
43
39
38
33
12
13
Asia Pacific
Brazil
8
USA
Latin America
North America
Western Europe
Global
Central & Eastern Europe
Middle East & Africa
31
Internet speed on fixed broadbands
Mbps, 2017
Source: Cisco VNI (2017), OOKLA – SpeedTest (2018)
Global
Average
Average Speed for Mobile
Mbps, 2018
11.29 22.72
McKinsey & Company 58
28.8 47.7+13% p.a.
2013 2017
3.7% 5.1%
31.3
million
55.1
millionBuyers
Penetration
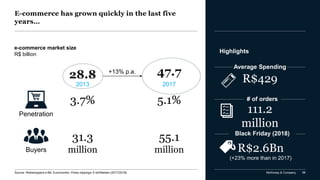
e-commerce market size
R$ billion
Highlights
R$429
111.2
million
R$2.6Bn
(+23% more than in 2017)
E-commerce has grown quickly in the last five
years…
Average Spending
# of orders
Black Friday (2018)
Source: Webshoppers e-Bit; Euromonitor; Press clippings; E-bit/Nielsen (2017/2018)
McKinsey & Company 59
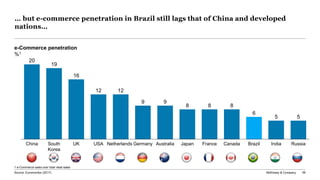
… but e-commerce penetration in Brazil still lags that of China and developed
nations…
Source: Euromonitor (2017)
e-Commerce penetration
%1
20
19
16
12 12
9 9
8 8 8
6
5 5
AustraliaGermanyChina UKSouth
Korea
USA Netherlands Japan France Canada Brazil India Russia
1 e-Commerce sales over total retail sales
McKinsey & Company 60
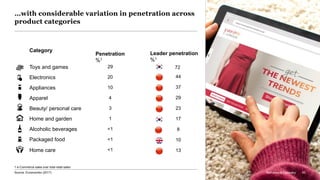
…with considerable variation in penetration across
product categories
Source: Euromonitor (2017)
1 e-Commerce sales over total retail sales
4
3
20
<1
<1
1
29
<1
10
29
23
44
13
10
17
72
8
37
Apparel
Beauty/ personal care
Electronics
Home care
Packaged food
Home and garden
Toys and games
Alcoholic beverages
Appliances
Category
Leader penetration
%1
Penetration
%1
McKinsey & Company 60
McKinsey & Company 61
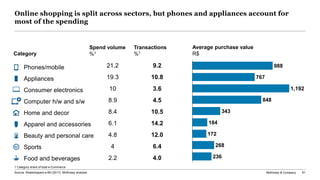
Online shopping is split across sectors, but phones and appliances account for
most of the spending
21.2
19.3
10
8.9
8.4
6.1
4.8
4
2.2
Transactions
%1
Home and decor
Appliances
Apparel and accessories
Beauty and personal care
Consumer electronics
Food and beverages
Computer h/w and s/w
Sports
Phones/mobile
Average purchase value
R$
988
767
848
343
184
172
268
236
1,192
Category
10.8
3.6
4.5
10.5
14.2
12.0
6.4
9.2
4.0
Source: Webshoppers e-Bit (2017), McKinsey analysis
Spend volume
%1
1 Category share of total e-Commerce
McKinsey & Company 62
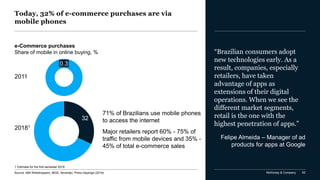
Today, 32% of e-commerce purchases are via
mobile phones
Source: eBit Webshoppers, IBGE, Novarejo, Press clippings (2018)
e-Commerce purchases
Share of mobile in online buying, %
0.3
2011
1 Estimate for the first semester 2018
32
71% of Brazilians use mobile phones
to access the internet
Major retailers report 60% - 75% of
traffic from mobile devices and 35% -
45% of total e-commerce sales
“Brazilian consumers adopt
new technologies early. As a
result, companies, especially
retailers, have taken
advantage of apps as
extensions of their digital
operations. When we see the
different market segments,
retail is the one with the
highest penetration of apps.”
Felipe Almeida – Manager of ad
products for apps at Google
20181
McKinsey & Company 63
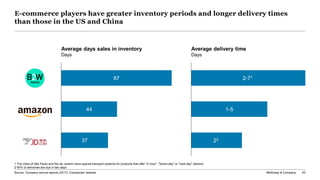
E-commerce players have greater inventory periods and longer delivery times
than those in the US and China
Average days sales in inventory
Days
Average delivery time
Days
87
44
37
2-71
22
1-5
1 The cities of São Paulo and Rio de Janeiro have special transport systems for products that offer "2-hour", "Same-day" or "next-day" delivery
2 90% of deliveries are due in two days
Source: Company annual reports (2017); Companies’ website
McKinsey & Company 64
Chapters
Sector Deep
Dives
Digital
Perspective
Entrepreneurship
Ecosystem
Macroeconomics
McKinsey & Company 65
Entrepreneurship ecosystem
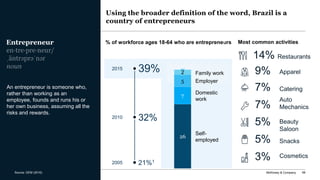
Brazilians tend to be entrepreneurial: More than 39% of economically active people work in entrepreneurial
endeavors. But only a small share of those efforts are channeled towards innovation.
That said, more startups are pushing the digital and innovation:
▪ Entrepreneurial ecosystems are vibrant across the country
▪ Investments by angel investors and VC continue to grow at high double-digit rates
year on year, surpassing the US$ 1 billion mark in 2018;
▪ The country’s first eight unicorns were nominated in the past two years
▪ More unicorns are on the horizon.
Barriers to growth remain, however:
▪ VC investment as a share of GDP is still way behind other economies
▪ Brazil remains one of the hardest places in the world to open, run and
particularly close a business, raising the cost of failure
▪ Despite the growing number of STEM and engineering graduates, recruiting
and developing digital talent remains a major challenge.
McKinsey & Company 66
An entrepreneur is someone who,
rather than working as an
employee, founds and runs his or
her own business, assuming all the
risks and rewards.
% of workforce ages 18-64 who are entrepreneurs
21%12005
32%2010
39%2015
Using the broader definition of the word, Brazil is a
country of entrepreneurs
Entrepreneur
26
7
Employer
Family work2
5
Domestic
work
Self-
employed
Cosmetics3%
Snacks5%
Beauty
Saloon
5%
Auto
Mechanics7%
Catering7%
Restaurants14%
Apparel9%
Most common activities
Source: GEM (2016)
McKinsey & Company 67
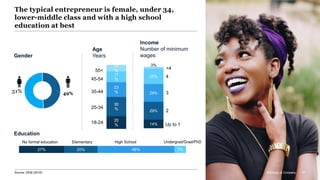
The typical entrepreneur is female, under 34,
lower-middle class and with a high school
education at best
18-24
25-34
35-44
45-54
55<
49%51%
14%
29%
29%
25%
3%
20
%
30
%
23
%
17
%
10
%
27% 20% 46% 7%
Gender
Age
Years
Income
Number of minimum
wages
Education
Up to 1
2
3
4
>4
No formal education Elementary High School Undergrad/Grad/PhD
McKinsey & Company 67Source: GEM (2016)
McKinsey & Company 68
16% 16%
12%
10% 10%
6%
4% 4%
3%
2%
1%
16%
LaborLack of
clients
Competition BureucracyLack of
capital
Lack of
knowledge
Taxes Delinquency Marketing Crisis Credit Other
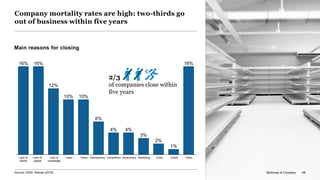
Company mortality rates are high: two-thirds go
out of business within five years
Main reasons for closing
2/3
of companies close within
five years
McKinsey & Company 68Source: GEM; Sebrae (2016)
McKinsey & Company 69
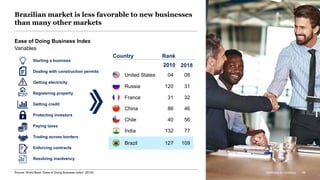
Brazilian market is less favorable to new businesses
than many other markets
Starting a business
Dealing with construction permits
Getting electricity
Registering property
Getting credit
Protecting investors
Paying taxes
Trading across borders
Enforcing contracts
Resolving insolvency
Ease of Doing Business Index
Variables
32France
08United States
77India
46China
31Russia
Brazil 109
56Chile
Rank
2010 2018
Country
31
04
132
86
120
127
40
McKinsey & Company 69Source: World Bank “Ease of Doing Business Index” (2018)
McKinsey & Company 70
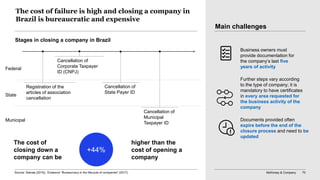
The cost of failure is high and closing a company in
Brazil is bureaucratic and expensive
Stages in closing a company in Brazil
The cost of
closing down a
company can be
higher than the
cost of opening a
company
+44%
State
Federal
Municipal
Main challenges
Business owners must
provide documentation for
the company’s last five
years of activity
Further steps vary according
to the type of company; it is
mandatory to have certificates
in every area requested for
the business activity of the
company
Documents provided often
expire before the end of the
closure process and need to be
updated
Registration of the
articles of association
cancellation
Cancellation of
Corporate Taxpayer
ID (CNPJ)
Cancellation of
State Payer ID
Cancellation of
Municipal
Taxpayer ID
Source: Sebrae (2016); Endeavor “Bureaucracy in the lifecycle of companies" (2017)
McKinsey & Company 71
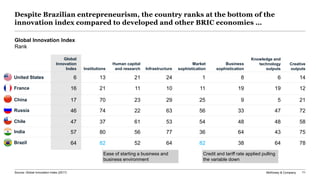
United States 1468124216 13
Russia 72473356632246 74
Brazil 78643882645264 82
France 12191911101116 21
Chile 58484854536147 37
China 215925292317 70
India 75436436775657 80
Despite Brazilian entrepreneurism, the country ranks at the bottom of the
innovation index compared to developed and other BRIC economies …
Ease of starting a business and
business environment
Credit and tariff rate applied pulling
the variable down
Global
Innovation
Index Institutions
Human capital
and research Infrastructure
Market
sophistication
Business
sophistication
Knowledge and
technology
outputs
Creative
outputs
Global Innovation Index
Rank
Source: Global Innovation Index (2017)
McKinsey & Company 72
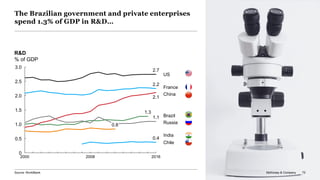
The Brazilian government and private enterprises
spend 1.3% of GDP in R&D…
0
0.5
2.0
1.0
2.5
1.5
3.0
2000
France
2008
0.8
2016
Brazil
Russia
US
Chile
China
India
1.3
2.7
0.4
2.1
1.1
2.2
R&D
% of GDP
72
Source: WorldBank McKinsey & Company 72
McKinsey & Company 73
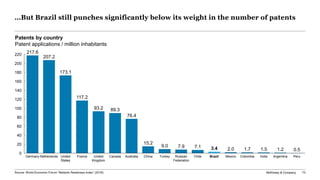
…But Brazil still punches significantly below its weight in the number of patents
20
120
0
140
200
80
180
100
40
60
220
160
9.0
Colombia
217.6
Germany ChileNetherlands United
States
France PeruUnited
Kingdom
Canada
173.1
Australia TurkeyChina Russian
Federation
Brazil
3.4
Mexico India Argentina
207.2
1.7
76.4
1.2
93.2 89.3
15.2
117.2
7.1 2.0 1.5 0.5
7.9
Patents by country
Patent applications / million inhabitants
Source: World Economic Forum “Network Readiness Index” (2016)
McKinsey & Company 74
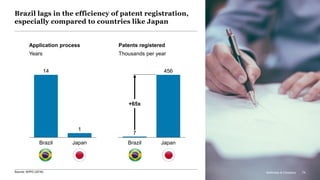
Brazil lags in the efficiency of patent registration,
especially compared to countries like Japan
Application process
Years
Patents registered
Thousands per year
14
1
Brazil Japan
7
456
Brazil Japan
+65x
Source: WIPO (2016) McKinsey & Company 74
McKinsey & Company 75
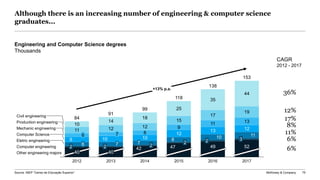
Although there is an increasing number of engineering & computer science
graduates...
8 10 11
9 10 10
12
13 12
8
9
11 13
11 12 12
15
17
19
14
18
25
35
44
42
2
49
2016
2
3
52
2017
Civil engineering
Mechanic engineering
Computer Science
Eletric engineering
Computer engineering
Other engineering majors
7
91
99
118
138
153
2
Production engineering
20152014
6
10
6
2 47
40
84
2012
7
7
2
40
2013
+13% p.a.
6%
11%
8%
17%
12%
36%
6%
CAGR
2012 - 2017
Engineering and Computer Science degrees
Thousands
Source: INEP “Censo de Educação Superior”
McKinsey & Company 76
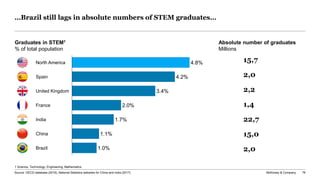
…Brazil still lags in absolute numbers of STEM graduates…
1 Science, Technology, Engineering, Mathematics
Source: OECD database (2018), National Statistics websites for China and India (2017)
Graduates in STEM1
% of total population
North America
Spain
2.0%
4.8%
India
United Kingdom
France
China
1.7%
Brazil
4.2%
3.4%
1.1%
1.0%
Absolute number of graduates
Millions
15,7
2,0
2,2
1,4
22,7
15,0
2,0
McKinsey & Company 77
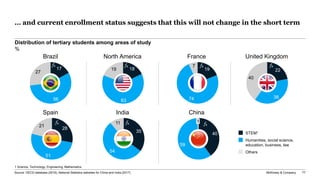
… and current enrollment status suggests that this will not change in the short term
17
56
27
18
63
19 19
74
7
22
38
40
28
51
21
35
54
11
40
59
1
Source: OECD database (2018), National Statistics websites for China and India (2017)
STEM1
Humanities, social science,
education, business, law
Others
Brazil North America France United Kingdom
ChinaSpain India
Distribution of tertiary students among areas of study
%
1 Science, Technology, Engineering, Mathematics
McKinsey & Company 78
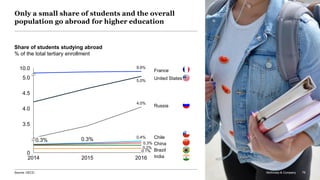
Only a small share of students and the overall
population go abroad for higher education
Share of students studying abroad
% of the total tertiary enrollment
78McKinsey & CompanySource: OECD McKinsey & Company 78
2014 2015 2016
3.5
0
4.0
4.5
5.0
10.0
0.3% 0.3%
9.9%
5.0%
4.0%
0.4%
0.3%
0.2%
0.1%
United States
France
Russia
Chile
China
Brazil
India
McKinsey & Company 79
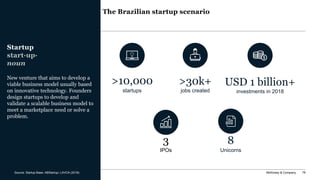
The Brazilian startup scenario
New venture that aims to develop a
viable business model usually based
on innovative technology. Founders
design startups to develop and
validate a scalable business model to
meet a marketplace need or solve a
problem.
Startup
start·up·
noun
>10,000
startups
>30k+
jobs created
USD 1 billion+
investments in 2018
3
IPOs
8
Unicorns
Source: Startup Base; ABStartup; LAVCA (2018)
McKinsey & Company 80
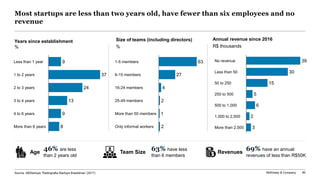
Most startups are less than two years old, have fewer than six employees and no
revenue
63% have less
than 6 members
46% are less
than 2 years old
69% have an annual
revenues of less than R$50K
Years since establishment
%
Size of teams (including directors)
%
27
4
2
1
2
More than 50 members
1-5 members
Only informal workers
6-15 members
25-49 members
16-24 members
63
Annual revenue since 2016
R$ thousands
30
15
5
6
2
3
250 to 500
No revenue
500 to 1,000
Less than 50
50 to 250
1,000 to 2,500
39
More than 2,500
37
24
13
9
8
3 to 4 years
Less than 1 year
1 to 2 years
2 to 3 years
4 to 6 years
More than 6 years
9
Age Team Size Revenues
Source: ABStartups “Radiografia Startups Brasileiras” (2017)
McKinsey & Company 81
Industry focus
%
MobilityHealth
5.7
Media
1.7
Professional
Services
EdTechTelco FinTech LawtechRetail Agrotech Real
Estate
Consum-
ption
16.2
Environ-
ment
Tourism Biotech HR Tech Others
11.0
8.8
8.2
7.5
3.4
7.1
4.4
3.9
1.6
3.7
2.8 2.6
2.0
9.3
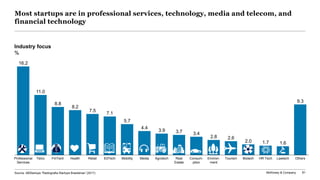
Most startups are in professional services, technology, media and telecom, and
financial technology
Source: ABStartups “Radiografia Startups Brasileiras” (2017)
McKinsey & Company 82
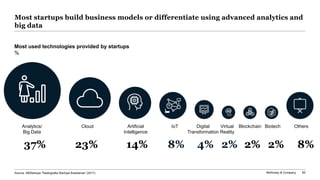
Most startups build business models or differentiate using advanced analytics and
big data
37% 8%2% 2%4% 2%8%
Analytics/
Big Data
Artificial
Intelligence
Cloud Others
23% 14%
IoT Digital
Transformation
Virtual
Reality
BiotechBlockchain
Most used technologies provided by startups
%
Source: ABStartups “Radiografia Startups Brasileiras” (2017)
McKinsey & Company 83
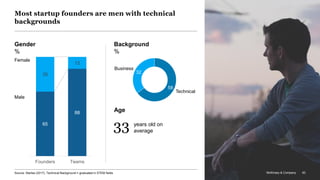
Most startup founders are men with technical
backgrounds
3365
88
35
12
Founders Teams
years old on
average
Male
Female
Background
%
Gender
%
Age
58
Technical
32
Business
83McKinsey & CompanySource: Startse (2017), Technical Background = graduated in STEM fields
McKinsey & Company 84
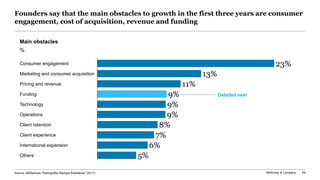
Founders say that the main obstacles to growth in the first three years are consumer
engagement, cost of acquisition, revenue and funding
13%
11%
9%
9%
9%
8%
7%
6%
5%
Funding
Client retention
Operations
Consumer engagement
Client experience
Marketing and consumer acquisition
Pricing and revenue
Technology
International expansion
Others
23%
Detailed next
Source: ABStartups “Radiografia Startups Brasileiras” (2017)
Main obstacles
%
McKinsey & Company 85
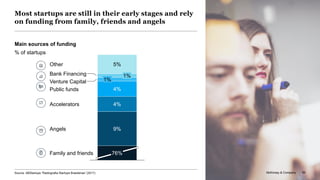
Most startups are still in their early stages and rely
on funding from family, friends and angels
4%
5%
4%Public funds
1%
1%
9%
76%
Other
Bank Financing
Venture Capital
Accelerators
Angels
Family and friends
Source: ABStartups “Radiografia Startups Brasileiras” (2017) McKinsey & Company 85
Main sources of funding
% of startups
McKinsey & Company 86
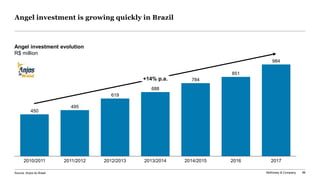
Angel investment is growing quickly in Brazil
Angel investment evolution
R$ million
495
619
688
784
851
984
20162010/2011 2011/2012 2013/20142012/2013 2014/2015 2017
450
+14% p.a.
Source: Anjos do Brasil
McKinsey & Company 87
200
1,200
0
400
1,000
600
800
12
594
371
69
2011
111 119
526
13
186
14
182
15
197
16
249
2017
143
425
500
1,141
+41% p.a.
1H2016
30 34
2H2016 1H2017 1H20182H2017
110
169
362
66
497 546
47
88
+123% p.a.
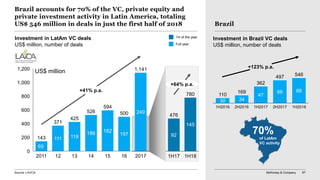
Brazil accounts for 70% of the VC, private equity and
private investment activity in Latin America, totaling
US$ 546 million in deals in just the first half of 2018 Brazil
Investment in LatAm VC deals
US$ million, number of deals Full year
1H of the year
Source: LAVCA
70%
of LatAm
VC activity
145
92
1H17 1H18
780
476
+64% p.a.
US$ million
Investment in Brazil VC deals
US$ million, number of deals
McKinsey & Company 88
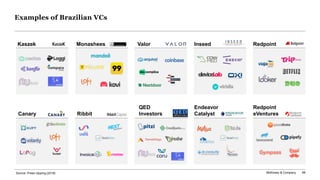
Examples of Brazilian VCs
Kaszek Monashees Valor Inseed Redpoint
Canary Ribbit
QED
Investors
Endeavor
Catalyst
Redpoint
eVentures
Source: Press clipping (2019)
McKinsey & Company 89
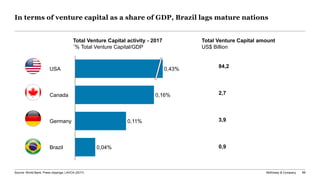
In terms of venture capital as a share of GDP, Brazil lags mature nations
Source: World Bank, Press clippings, LAVCA (2017)
Total Venture Capital activity - 2017
¨% Total Venture Capital/GDP
Total Venture Capital amount
US$ Billion
Brazil
Germany
Canada
USA 0,43%
0,16%
0,11%
0,04%
84,2
2,7
3,9
0,9
McKinsey & Company 90
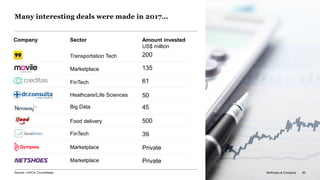
Many interesting deals were made in 2017…
Company Sector Amount invested
US$ million
Transportation Tech 200
Marketplace 135
FinTech 61
Heathcare/Life Sciences 50
Big Data 45
FinTech 39
Marketplace Private
Marketplace Private
Food delivery 500
Source: LAVCA; Crunchbase 90McKinsey & Company
McKinsey & Company 91
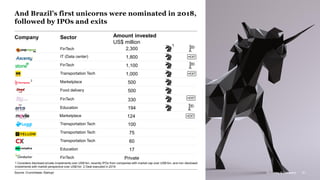
And Brazil’s first unicorns were nominated in 2018,
followed by IPOs and exits
1 Considers disclosed private investments over US$1bn, recently IPOs from companies with market cap over US$1bn, and non-disclosed
investments with market perspective over US$1bn 2 Deal executed in 2019
Company Sector Amount invested
US$ million
2,300
1,800
1,100
100
60
Private
17
75
1,000
5002
500
FinTech
IT (Data center)
FinTech
Transportation Tech
Transportation Tech
FinTech
194Education
Education
Transportation Tech
Transportation Tech
Marketplace
Food delivery
330FinTech
Marketplace 124
Source: Crunchbase; Startupi 91McKinsey & Company
1
McKinsey & Company 92
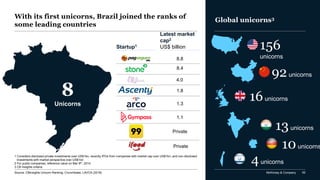
With its first unicorns, Brazil joined the ranks of
some leading countries
156
unicorns
92unicorns
16unicorns
8
Unicorns
8.8
4.0
1.8
1.3
8.4
Private
1.1
Private
1 Considers disclosed private investments over US$1bn, recently IPOs from companies with market cap over US$1bn, and non-disclosed
investments with market perspective over US$1bn
2 For public companies, reference value on Mar 8th, 2014
3 CB Insights criteria
Latest market
cap2
US$ billionStartup1
13unicorns
10unicorns
4unicorns
Global unicorns3
Source: CBinsights Unicorn Ranking, Crunchbase, LAVCA (2018)
McKinsey & Company 93
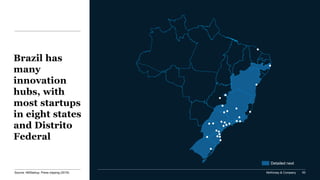
Brazil has
many
innovation
hubs, with
most startups
in eight states
and Distrito
Federal
Detailed next
Source: ABStartup, Press clipping (2019)
McKinsey & Company 94
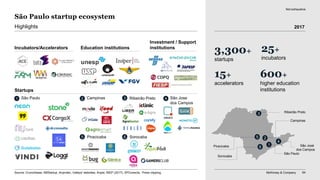
São Paulo startup ecosystem
3,300+
startups
25+
incubators
15+
accelerators
600+
higher education
institutions
Incubators/Accelerators Education institutions
Investment / Support
institutions
Highlights
Startups
Not exhaustive
São Paulo
Campinas
São José
dos Campos
Piracicaba
Ribeirão Preto
4
5
1
São Paulo1 Campinas2 Ribeirão Preto3 São Jose
dos Campos
4
Piracicaba5
3
2Sorocaba6
Sorocaba
6
Source: Crunchbase, ABStartup, Anprotec, Valleys' websites, Anpei; INEP (2017), SPConecta, Press clipping,
2017
McKinsey & Company 95
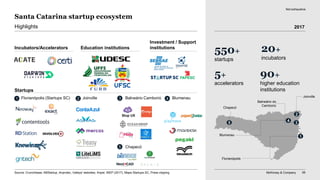
Santa Catarina startup ecosystem
550+
startups
20+
incubators
5+
accelerators
90+
higher education
institutions
Incubators/Accelerators Education institutions
Investment / Support
institutions
Highlights
Startups
Not exhaustive
Florianópolis (Startups SC)1 Joinville2 Balneário Camboriú3 Blumenau4
Chapecó5
1
Florianópolis
Chapecó
5
Balneário do
Camboriú
3
Joinville
2
Blumenau
4
Stup UX
Source: Crunchbase; ABStartup, Anprotec, Valleys' websites, Anpei; INEP (2017), Mapa Startups.SC, Press clipping
2017
McKinsey & Company 96
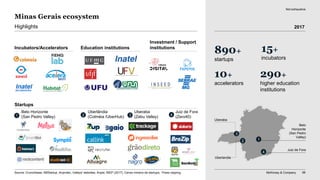
Minas Gerais ecosystem
890+
startups
15+
incubators
10+
accelerators
290+
higher education
institutions
Incubators/Accelerators Education institutions
Investment / Support
institutions
Highlights
Startups
Uberaba
Uberlandia
Belo
Horizonte
(San Pedro
Valley)
Juiz de Fora
1
3
2
4
Belo Horizonte
(San Pedro Valley)1
Uberlândia
(Colméia /UberHub)2
Uberaba
(Zebu Valley)3
Juiz de Fora
(Zero40)4
Not exhaustive
Source: Crunchbase, ABStartup, Anprotec, Valleys' websites, Anpei; INEP (2017), Censo mineiro de startups, Press clipping,
2017
McKinsey & Company 97
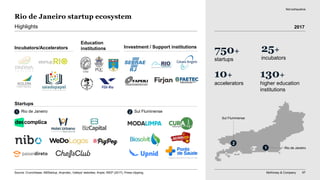
Rio de Janeiro startup ecosystem
750+
startups
25+
incubators
10+
accelerators
130+
higher education
institutions
Incubators/Accelerators
Education
institutions Investment / Support institutions
Highlights
Startups
Rio de Janeiro Sul Fluminense
Not exhaustive
1 2
Rio de Janeiro1
Sul Fluminense
2
Source: Crunchbase, ABStartup, Anprotec, Valleys' websites, Anpei; INEP (2017), Press clipping,
2017
McKinsey & Company 98
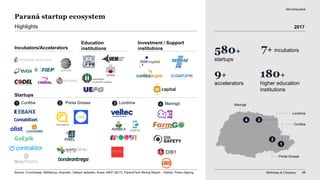
Paraná startup ecosystem
580+
startups
7+ incubators
9+
accelerators
180+
higher education
institutions
Incubators/Accelerators
Highlights
Startups
Education
institutions
Investment / Support
institutions
Not exhaustive
Londrina
3
Maringá
4
Ponta Grossa
2
1
Curitiba
Source: Crunchbase, ABStartup, Anprotec, Valleys' websites, Anpei; INEP (2017), ParanáTech Mining Report – Distrito, Press clipping,
Londrina3Curitiba1 Maringá4Ponta Grossa2
2017
McKinsey & Company 99
Rio Grande do Sul startup ecosystem
915+
startups
8+ incubators
5+
accelerators
120+
higher education
institutions
Highlights
Startups
Education
institutions
Investment / Support
institutions
Not exhaustive
Source: Crunchbase, ABStartup, Anprotec; INEP (2017), Press clipping; Report: Mapeamento de comunidades de startup – Porto Alegre
3Porto Alegre1 42
Incubators/Accelerators
1
Porto Alegre
Santa Maria
2
Santa Maria
Caxias do Sul
3
4
Canoas
Caxias do Sul
Canoas
2017
McKinsey & Company 100
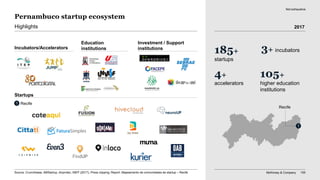
Pernambuco startup ecosystem
185+
startups
3+ incubators
4+
accelerators
105+
higher education
institutions
Highlights
Startups
Education
institutions
Investment / Support
institutions
Not exhaustive
Recife1
Incubators/Accelerators
1
Recife
Source: Crunchbase, ABStartup, Anprotec; INEP (2017), Press clipping; Report: Mapeamento de comunidades de startup – Recife
2017