Download as PDF, PPTX
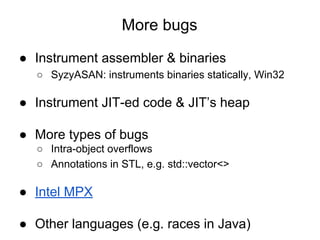
![[1/2] Fantastic C++ Bugs
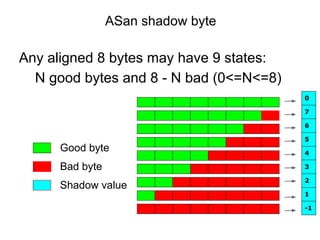
and Where to Find Them
[2/2] Find scary C++ bugs
before they find you
Konstantin Serebryany, Google
May 2014 @compsciclub.ru](https://image.slidesharecdn.com/20140531serebryanylecture02findscarycppbugs-140602051548-phpapp01/85/20140531-serebryany-lecture02_find_scary_cpp_bugs-1-320.jpg)
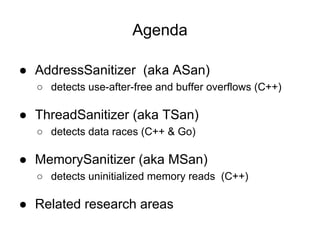
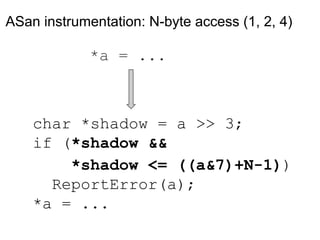
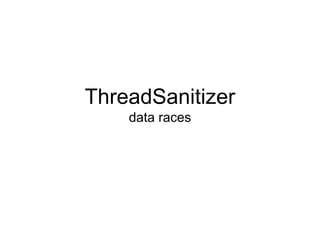
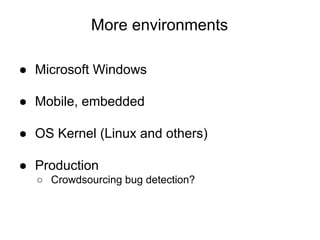
![int global_array[100] = {-1};
int main(int argc, char **argv) {
return global_array[argc + 100]; // BOOM
}
% clang++ -O1 -fsanitize=address a.cc ; ./a.out
==10538== ERROR: AddressSanitizer global-buffer-overflow
READ of size 4 at 0x000000415354 thread T0
#0 0x402481 in main a.cc:3
#1 0x7f0a1c295c4d in __libc_start_main ??:0
#2 0x402379 in _start ??:0
0x000000415354 is located 4 bytes to the right of global
variable 'global_array' (0x4151c0) of size 400
ASan report example: global-buffer-overflow](https://image.slidesharecdn.com/20140531serebryanylecture02findscarycppbugs-140602051548-phpapp01/85/20140531-serebryany-lecture02_find_scary_cpp_bugs-5-320.jpg)
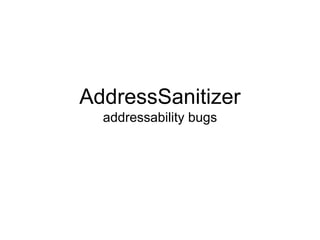
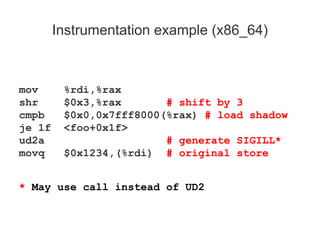
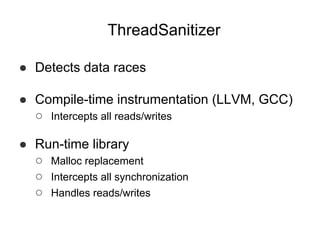
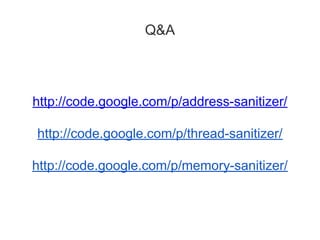
![int main(int argc, char **argv) {
int stack_array[100];
stack_array[1] = 0;
return stack_array[argc + 100]; // BOOM
}
% clang++ -O1 -fsanitize=address a.cc; ./a.out
==10589== ERROR: AddressSanitizer stack-buffer-overflow
READ of size 4 at 0x7f5620d981b4 thread T0
#0 0x4024e8 in main a.cc:4
Address 0x7f5620d981b4 is located at offset 436 in frame
<main> of T0's stack:
This frame has 1 object(s):
[32, 432) 'stack_array'
ASan report example: stack-buffer-overflow](https://image.slidesharecdn.com/20140531serebryanylecture02findscarycppbugs-140602051548-phpapp01/85/20140531-serebryany-lecture02_find_scary_cpp_bugs-6-320.jpg)
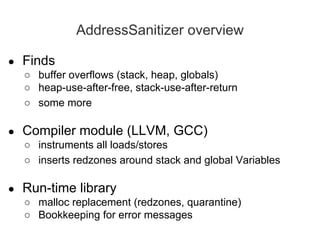
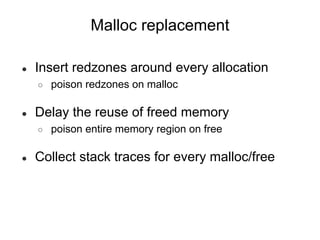
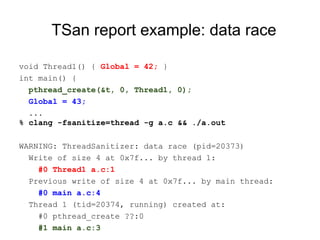
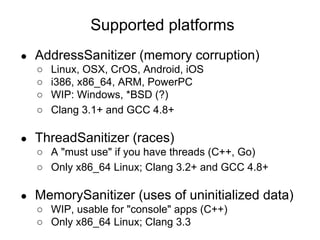
![int main(int argc, char **argv) {
int *array = new int[100];
int res = array[argc + 100]; // BOOM
delete [] array;
return res;
}
% clang++ -O1 -fsanitize=address a.cc; ./a.out
==10565== ERROR: AddressSanitizer heap-buffer-overflow
READ of size 4 at 0x7fe4b0c76214 thread T0
#0 0x40246f in main a.cc:3
0x7fe4b0c76214 is located 4 bytes to the right of 400-
byte region [0x7fe..., 0x7fe...)
allocated by thread T0 here:
#0 0x402c36 in operator new[](unsigned long)
#1 0x402422 in main a.cc:2
ASan report example: heap-buffer-overflow](https://image.slidesharecdn.com/20140531serebryanylecture02findscarycppbugs-140602051548-phpapp01/85/20140531-serebryany-lecture02_find_scary_cpp_bugs-7-320.jpg)
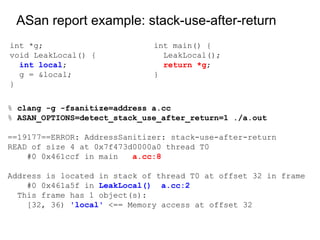
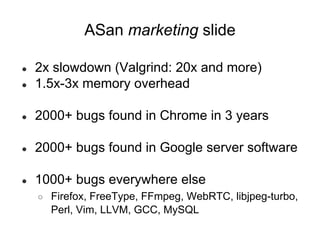
![ASan report example: use-after-free
int main(int argc, char **argv) {
int *array = new int[100];
delete [] array;
return array[argc]; // BOOM
}
% clang++ -O1 -fsanitize=address a.cc && ./a.out
==30226== ERROR: AddressSanitizer heap-use-after-free
READ of size 4 at 0x7faa07fce084 thread T0
#0 0x40433c in main a.cc:4
0x7faa07fce084 is located 4 bytes inside of 400-byte
region
freed by thread T0 here:
#0 0x4058fd in operator delete[](void*) _asan_rtl_
#1 0x404303 in main a.cc:3
previously allocated by thread T0 here:
#0 0x405579 in operator new[](unsigned long) _asan_rtl_
#1 0x4042f3 in main a.cc:2](https://image.slidesharecdn.com/20140531serebryanylecture02findscarycppbugs-140602051548-phpapp01/85/20140531-serebryany-lecture02_find_scary_cpp_bugs-8-320.jpg)
![Instrumenting stack frames
void foo() {
char a[328];
<------------- CODE ------------->
}](https://image.slidesharecdn.com/20140531serebryanylecture02findscarycppbugs-140602051548-phpapp01/85/20140531-serebryany-lecture02_find_scary_cpp_bugs-15-320.jpg)
![Instrumenting stack frames
void foo() {
char rz1[32]; // 32-byte aligned
char a[328];
char rz2[24];
char rz3[32];
int *shadow = (&rz1 >> 3) + kOffset;
shadow[0] = 0xffffffff; // poison rz1
shadow[11] = 0xffffff00; // poison rz2
shadow[12] = 0xffffffff; // poison rz3
<------------- CODE ------------->
shadow[0] = shadow[11] = shadow[12] = 0;
}](https://image.slidesharecdn.com/20140531serebryanylecture02findscarycppbugs-140602051548-phpapp01/85/20140531-serebryany-lecture02_find_scary_cpp_bugs-16-320.jpg)
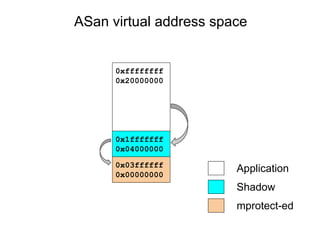
![Instrumenting globals
int a;
struct {
int original;
char redzone[60];
} a; // 32-aligned](https://image.slidesharecdn.com/20140531serebryanylecture02findscarycppbugs-140602051548-phpapp01/85/20140531-serebryany-lecture02_find_scary_cpp_bugs-17-320.jpg)
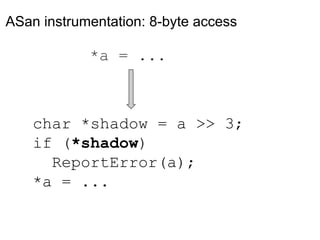
![MSan report example: UMR
int main(int argc, char **argv) {
int x[10];
x[0] = 1;
if (x[argc]) return 1;
...
% clang -fsanitize=memory a.c -g; ./a.out
WARNING: MemorySanitizer: UMR (uninitialized-memory-read)
#0 0x7ff6b05d9ca7 in main stack_umr.c:4
ORIGIN: stack allocation: x@main](https://image.slidesharecdn.com/20140531serebryanylecture02findscarycppbugs-140602051548-phpapp01/85/20140531-serebryany-lecture02_find_scary_cpp_bugs-39-320.jpg)
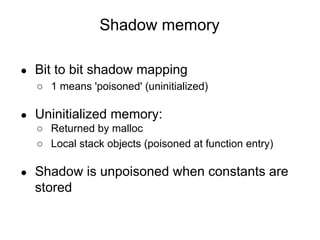
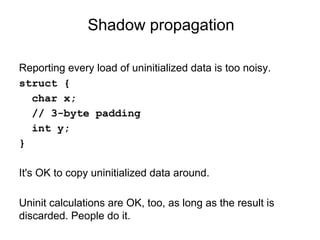
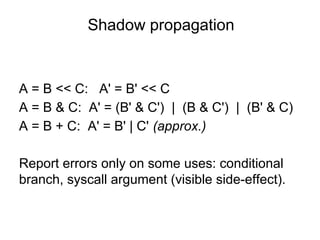
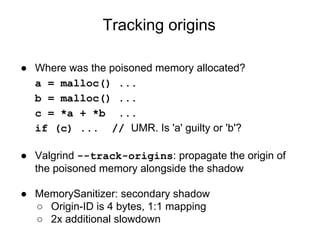
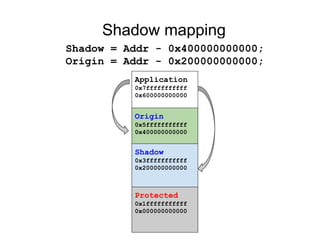
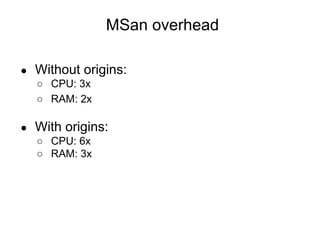
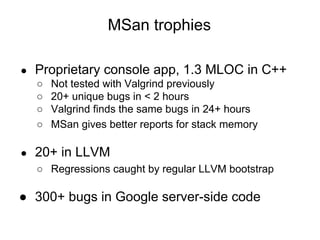

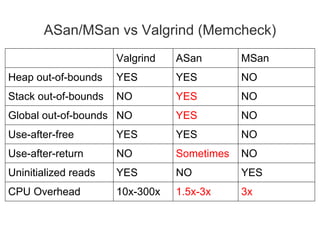

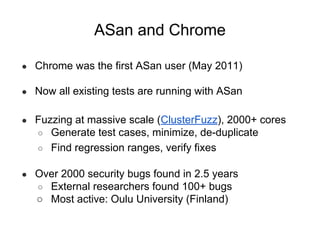
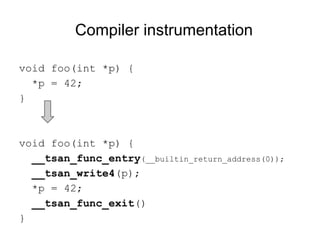
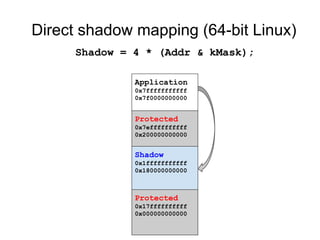
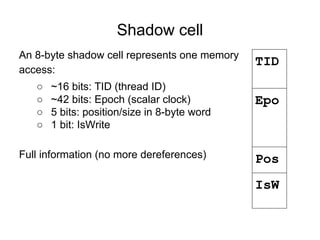
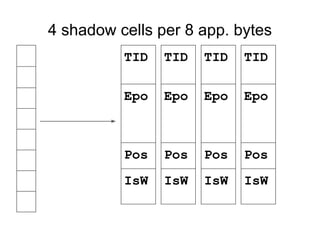
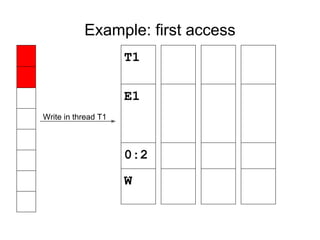
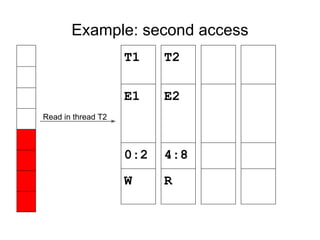
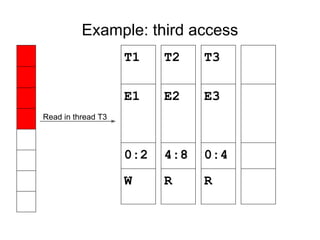
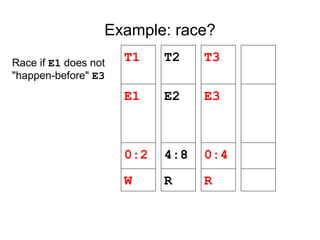
AddressSanitizer, ThreadSanitizer, and MemorySanitizer are compiler-based tools that detect bugs like buffer overflows, data races, and uninitialized memory reads in C/C++ programs. AddressSanitizer instruments loads and stores to detect out-of-bounds memory accesses. ThreadSanitizer intercepts synchronization calls to detect data races between threads. MemorySanitizer tracks initialized and uninitialized memory using shadow memory to find uses of uninitialized values. The tools have found thousands of bugs with low overhead. Future work includes supporting more platforms and languages and detecting additional bug classes.