Download as PDF, PPTX


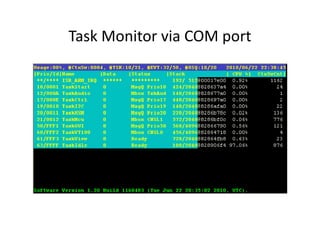


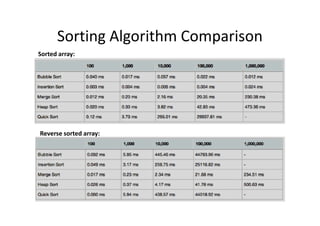
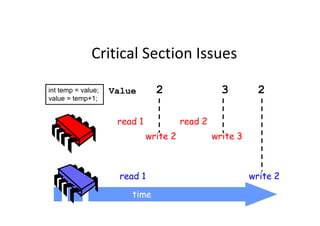
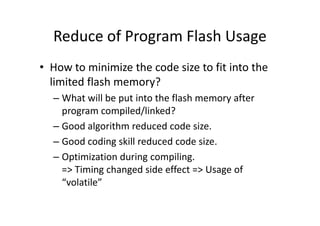
![Local variables in “run-time stack”
_TEXT segment byte public 'CODE'
;
; int func(char cc,int ii,long jj)
;
assume cs:_TEXT
_func proc near
push bp
mov bp,sp
sub sp,4
;
; {
; int k=0, l=1;
;
mov word ptr [bp-2],0
mov word ptr [bp-4],1
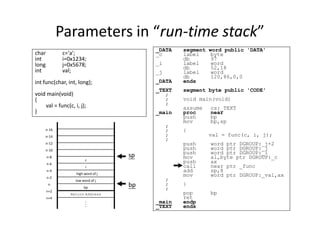
char c='a';
int i=0x1234;
long j=0x5678;
int val;
int func(char cc, int ii, long jj)
{
int k=0, l=1;
return ii;
}
void main(void)
{
val = func(c, i, j);
}
ENTER Instruction
mov word ptr [bp-4],1
;
; return k;
;
mov ax,word ptr [bp+6]
jmp short @1@58
@1@58:
;
; }
;
mov sp,bp
pop bp
ret
_func endp
;
; void main(void)
;
assume cs:_TEXT
_main proc near
...
_main endp
_TEXT ends
}
n-4
n-2
n
n+2
n+4
n+6
n+8
n+10
n+12
n+14
n+16
Return Address
.
.
.
low word of j =jj
I =ii
c =cc
bp
high word of j =jj
Return Address
sp
bpbp
?? = l
?? = k
Control
Link
bp
LEAVE Instruction](https://image.slidesharecdn.com/add83ea2-5c3e-4a32-a4a0-fb3837f22be8-170220130724/85/ExperiencesSharingOnEmbeddedSystemDevelopment_20160321-14-320.jpg)
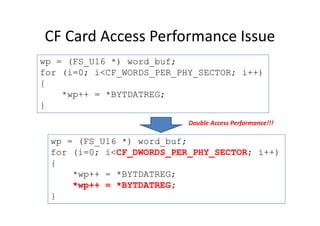
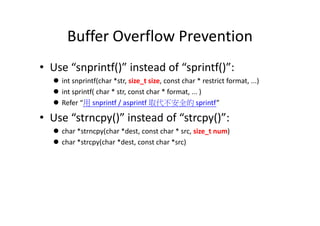
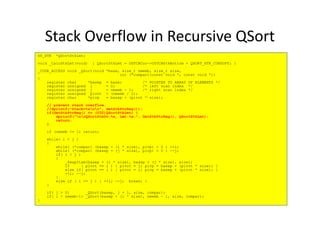
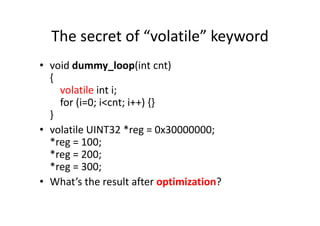
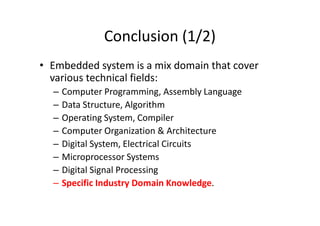
![Buffer/Stack Overflow in Local Array
void foo(const char* input)
{
char buf[10];
sprintf(buf, "Hello World, %s.n“, input);
}
int main(int argc, char* argv[]) { buf[3] buf[2] buf[1] buf[0]int main(int argc, char* argv[]) {
foo(argv[1]);
return 0;
}
buf[3] buf[2] buf[1] buf[0]
buf[7] buf[6] buf[5] buf[4]
……………….. buf[9] buf[8]](https://image.slidesharecdn.com/add83ea2-5c3e-4a32-a4a0-fb3837f22be8-170220130724/85/ExperiencesSharingOnEmbeddedSystemDevelopment_20160321-15-320.jpg)
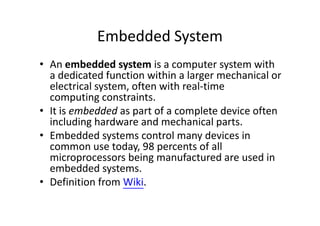
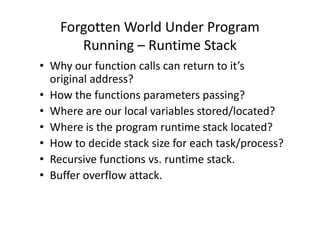
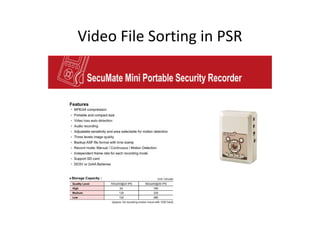
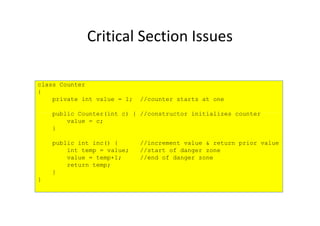
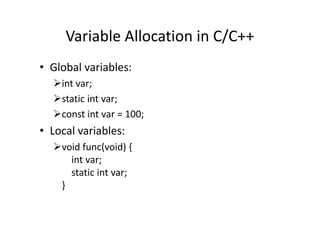
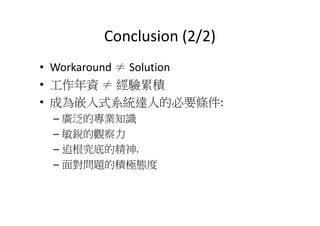
![Buffer Overflow Attack
#include <stdio.h>
#include <string.h>
int main(void)
{
char buff[15];
int pass = 0;
printf("n Enter the password : n");
gets(buff);
if(strcmp(buff, "thegeekstuff"))
$ ./bfrovrflw
Enter the password :
thegeekstuff
Correct Password
Run with correct password:
if(strcmp(buff, "thegeekstuff"))
{
printf ("n Wrong Password n");
}
else
{
printf ("n Correct Password n");
pass = 1;
}
if(pass)
{
/* Now Give root or admin rights to user*/
printf ("n Root privileges given to user n");
}
return 0;
}
Root privileges given to the user
$ ./bfrovrflw
Enter the password :
hhhhhhhhhhhhhhhhhhhh
Wrong Password
Root privileges given to the user
Run with buffer overflow attack:](https://image.slidesharecdn.com/add83ea2-5c3e-4a32-a4a0-fb3837f22be8-170220130724/85/ExperiencesSharingOnEmbeddedSystemDevelopment_20160321-17-320.jpg)
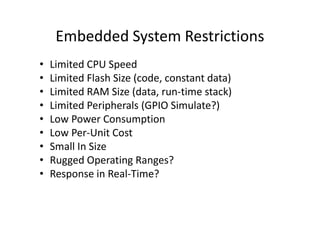
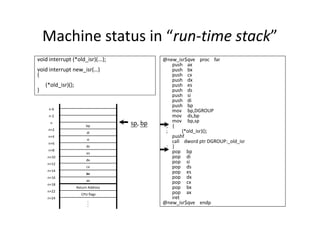
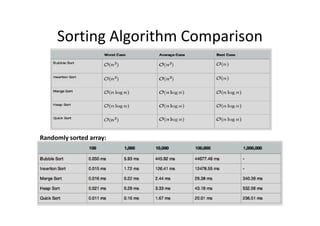
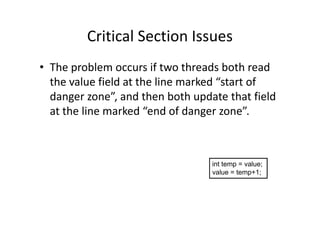
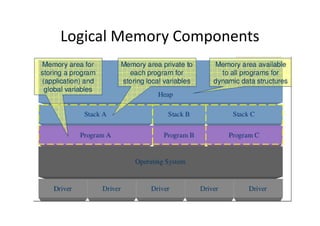
![/*
StackOverrun.c
This program shows an example of how a stack-based
buffer overrun can be used to execute arbitrary code. Its
objective is to find an input string that executes the function bar.
*/
#pragma check_stack(off)
#include <string.h>
#include <stdio.h>
void foo(const char* input)
Stack Overrun Example from
Howard and LeBlanc
{
char buf[10];
printf("My stack looks like:n%pn%pn%pn%pn%pn% pnn");
strcpy(buf, input);
printf("%sn", buf);
printf("Now the stack looks like:n%pn%pn%pn%pn%pn%pnn");
}
void bar(void)
{
printf("Augh! I've been hacked!n");
}
int main(int argc, char* argv[])
{
//Blatant cheating to make life easier on myself
printf("Address of foo = %pn", foo);
printf("Address of bar = %pn", bar);
if (argc != 2)
{
printf("Please supply a string as an
argument!n");
return -1;
}
foo(argv[1]);
return 0;
}](https://image.slidesharecdn.com/add83ea2-5c3e-4a32-a4a0-fb3837f22be8-170220130724/85/ExperiencesSharingOnEmbeddedSystemDevelopment_20160321-18-320.jpg)


This document discusses embedded system development. It begins with definitions of embedded systems and some of their common characteristics like limited resources and real-time constraints. It then discusses specific issues like memory alignment, flash and RAM sizes, and performance optimizations. Examples are given of embedded projects like digital video recorders and how to address issues like file sorting, memory usage and stack overflows. The conclusion emphasizes that embedded systems involve knowledge from many technical fields and stresses the importance of experience, observation, and a positive problem-solving attitude.