Recommended

Recommended
More Related Content
What's hot
What's hot (19)
Viewers also liked
Viewers also liked (14)
More from Anand Chokshi
More from Anand Chokshi (20)
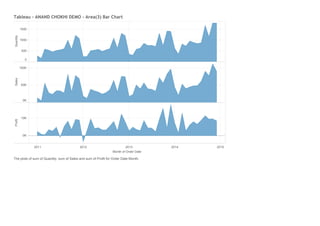
Tableau - ANAND CHOKHI DEMO - Area(3) Bar Chart
- 1. 2011 2012 2013 2014 2015 MonthofOrderDate 0 500 1000 1500 Quantity 0K 50K 100K Sales 0K 10K ProfitTableau-ANANDCHOKHIDEMO-Area(3)BarChart TheplotsofsumofQuantity,sumofSalesandsumofProfitforOrderDateMonth.