
Recommended
Recommended
More Related Content
What's hot
What's hot (18)
Similar to Houston industrial report suite q1 2018
Similar to Houston industrial report suite q1 2018 (20)
Recently uploaded
Recently uploaded (20)
Houston industrial report suite q1 2018
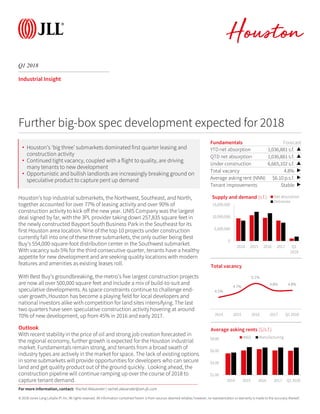
- 1. © 2018 Jones Lang LaSalle IP, Inc. All rights reserved. All information contained herein is from sources deemed reliable; however, no representation or warranty is made to the accuracy thereof. Q1 2018 Houston Industrial Insight Houston’s top industrial submarkets, the Northwest, Southeast, and North, together accounted for over 77% of leasing activity and over 90% of construction activity to kick off the new year. UNIS Company was the largest deal signed by far, with the 3PL provider taking down 257,835 square feet in the newly constructed Bayport South Business Park in the Southeast for its first Houston area location. Nine of the top 10 projects under construction currently fall into one of these three submarkets, the only outlier being Best Buy’s 554,000-square-foot distribution center in the Southwest submarket. With vacancy sub-5% for the third consecutive quarter, tenants have a healthy appetite for new development and are seeking quality locations with modern features and amenities as existing leases roll. With Best Buy’s groundbreaking, the metro’s five largest construction projects are now all over 500,000 square feet and include a mix of build-to-suit and speculative developments. As space constraints continue to challenge end- user growth, Houston has become a playing field for local developers and national investors alike with competition for land sites intensifying. The last two quarters have seen speculative construction activity hovering at around 70% of new development, up from 45% in 2016 and early 2017. Outlook With recent stability in the price of oil and strong job creation forecasted in the regional economy, further growth is expected for the Houston industrial market. Fundamentals remain strong, and tenants from a broad swath of industry types are actively in the market for space. The lack of existing options in some submarkets will provide opportunities for developers who can secure land and get quality product out of the ground quickly. Looking ahead, the construction pipeline will continue ramping up over the course of 2018 to capture tenant demand. Fundamentals Forecast YTD net absorption 1,036,881 s.f. ▲ QTD net absorption 1,036,881 s.f. ▲ Under construction 6,665,102 s.f. ▲ Total vacancy 4.8% ▶ Average asking rent (NNN) $6.10 p.s.f. ▶ Tenant improvements Stable ▶ 0 5,000,000 10,000,000 15,000,000 2014 2015 2016 2017 Q1 2018 Supply and demand (s.f.) Net absorption Deliveries Further big-box spec development expected for 2018 4.5% 4.7% 5.1% 4.8% 4.8% 2014 2015 2016 2017 Q1 2018 Total vacancy For more information, contact: Rachel Alexander | rachel.alexander@am.jll.com • Houston’s ‘big three’ submarkets dominated first quarter leasing and construction activity • Continued tight vacancy, coupled with a flight to quality, are driving many tenants to new development • Opportunistic and bullish landlords are increasingly breaking ground on speculative product to capture pent up demand $2.00 $4.00 $6.00 $8.00 2014 2015 2016 2017 Q1 2018 Average asking rents ($/s.f.) W&D Manufacturing
- 2. Houston Q1 2018 Industrial Statistics Inventory (s.f.) Quarterly total net absorption (s.f.) YTD total net absorption (s.f.) YTD total net absorption (% of stock) Total vacancy (%) Total availability (%) Average direct asking rent ($ p.s.f.) Quarterly completions (s.f.) YTD completions (s.f.) Under construction (s.f.) Houston Totals Warehouse & Distribution 344,591,291 1,436,482 1,436,482 0.4% 5.1% 8.8% $6.02 1,774,563 1,774,563 6,665,102 Manufacturing 85,492,009 -399,601 -399,601 -0.5% 3.7% 7.2% $6.55 38,420 38,420 0 Totals 430,083,300 1,036,881 1,036,881 0.2% 4.8% 8.5% $6.10 1,812,983 1,812,983 6,665,102 Submarkets CBD Warehouse & Distribution 34,425,497 -129,983 -129,983 -0.4% 5.4% 10.0% $4.21 0 0 0 Manufacturing 10,521,837 -16,788 -16,788 -0.2% 2.8% 10.2% $7.02 0 0 0 Totals 44,947,334 -146,771 -146,771 -0.3% 4.8% 10.1% $4.38 0 0 0 Northwest Warehouse & Distribution 97,961,357 981,304 981,304 1.0% 5.5% 10.3% $6.48 1,170,661 1,170,661 1,899,744 Manufacturing 22,487,407 -19,039 -19,039 -0.1% 3.7% 8.3% $6.32 38,420 38,420 0 Totals 120,448,764 962,265 962,265 0.8% 5.1% 9.9% $6.45 1,209,081 1,209,081 1,899,744 North Warehouse & Distribution 56,662,706 419,182 419,182 0.7% 6.8% 10.3% $6.63 0 0 1,272,406 Manufacturing 14,086,604 -29,533 -29,533 -0.2% 4.4% 5.8% $5.86 0 0 0 Totals 70,749,310 389,649 389,649 0.6% 6.4% 9.4% $6.49 0 0 1,272,406 Northeast Warehouse & Distribution 24,065,776 71,854 71,854 0.3% 2.9% 5.5% $5.13 143,500 143,500 0 Manufacturing 6,514,961 -54,220 -54,220 -0.8% 2.8% 3.7% $6.00 0 0 0 Totals 30,580,737 17,634 17,634 0.1% 2.9% 5.1% $5.27 143,500 143,500 0 Southeast Warehouse & Distribution 63,239,766 12,549 12,549 0.0% 4.7% 9.1% $5.75 460,402 460,402 2,867,359 Manufacturing 16,783,307 -138,921 -138,921 -0.8% 4.3% 5.3% $9.12 0 0 0 Totals 80,023,073 -126,372 -126,372 -0.2% 4.6% 8.3% $6.32 460,402 460,402 2,867,359 South Warehouse & Distribution 28,131,465 -64,110 -64,110 -0.2% 2.7% 5.2% $4.65 0 0 71,593 Manufacturing 8,102,485 0 0 0.0% 0.4% 5.1% $4.42 0 0 0 Totals 36,233,950 -64,110 -64,110 -0.2% 2.2% 5.2% $4.60 0 0 71,593 Southwest Warehouse & Distribution 40,104,724 145,686 145,686 0.4% 4.8% 6.1% $6.66 0 0 554,000 Manufacturing 6,995,408 -141,100 -141,100 -2.0% 7.0% 12.0% $7.47 0 0 0 Totals 47,100,132 4,586 4,586 0.0% 5.1% 7.0% $6.84 0 0 554,000 Rachel Alexander | Research Manager 1400 Post Oak Blvd., Suite 1100, Houston, TX 77056 | tel +1 713 888 4044 | rachel.alexander@am.jll.com 2018 Jones Lang LaSalle IP, Inc. All rights reserved.
- 3. Houston Q1 2018 Industrial leasing activity This report analyzes all closed industrial leases > 20,000 s.f. 49 2,589,382 2,251,264 338,118 - 49 2,589,382 Avg. building construction date 10% 7% 23% 20% 15% 12% Top 10 lease transactions during the quarter Size Building status Year built 257,835 Existing 2018 170,017 Existing 1980 138,921 Existing 1976 124,385 Existing 2015 112,000 Existing 2016 107,600 Existing 1980 94,000 Existing 1970 92,000 Existing 1988 90,864 Existing 2014 89,440 Under Construction 2018 Palmer Logistics 8575 Volta Dr North Richardson Steel DirectNorthMcLane Global 1902 Cypress Station Dr Leader Gasket 850 Sens Rd Southeast Direct Undisclosed 11220 Ella Blvd North Direct WeldFit 11800 Charles Rd Northwest Direct Undisclosed 3000 Brittmoore Rd Northwest Flexo Converters USA Direct Balflex USA 6000 S Loop Frwy E South Direct Direct Lease type 10535 Red Bluff Rd Southeast Direct 2333 Clinton Dr Southeast Northeast9033-9055 Spikewood Dr Direct Direct UNIS Company Tenant Address Submarket Avg. lease size (in s.f.) Expansion in market Expansion in building Renewal Extension (< 36-month term) Relocation within market New to market Leasing activity by submarket QTD At a glance Total leases QTD Total s.f. leased QTD Leasing activity by size QTD Total s.f. leased QTD: Warehouse/Distribution Leasing activity QTD 1994 Total s.f. leased QTD: Manufacturing Leasing activity (s.f.) by transaction type QTD Total s.f. leased QTD: Special Purpose Total leases YTD 52,845 Total s.f. leased YTD 1 5 9 34 - 200,000 400,000 600,000 800,000 1,000,000 1,200,000 250,000-499,999 100,000-249,999 50,000-99,999 10,000-49,999 Total leased Number of leases 27.7% 25.3% 24.4% 6.6% 5.9% 5.4% 4.7% Southeast North Northwest Northeast Southwest South CBD - 2,000,000 4,000,000 6,000,000 8,000,000 Q1 2016 Q2 2016 Q3 2016 Q4 2016 Q1 2017 Q2 2017 Q3 2017 Q4 2017 Q1 2018 Historical leasing activity Source: JLL Research 2017 Jones Lang LaSalle IP, Inc. All rights reserved.
- 4. Q1 2018 Industrial development This report analyzes all industrial developments under construction & new deliveries > 30,000 s.f. Total leased at delivery (%) 86.3% Total speculative at delivery (s.f.) 653,483 Total BTS at delivery (s.f.) 1,159,500 Total Owner-User at delivery (s.f.) - Total # of properties delivered 7 Asking rental rate (low - high) Withheld Top 5 projects delivered to date Building RBA (s.f.) Delivery date Leased at delivery (%) 31819 Highway 90 E 1,016,000 Q1 2018 100% Bayport South Business Park 257,835 Q1 2018 100% Independence Logistics Park Bldg 10 167,867 Q1 2018 44% 6410 Langfield Rd 154,661 Q1 2018 0% 13300 Lockwood Rd 143,500 Q1 2018 100% Total pre-leased (%) 41.5% Total speculative under construction (s.f.) 4,599,915 Total BTS under construction (s.f.) 2,065,187 Total Owner-user under construction (s.f.) - Total # of properties UC 26 Asking rental rate (low - high) Withheld Top 5 projects currently under construction Building RBA (s.f.) Delivery date Pre-leased (%) 525 Cane Island Pkwy 673,785 Q3 2018 0% Emser Tile 601,426 Q2 2018 100% Port Crossing Commerce Center Bldg 2 600,360 Q2 2018 0% Best Buy Distribution Center 554,000 Q4 2018 100% Vinmar International 500,006 Q3 2018 100% Speculative Speculative BTS Submarket Under construction 6,665,102 Under construction (s.f.) Under construction in-depth Upcoming deliveries by year (s.f., excludes YTD completions) New deliveries Completions in-depth 1,812,983 Total delivered YTD (s.f.) Historical deliveries (s.f.) Construction typeOwnerSubmarket Northeast Northwest Southeast Southeast Northwest McCord Development Carson Companies Hines Johnson Development Duke Realty BTS Speculative Southeast Southwest Southeast North Northwest BTS BTS Owner Construction type Speculative Avera Companies Seefried Industrial Properties Liberty Property Trust Hines Oakmont Industrial BTS Speculative 0 2,000,000 4,000,000 6,000,000 8,000,000 10,000,000 12,000,000 14,000,000 2011 2012 2013 2014 2015 2016 2017 Q1 2018 0 1,000,000 2,000,000 3,000,000 4,000,000 5,000,000 6,000,000 7,000,000 2018 BTS Speculative Source: JLL Research 2017 Jones Lang LaSalle IP, Inc. All rights reserved.
- 5. Houston Q1 2018 Industrial sales activity This report analyzes all industrial sales > 30,000 s.f. $103,080,720 15 $87 Not available 96% 4.1% 4.75-5.25% 0 0 $0 6.75-7.25% 0 15 $103,080,720 Top 10 sales transactions this year Size (s.f.) $ p.s.f. Sale date 700,644 Undisclosed Feb-18 601,426 Undisclosed Jan-18 262,630 $139 Jan-18 232,950 $96 Feb-18 208,750 $105 Feb-18 129,600 $59 Feb-18 124,900 Undisclosed Feb-18 105,300 $40 Jan-18 94,250 Undisclosed Feb-18 89,375 Undisclosed Feb-18 14310 & 14320 Interdrive E Schroeder Partnership, Ltd Interbelt Truck Terminal Undisclosed 9301-9307 Harwin Dr Undisclosed Undislcosed Undisclosed 8807 Liberty Rd Plateplus Inc Cargill Inc Undisclosed 12200 Parc Crest Dr Matthew Davis Titan RE Investment Group $4,260,000 5737 & 5747 Brittmoore Rd Prologis Triten Real Estate Partners $21,918,750 5650 & 5670 Guhn Rd Trien Real Estate Partners Prologis $7,646,400 8844, 8846, 8848 & 8850 N Sam Houston Pkwy W Sealy & Company The Levey Group $36,505,570 Multiple STAG Industrial AIV, Inc. $22,400,000 10700 Telge Rd Crow Holdings Albertsons Companies Undisclosed 10433 Ella Blvd Coca-Cola TIAA-CREF Undisclosed Building address Buyer company Seller company Sales price $ Core Class A Flex Average partial interest acquired Number of domestic buyers Domestic capital $ Sales volume $ by submarket Top buyers (s.f.) Top sellers (s.f.) Cap rate range Transactions details Core Class A Ind. Number of partial interest transactions Number of foreign buyers Foreign capital $ At a glance Sales activity by building type Total volume YTD Number of transactions YTD Average Class A price p.s.f. YTD Average Class A cap rate YTD Warehouse/Dist. sales volume as % of total YTD Manufacturing sales volume as % of total YTD 29% 24% 11% 9% 9% 5% 5% 4% 4% Crow Holdings Coca-Cola Sealy & Company STAG Industrial Prologis Trien Real Estate Partners Plateplus Inc Matthew Davis Schroeder Partnership, Ltd 29% 24% 11% 9% 9% 5% 5% 4% 4% Albertsons Companies TIAA-CREF The Levey Group AIV, Inc. Triten Real Estate Partners Prologis Cargill Inc Titan RE Investment Group Interbelt Truck Terminal $98,820,720 $4,260,000 2,775,561 105,300 0 s.f. 500,000 s.f. 1,000,000 s.f. 1,500,000 s.f. 2,000,000 s.f. 2,500,000 s.f. 3,000,000 s.f. $0 $20,000,000 $40,000,000 $60,000,000 $80,000,000 $100,000,000 $120,000,000 Warehouse / Distribution Manufacturing $4,260,000 $7,100,000 $91,720,720 Southwest South Northwest Source: JLL Research 2017 Jones Lang LaSalle IP, Inc. All rights reserved.
- 6. Q1 2018 Warehouse/Distribution large blocks This report analyzes all existing and under construction contiguous warehouse/distribution blocks > 100,000 s.f. Address Submarket Block size Year built 10700 Telge Rd Northwest 700,644 1983 525 Cane Island Pkwy Northwest 673,785 2018 4906 Broadway St Southeast 605,879 1954 1302 Wharton Weems Blvd Southeast 600,360 2018 600 Fallbrook Dr North 500,400 2016 9835A Genard Rd Northwest 417,350 1980 6751 N Eldridge Pkwy Northwest 411,442 2018 7500 Volta Dr North 337,700 2018 I-10 East & Thompson Rd Southeast 294,323 2018 11833 Cutten Rd North 293,280 2018 Houston Largest block by submarket Top 10 largest contiguous blocks Northeast Quick stats 700,644 605,879 500,400 237,879 217,440 179,900 162,178 Submarket s.f. Total market availability Total number of blocks Total s.f. of blocks Largest block 61 12,600,686 700,644 Northwest Southeast North CBD Southwest South 206,569Average block Blocks by size Submarket concentrations 11 8 15 27 0 5 10 15 20 25 30 250,000 + 200,000 - 249,999 150,000 - 199,999 100,000 - 149,999 7.0% 7.5% 8.0% 8.5% 9.0% 9.5% 10.0% Q1 16 Q2 16 Q3 16 Q4 16 Q1 17 Q2 17 Q3 17 Q4 17 Q1 18 Northwest, 4,872,317 North, 1,890,172 Northeast, 526,479 Southeast, 3,727,056 South, 412,900 Southwest, 217,440 CBD, 954,322 JLL Research 2017 Jones Lang LaSalle IP, Inc. All rights reserved.